

Abstract
Background & Aims:
While a dysregulated type 1 immune response is integral to the pathogenesis of biliary atresia, studies in both humans and mice have uncovered a type 2 response, primarily driven by type 2 innate lymphoid cells. In non-hepatic tissues, natural ILC2s (nILC2s) regulate epithelial proliferation and tissue repair, whereas inflammatory ILC2s (iILC2s) drive tissue inflammation and injury. The aim of this study is to determine the mechanisms used by ILC2 subpopulations to regulate biliary epithelial response to an injury.
Approach & Results:
Using Spearman correlation analysis, nILC2 transcripts, but not those of iILC2s, are positively associated with cholangiocyte abundance in biliary atresia patients at time of diagnosis. Natural ILC2s are identified in the mouse liver via flow cytometry. They undergo expansion and increase amphiregulin production after IL-33 administration. This drives epithelial proliferation dependent on the IL-13/IL-4Rα/STAT6 pathway as determined by decreased nILC2s and reduced epithelial proliferation in knockout strains. The addition of IL-2 promotes inter-lineage plasticity towards an nILC2 phenotype. In experimental biliary atresia induced by rotavirus, this pathway promotes epithelial repair and tissue regeneration. The genetic loss or molecular inhibition of any part of this circuit switches nILC2s to iILC2-like, resulting in decreased amphiregulin production, decreased epithelial proliferation, and the full phenotype of experimental biliary atresia.
Conclusions:
These findings identify a key function of the IL-13/IL-4Rα/STAT6 pathway in ILC2 plasticity and an alternate circuit driven by IL-2 to promote nILC2 stability and amphiregulin expression. This pathway induces epithelial homeostasis and repair in experimental biliary atresia.
Biliary atresia is a severe inflammatory and fibrosing cholangiopathy of early infancy and the leading cause of liver transplantation in children.1,2 The etiology of biliary atresia is multifactorial and driven by genetic, immune, and environmental variables. Several studies have shown that immune dysregulation is a key underpinning to pathogenesis.3–10 Most recently, Wang et al. compared mononuclear single-cell transcriptomes and lymphocyte single-cell V(D)J profiling in the livers of patients with biliary atresia at the time of diagnosis and in control patients.10 This powerful approach demonstrated multiple pathways of immune dysregulation in biliary atresia and supported previous mechanistic studies performed in the neonatal mouse model of biliary atresia induced by rotavirus infection.5,6,8,11–18 These studies demonstrated a role for a type 1-rich environment created by the activation of macrophages, plasmacytoid dendritic cells, natural killer cells and CD8+ T cells, with the expression of integrins, cytokines and chemokines, such as IL-8, IL-15, and TNF.9,13,14,18–21
In parallel to this pro-inflammatory type 1 environment in the hepatobiliary system, studies in both mice and humans have uncovered a type 2 response, primarily driven by the recruitment of type 2 innate lymphoid cells (ILC2s) that release IL-13 and IL-3310,15,22,23. While the role of this ILC2-driven type 2 response is not fully understood, it has been linked to disparate functions, including proliferation of the bile duct epithelium, hepatic fibrosis, and pro-oncogenic signals.3,22,24–26 At other barrier sites, such as the gut and lung, ILC2s promote tissue homeostasis and integrity by releasing amphiregulin (AREG).27–30 However, the underlying mechanisms regulating ILC2s, AREG expression, and their relationships within the hepatobiliary system remain unknown.
In this study, we investigate how the functional plasticity of hepatobiliary ILC2s regulate epithelial repair. ILC2s populate peripheral tissues at a steady state as natural ILC2s (nILC2s, Lin−ST2+KLRGint) and produce epithelial growth factors, including AREG. In contrast, inflammatory ILC2s (iILC2s, Lin−ST2−KLRGhiIL-25R+) emerge in the context of inflammation, virus infection, or exposure to IL-25.31,32 We report that nILC2, but not iILC2, transcripts are associated with abundance of cholangiocytes in patients with biliary atresia at time of diagnosis. Mechanistic studies in mice investigating nILC2 stability and plasticity show that activation of IL-13/IL-4Rα (the receptor for IL-13 and IL-4) and downstream STAT6 signaling promote stability of hepatic nILC2s, AREG production, and epithelial proliferation. We also found a key role for IL-2 in the regulation of this pathway and ILC2 cell plasticity. In experimental biliary atresia, the disruption of this molecular circuit impairs epithelial repair and allows for the full phenotype of disease.
MATERIALS AND METHODS
Mice
All animal studies were performed in strict accordance with the National Institutes of Health guidelines for use and care of live animals and were approved by the Institutional Animal Care and Use Committees of Cincinnati Children’s Hospital Medical Center. Wild-type (WT) BALB/c mice were purchased from Charles River Laboratories and Il4ra−/− and Stat6−/− mice (on a BALB/c background) were obtained from The Jackson Laboratory. The Rag2−/−gc−/− mice (on a C57BL/6 background) were purchased from Taconic Laboratories, and Il13−/− mice on a BALB/c background22 were bred and backcrossed to C57BL/6 background to the 6th generation in our facilities (Cincinnati Children’s Hospital Medical Center). The experimental animals were cohoused, acclimated, and maintained in microisolator cages in a pathogen-free facility equipped with a 12-hour dark light cycle and temperature and humidity maintained between 65–75°F and 40–60%, respectively. Mice had free access to water and sterilized chow (Purina LabChows Rodent Laboratory Chow 5010; Protein: 23.0%, Fat: 4.5%, Fiber: 6.0%) and were monitored daily by veterinary and study staff to assure humane conditions. For in vivo experiments, IL-33 was injected intraperitoneally to mice daily with specified dose and timing. The number of mice in each experiment is presented in the figure legends.
Antibodies and reagents
The following fluorochrome-conjugated anti-mouse antibodies were obtained from Biolegend: Lineage cocktail (anti-CD3 (17A2), CD4 (RM4–5), B220 (RA3–6B2), CD49b (DX5), CD11b (M1/70), CD11c (N418), F4/80 (BM8), Gr-1 (RB6–8C5), FcεR1α (MAR-1), Ter119 (TER-119)), ST2 (DIH4), KLRG1 (2F1/KLRG1), CD44 (IM7), CD62L (MEL-14), IL-4 (11B11), and IL-17 (TC11–18H10.1). Anti-mouse IL-25R (170220) was purchased from R&D Systems. Anti-mouse IL-5 (T21) and IFNg (XMG1.2) were purchased from BD Biosciences. Anti-mouse IL-13 (eBio13A) was purchased from eBioscience. Recombinant mouse AREG (262-AR) and anti-mouse IL-2 antibody (MAB-702) were from R&D Systems. Recombinant mouse IL-33 (0.1 or 1 μg injected intraperitoneally) was from BioLegend. Initial experiments were conducted with 1 μg; however, similar cholangiocyte proliferation was achieved with as little as 0.1 μg administered to adult mice.3 Anti-AREG antibody (200 μg/ mouse) was purchased from R&D Systems. Biotin Anti-BrdU antibody was purchased from Abcam for immunohistochemistry staining. The Rabbit IgG Vectastain ABC Kit (Vector Laboratories) was used for blocking, antibody incubations, and signal amplification according to the manufacturer’s instructions. Purified anti-CK19 antibody was from Abcam and anti-PanCK antibody was purchased from Dako. DyLight 488–conjugated donkey anti-goat and DyLight 594–conjugated streptavidin antibodies were obtained from Jackson Immunoresearch. ProLong™ Gold antifade mountant (ThermoFisher Scientific) with DAPI was used for nuclear staining.
Non-parenchymal mononuclear cell isolation from liver and bile duct
Hepatic mononuclear cells were obtained by subjecting the livers to dissociation using gentleMACS Dissociator (Miltenyi Biotec) according to the manufacturer-specified and previously described protocols.3,22 The resulting cell suspension was strained through a 40-μm cell filter to obtain single-cell suspensions and then subjected to density centrifugation using 33% Percoll in DMEM (ThermoFisher Scientific) at 836 g, 20°C for 25 minutes. The cell pellets were then washed twice in complete DMEM containing 10% FBS (Corning) followed by red cell lysis using RBC Lysis Buffer (Millipore Sigma) and used in flow cytometry or adoptive transfer experiments. To isolate immune cells from extrahepatic bile ducts, tissues were dissected, disrupted into small pieces and digested with Collagenase IV (Sigma) at 37 °C for 40–60 min. Tissue pieces were strained into single cells, and the leukocytes were purified by centrifugation using 40% Percoll (Sigma) in DMEM cell culture media, followed by RBC Lysis Buffer (Sigma-Aldrich) treatment for flow cytometry analysis.
Lineage negative cell purification and culture
Lin− cell subsets were isolated from livers using the mouse Lineage Cell Depletion Kit (Miltenyi Biotec) according to the manufacturer’s instructions.
Flow cytometry analysis
Intracellular staining and flow cytometry analysis of immune cells from the hepatobiliary tissues was performed according to previously described protocols.3 Cellular phenotyping was performed using cell surface and intracellular markers as described in Antibodies and Reagents. Mononuclear cells were resuspended at a concentration of 1×10⁶-1× 07 cells/ml in FACS buffer (PBS containing 0.1% sodium azide and 2% FBS) and added to a 96-well microtiter plate (Corning) at a volume of 200 μl/well. Cells were then preincubated with 1:200 dilution of anti-mouse FcγII/III receptor mAb CD16/CD32 (2.4G2) for 15 minutes at 4°C to block nonspecific antibody binding to Fc receptors. Surface staining for specific markers was performed by incubating cells with fluorochrome-conjugated antibodies at 4°C for 30 minutes. Intracellular cytokine staining was performed using the Cytofix/Cytoperm (with GolgiPlug) Fixation/Permeabilization kit (BD Biosciences) according to the manufacturer’s instructions. Cells were washed twice with staining buffer, incubated in 100 μl of BD Cytofix/Cytoperm solution for 20 minutes at 4°C and then stained using antigen-specific antibodies. The fluorescent signals were detected using either the FACSCanto II or LSRFortessa flow cytometer (BD Biosciences). Flow cytometric data was analyzed using FlowJo software (Tree Star Inc.).
Histology and immunohistochemistry staining
Livers and extrahepatic bile ducts were harvested from experimental mice and subjected to fixation in 10% formalin for 24–48 hours. After fixation, tissues embedded in paraffin were cut in longitudinal sections and subjected to hematoxylin and eosin (H&E) staining for histopathologic analysis. Immunohistochemistry and immunofluorescence staining was performed using biotinylated anti-BrdU (Abcam), anti-mouse Amphiregulin (AF989; R&D Biosciences), and anti-Cytokeratin-19 (CK19) antibodies (M-17; Santa Cruz Biotechnology). For BrdU epitope staining, citric acid buffer (pH=6) was used for antigen retrieval. In sections undergoing immunohistochemical staining, the color was developed using the DAB peroxidase substrate kit (Vector Laboratories) followed by hematoxylin counterstain. For immunofluorescence studies, sections were stained using rabbit PanCK or goat CK19 (1:100) antibodies and DyLight 488–conjugated donkey anti-goat antibodies (1:1000), followed by biotinylated anti-BrdU antibody (1:200) overnight at 4°C, and DyLight 594–conjugated streptavidin (1:1000). ProLong Gold antifade reagent with DAPI was used to stain the nuclei in the cover glass for the slides. Images were captured using an Olympus BX51 microscope with appropriate filters. Proliferation of cholangiocytes was determined by counting CK19+ and CK19− cells within well-oriented EHBDs at 400X magnification, followed by counting the BrdU+ cells. The percentage of BrdU-positive CK19+ epithelial cells, was determined for each animal on the EHBD sections as previously reported3, with at least 500 cells counted per genotype for each animal.
Adoptive transfer experiments
For adoptive transfer experiments, total hepatic mononuclear cells from a pool of 3 to 4 WT or Il13−/− mice (6- to 8-week-old) after IL-33 injections were subjected to flow sorting to obtain Lin−ST2+ ILC2s cells as previously described.3 A total of 2–4× 10⁴ purified Lin−ST2+ cells from WT or Il13−/− littermate livers were resuspended in 100 μl PBS and injected intraperitoneally into Rag2−/−gc−/−mice; 4 days later, donor ILC2 cells were analyzed by flow cytometry. Proliferation was assessed by analyzing BrdU uptake in paraffin-embedded sections of recipient extrahepatic bile ducts using dual immunofluorescence staining.
Neonatal mouse model of experimental biliary atresia and treatments
Experimental biliary atresia was induced in newborn BALB/c mice by intraperitoneal injection of 1.5 × 10⁶ plaque-forming units (pfu) of RRV in 20 μl volume within the first 24 hours of birth; control newborn mice were injected with a similar volume of 0.9% NaCl (saline) solution. Newborn mice that died within the first 2 days after RRV or saline injections or that were neglected by their mothers were excluded from the study. For IL-33 studies, 0.1 μg of murine IL-33 was injected 24 hours after RRV infection and then daily for 6 days until day of life 7; control mice received an equivalent amount of protein (1% BSA). For blocking the AREG signaling pathway, infected neonatal mice who received IL-33 were injected i.p. with 80 mg/kg of the EGFR inhibitor (pEGFRi). Il4a–/– newborn mice similarly challenged with RRV and receiving IL-33 were injected with IL-2/anti-IL-2 complex (1.5 μg IL-2 plus 15 μg anti-IL-2 mAb) until day 7 of life. The recombinant mouse IL-2 was incubated with mouse anti-IL-2 mAb for 15 min at room temperature before injecting into the neonatal mice.
Bone marrow transplant experiments
Bone marrow was isolated from the femur and tibia of 5- to 6- week-old Thy1.1+/Il4ra+/+ or Thy1.2+/Il4ra−/− mice. Donor bone marrow from Il4ra+/+ or Il4ra−/− mice (0.5–1 × 10⁷ cells in 100 μl PBS) was injected intravenously into sub-lethally irradiated (450 cGy) Il4ra−/− mice. After 5 weeks, cells from recipient livers were analyzed by flow cytometry. Cholangiocyte proliferation was analyzed with BrdU uptake by immunofluorescence staining after 4 daily consecutive IL-33 injections.
RNAseq and survival data of patients with biliary atresia
Bulk liver RNAseq data of 121 patients with biliary atresia was retrieved from previous deposition in the Gene Expression Omnibus database under accession number GSE122340. All research was conducted the accordance with both the Declarations of Helsinki and Istanbul, approved with the institutional review committee, and written consent was given in writing by all subjects. The RPKM values (reads per kilobase of transcript per million reads mapped) were used for analyses. For calculating IL-33 + IL-2 scores, z-score normalizations of the raw RPKM values of IL-33 and IL-2 were performed separately across all the patients. The sum of the normalized levels of IL-33 and IL-2 were defined as the IL-33 + IL-2 scores. Survival data was obtained from previous publication.14 The survival data refers to the time of liver transplant-free survival after hepatoportoenterostomy (HPE).
Estimation of relative cell abundance of specific immune populations in patients with biliary atresia
Estimation of the relative cell abundance of nILC2s, iILC2s, and other targeted immune populations was performed by the single sample Gene Set Enrichment Analysis (ssGSEA) implemented in the GSVA-R package. RPKM values were used as the input. ssGSEA is rank-based method that calculates an enrichment score for each sample.33 The enrichment score was calculated by a sum of the difference between weighted Empirical Cumulative Distribution Functions of the marker genes and the other genes in an expression profile. The enrichment score represents the abundance of cells. The marker genes for nILC2, iILC2, and other immune populations were obtained from previous publications and reported in Table S1.
Statistical analysis
All in vitro experiments were performed at least in triplicate. Student’s t-test (two-tailed) was used to analyze the significance of data comparison with a significance set at P < 0.05, except where indicated otherwise. 1-way or 2-way ANOVA was used for comparison between 3 or more groups, with a significance of P < 0.05. Values are expressed as Mean ± SD. Spearman correlation analyses and plots were performed with corrplot package in R (version 3.6.1). Kaplan-Meier survival curves were generated using GraphPad Prism (GraphPad Software).
RESULTS
ILC2 subtypes predict cholangiocyte proliferation and transplant-free survival in children with biliary atresia
To investigate the clinical implications of ILC2 subpopulations in human infants with biliary atresia, we first performed Spearman correlation analysis among nILC2 and iILC2-associated genes (IL33, IL2, and AREG) and the expression of KRT19 (keratin-19) representing cholangiocytes in an RNAseq dataset from the livers of 121 patients at the time of biliary atresia diagnosis (reported previously in reference14). The abundance of nILC2s and iILC2s was estimated with single sample gene set enrichment analysis (ssGSEA) using marker genes for nILC2s and iILC2s34 (Table S1), respectively. ssGSEA is a rank-based method that calculates an enrichment score for each sample and indicates the abundance of cells.33 Spearman correlation and linear regression analyses confirmed positive correlations between nILC2s and the expression of IL33, IL33 + IL2, AREG, and with the epithelial compartment represented by KRT19 (Figure 1A and B; p < 0.001). Negative correlations were detected with iILC2s (Figure 1B). Natural ILC2s are also positively associated with Th2 cells (rho: 0.63; p < 0.001), neutrophils (rho: 0.68, p < 0.001), macrophages (rho: 0.46, p < 0.001), and eosinophils (rho: 0.38, p < 0.001; Figure S1).
Figure 1. Relationship between ILC2 subtypes, cholangiocyte proliferation, and transplant-free survival in children with biliary atresia.

(A) Spearman correlation matrix among IL2, IL33, IL33 + IL2, AREG, KRT19 and levels of nILC2s and iILC2s (marker genes provided in Table S1). Spearman correlation coefficients are shown. Red indicates positive correlation, while blue indicates negative or no correlation. (B) Linear regression analyses demonstrating linear correlation between nILC2s and iILC2 abundance and expression of genes of interest. Correlation coefficient r and P value is shown, with the grey area representing 95% confidence limits. (C) Expression of KRT19 in nILC2s and iILC2s groups. The groups were defined according to the median level of nILC2s and iILC2s as cutoffs. Expression levels are represented as mean ± SD of normalized expression (log2(RPKM value)). P value was calculated by Wilcoxon rank sum test. (D) Kaplan-Meier plots of survival of biliary atresia patients with native liver after hepatoportoenterostomy (HPE). P was calculated by Log-rank test and is nonsignificant (p>0.05) unless denoted on the survival graph.
To further examine the association between nILC2s, iILC2s, and cholangiocyte proliferation (as determined by the abundance of KRT19 expression), we stratified the patients according to levels of nILC2s and iILC2s (Figure 1C). There was a gradation of expression level of KRT19, with the expression peaking in the high-nILC2s/low-iILC2s groups, and the lowest level in the low-nILC2s/high-iILC2s group (Figure 1C). Importantly, the low-nILC2/high-iILC2 cohort had the worst transplant-free survival in patients with biliary atresia after hepatoportoenterostomy (P < 0.05 compared to the low-nILC2/high-iILC2 cohort), Figure 1D). These findings were specific to nILC2s as there was no difference in survival between high-nILC2/high-iILC2 and high-nILC2/low-iILC2 cohorts (P = 0.1657). From this human data, we hypothesized that IL-33 and/or IL-2 driven expansion of nILC2s promotes epithelial proliferation and repair. To test this hypothesis, we probed IL-33 and IL-2- dependent ILC2 inter-lineage plasticity and resultant epithelial proliferation in both healthy mice and experimental biliary atresia.
IL-33 activates ILC2 subtypes and increases nILC2-expression of AREG with resultant epithelial proliferation
ILC2s undergo substantial expansion in the liver after IL-33 administration3, but the population of hepatic ILC2 subtypes is unknown. Previous reports identified Lin−ST2+KLRG1int nILC2s in the lung and fat-associated lymphoid tissues at steady state, with Lin−ST2−IL-25R+KLRG1hi iILC2s transiently emerging as ILC progenitors that are mobilized during inflammatory states and able to adopt either an nILC2 or ILC3-like phenotype.31,35 To examine the number and distribution of these ILC2 subtypes in the liver, we administered 1 μg of IL-33 intraperitoneally (i.p.) daily for four days to BALB/c mice. Natural ILC2s (nILC2s) were identified in the livers of naïve mice under homeostatic conditions, while iILC2s only emerged after administration of IL-33 (Figure 2A). Interestingly, KLRG1 expression increased in the nILC2 population after IL-33 administration (Figure 2A), representing an intermediary ILC2 population with an activated phenotype (Lin−ST2+KLRG1hi, denoted “activated-nILC2s”). Expression of additional activation markers (CD44 and CD25) were increased and CD62L expression was decreased in this population (Figure S2A).
Figure 2. IL-33 activates ILC2 subtypes and increases AREG expression predominantly by nILC2s.

(A) Gating strategy of the flow cytometry analysis of hepatic mononuclear cells (HMNCs) from the livers of Balb/c wild-type (WT) mice after 4 daily intraperitoneal (i.p.) injections of PBS (top) or 1 μg of IL-33 (bottom). Expression of ST2 (left), KLRG1 (middle), and IL-25R (right) in CD45+ lineage negative (Lin−) cells. (B) Quantification of the frequency of the total HMNCs as a percentage (left panel) and absolute number per liver (right panel) of nILC2s (Lin−CD45+ST2+KLRG1int), activated nILC2s (Lin−CD45+ST2+KLRG1hi) and iILC2s (Lin−CD45+ST2-KLRG1hiIL-25R+). (C,D) AREG expression by hepatic nILC2s, activated-nILC2s, and iILC2s by flow cytometry. Results are presented as representative histograms (C) and frequency (D). FMO = fluorescence minus one control. Data are representative of 3 independent experiments with a total of 3–6 mice per experiment. *p<0.05, **p<0.01, ***p<0.001 by Student’s t-test.
In addition to these phenotypic changes, IL-33 increased the frequency and absolute number of all hepatic ILC2 subpopulations within hepatic mononuclear cells (HMNCs) (Figure 2B), with no difference in T cell frequency after IL-33 administration (Figure S2B). IL-33 administration also had the expected increase in IL-4, IL-5, and IL-13 expression by natural and activated-nILC2s (Figure S2C,D). Notably, IL-33 increased AREG expression in nILC2s and activated-nILC2s by up to 10-fold above the increases in iILC2s (Figure 2C,D). Given the higher absolute number and frequency of AREG-expression within nILC2s and activated-nILC2s, we focus on this combined population of natural ILC2s as the most relevant source of AREG within hepatic ILC2s.
To explore the functional relationship between AREG and epithelial proliferation, wildtype mice were treated with IL-33 ± pEGFRi (Canertinib, an inhibitor of all epidermal growth factor receptor signaling, including AREG).36 The co-administration of pEGFRi reduced proliferation by 5-fold (Figure 3A,B), prevented the visual enlargement of EHBDs (Figure 3C) and ductal hyperplasia (Figure S3A) compared to control mice treated with IL-33 alone. Mice treated with pEGFRi without IL-33 demonstrated the expected decrease in ductal patency confirming this pathway has relevance under physiologic conditions (Figure S3B). Administration of recombinant AREG to directly determine the proliferative properties of IL-33 resulted in a 5-fold increase in cholangiocyte proliferation (Figure 3D). Taken together, these findings in healthy mice demonstrate that hepatic nILC2s, but not iILC2s, produce AREG which drives epithelial cell proliferation.
Figure 3. AREG from IL-33-primed ILC2s promotes epithelial proliferation.

(A) Experimental schematic; 0.1 μg IL-33 was administered i.p. with or without pEGFRi (Canertinib, an EGFR and AREG pathway inhibitor, 80 mg/kg) 12 hours earlier. Bromodeoxyuridine (5-bromo-2-deoxyuridine, BrdU) was used to identify proliferating cells in the bile ducts and was injected i.p. to mice 2 hours prior to harvesting. (B) IHC of longitudinal bile duct sections (left) with quantification (right). Percentages shown are percent BrdU+ positive of CK19+ cholangiocytes. (C) Gross pathology of common bile ducts from WT mice that received daily i.p. injection of IL-33 with or without pEGFRi for 3 days. (D) IHC of longitudinal bile duct sections (left) with quantification (right) of mice receiving 10 μg of recombinant mouse AREG or PBS. BrdU was injected 24 hours later, 2 hours prior to harvest. Each point represents data from an individual mouse. Graphs are representative of 3 (A,B) or 2 (C,D) independent experiments with a 3–6 mice per group per experiment. *p<0.05 and ***p<0.001 by Student’s t-test.
Fewer nILC2s and reduced AREG expression in experimental biliary atresia
To investigate the role of ILC2 plasticity and AREG to disease, we utilized a mouse model of biliary atresia. Cholangiopathy is induced by the i.p. administration of 1.5×10⁶ plaque-forming units (pfu) of rhesus rotavirus (RRV) into BALB/c mice within 24 hours of birth (Figure 4A). Analysis of ILC2 subpopulations and AREG expression in sham mice, infected mice, and infected mice also receiving IL-33 revealed that nILC2s (Figure 4B) and AREG-expressing cells (Figure 4C,D) were suppressed after RRV infection and that this phenotype was reversed by the administration of IL-33. Inhibiting the AREG pathway with pEGFRi in this model resulted in significantly reduced cholangiocyte proliferation in RRV-infected mice treated with IL-33 (Figure 4E). Proliferation of CK19− cells are present in RRV-infected mice, most likely representing immune cells as previously reported.8,15,37 These data demonstrate that reduced nILC2 and AREG expression in mice with experimental biliary atresia results in decreased epithelial proliferation, recapitulating the associations observed in human disease (see Figure 1A,B).
Figure 4. Fewer nILC2s and reduced AREG expression in experimental biliary atresia.

(A) Experimental schematic; WT neonatal mice were infected with 1.5×10⁶ plaque-forming units (pfu) of rhesus rotavirus (RRV) or saline i.p. within 24 hours of birth. Subsequently, they were given 0.1 μg of IL-33 or PBS i.p. 24 hours later and then daily for 6 days. (B) Total number of nILC2s, activated nILC2s, and iILC2s per liver as detected by flow cytometry. (C) Representative flow cytometry histograms of AREG expression by each ILC2 subpopulation. (D) Absolute number of AREG+ cells in each ILC2 subset. (E) Experimental design as in (A); IHC of bile ducts (right) harvested from WT neonatal mice that received PBS, RRV, RRV + IL-33, or RRV + IL-33 + pEGFRi. Quantification (left) of total DAPI+ live cell count per 20x microscopic view in CK19+ epithelial cholangiocytes in bile ducts. Each point represents data from an individual mouse. Graphs are representative of 3 (B-D) or 2 (E) independent experiments with at least 3 mice per group per experiment. *p<0.05, **p<0.01, ***p<0.001 by Student’s t-test.
ILC2 plasticity and AREG expression depend on an intact IL-13/IL-4Rα/STAT6 circuit
Based on previous reports that IL-13 mediates the proliferative properties of IL-33 in epithelial cells3,24, we hypothesized that the expression of AREG is downstream of IL-13 signaling. To test this hypothesis, we administered 1 μg IL-33 ± 10 μg AREG to Il13−/− mice. While IL-33 treatment of Il13−/− mice resulted in minimal proliferation, the administration of AREG significantly increased proliferation (Figure 5A,B). This result demonstrated that AREG is dependent on IL-13, perhaps downstream of the IL-4Rα subunit of the IL-13R and signals through STAT6.38 To examine this possibility, we administered IL-33 to Il13−/−, Il4ra−/− and Stat6−/− mice. IL-33 increased the number of ILC2s in the livers and EHBDs of knockout strains compared to WT controls (Figure S4A,B) with significant ILC2 phenotypic differences. In the knockout strains, there was a proportional decrease in nILC2s (Figure 5C), a shift toward an activated phenotype as shown by increased KLRG1 expression and IL-25R positivity (Figure S4C,D), and an increase in iILC2s (Figure 5D and Figure S4E). Ex vivo cytokine expression by natural and activated nILC2s is also altered with increased IL-13 and IL-17 compared to WT controls (Figure S4F). Taken together, these data suggest that the disruption of the IL-13/IL-4Rα/STAT6 circuit promotes a switch of nILC2s to an activated and inflammatory phenotype. Notably, expression of AREG is decreased in all ILC2 subtypes from knockout mice (Figure 5E).
Figure 5. ILC2 plasticity and AREG expression depend on an intact IL-13/IL-4Rα/STAT6 circuit.
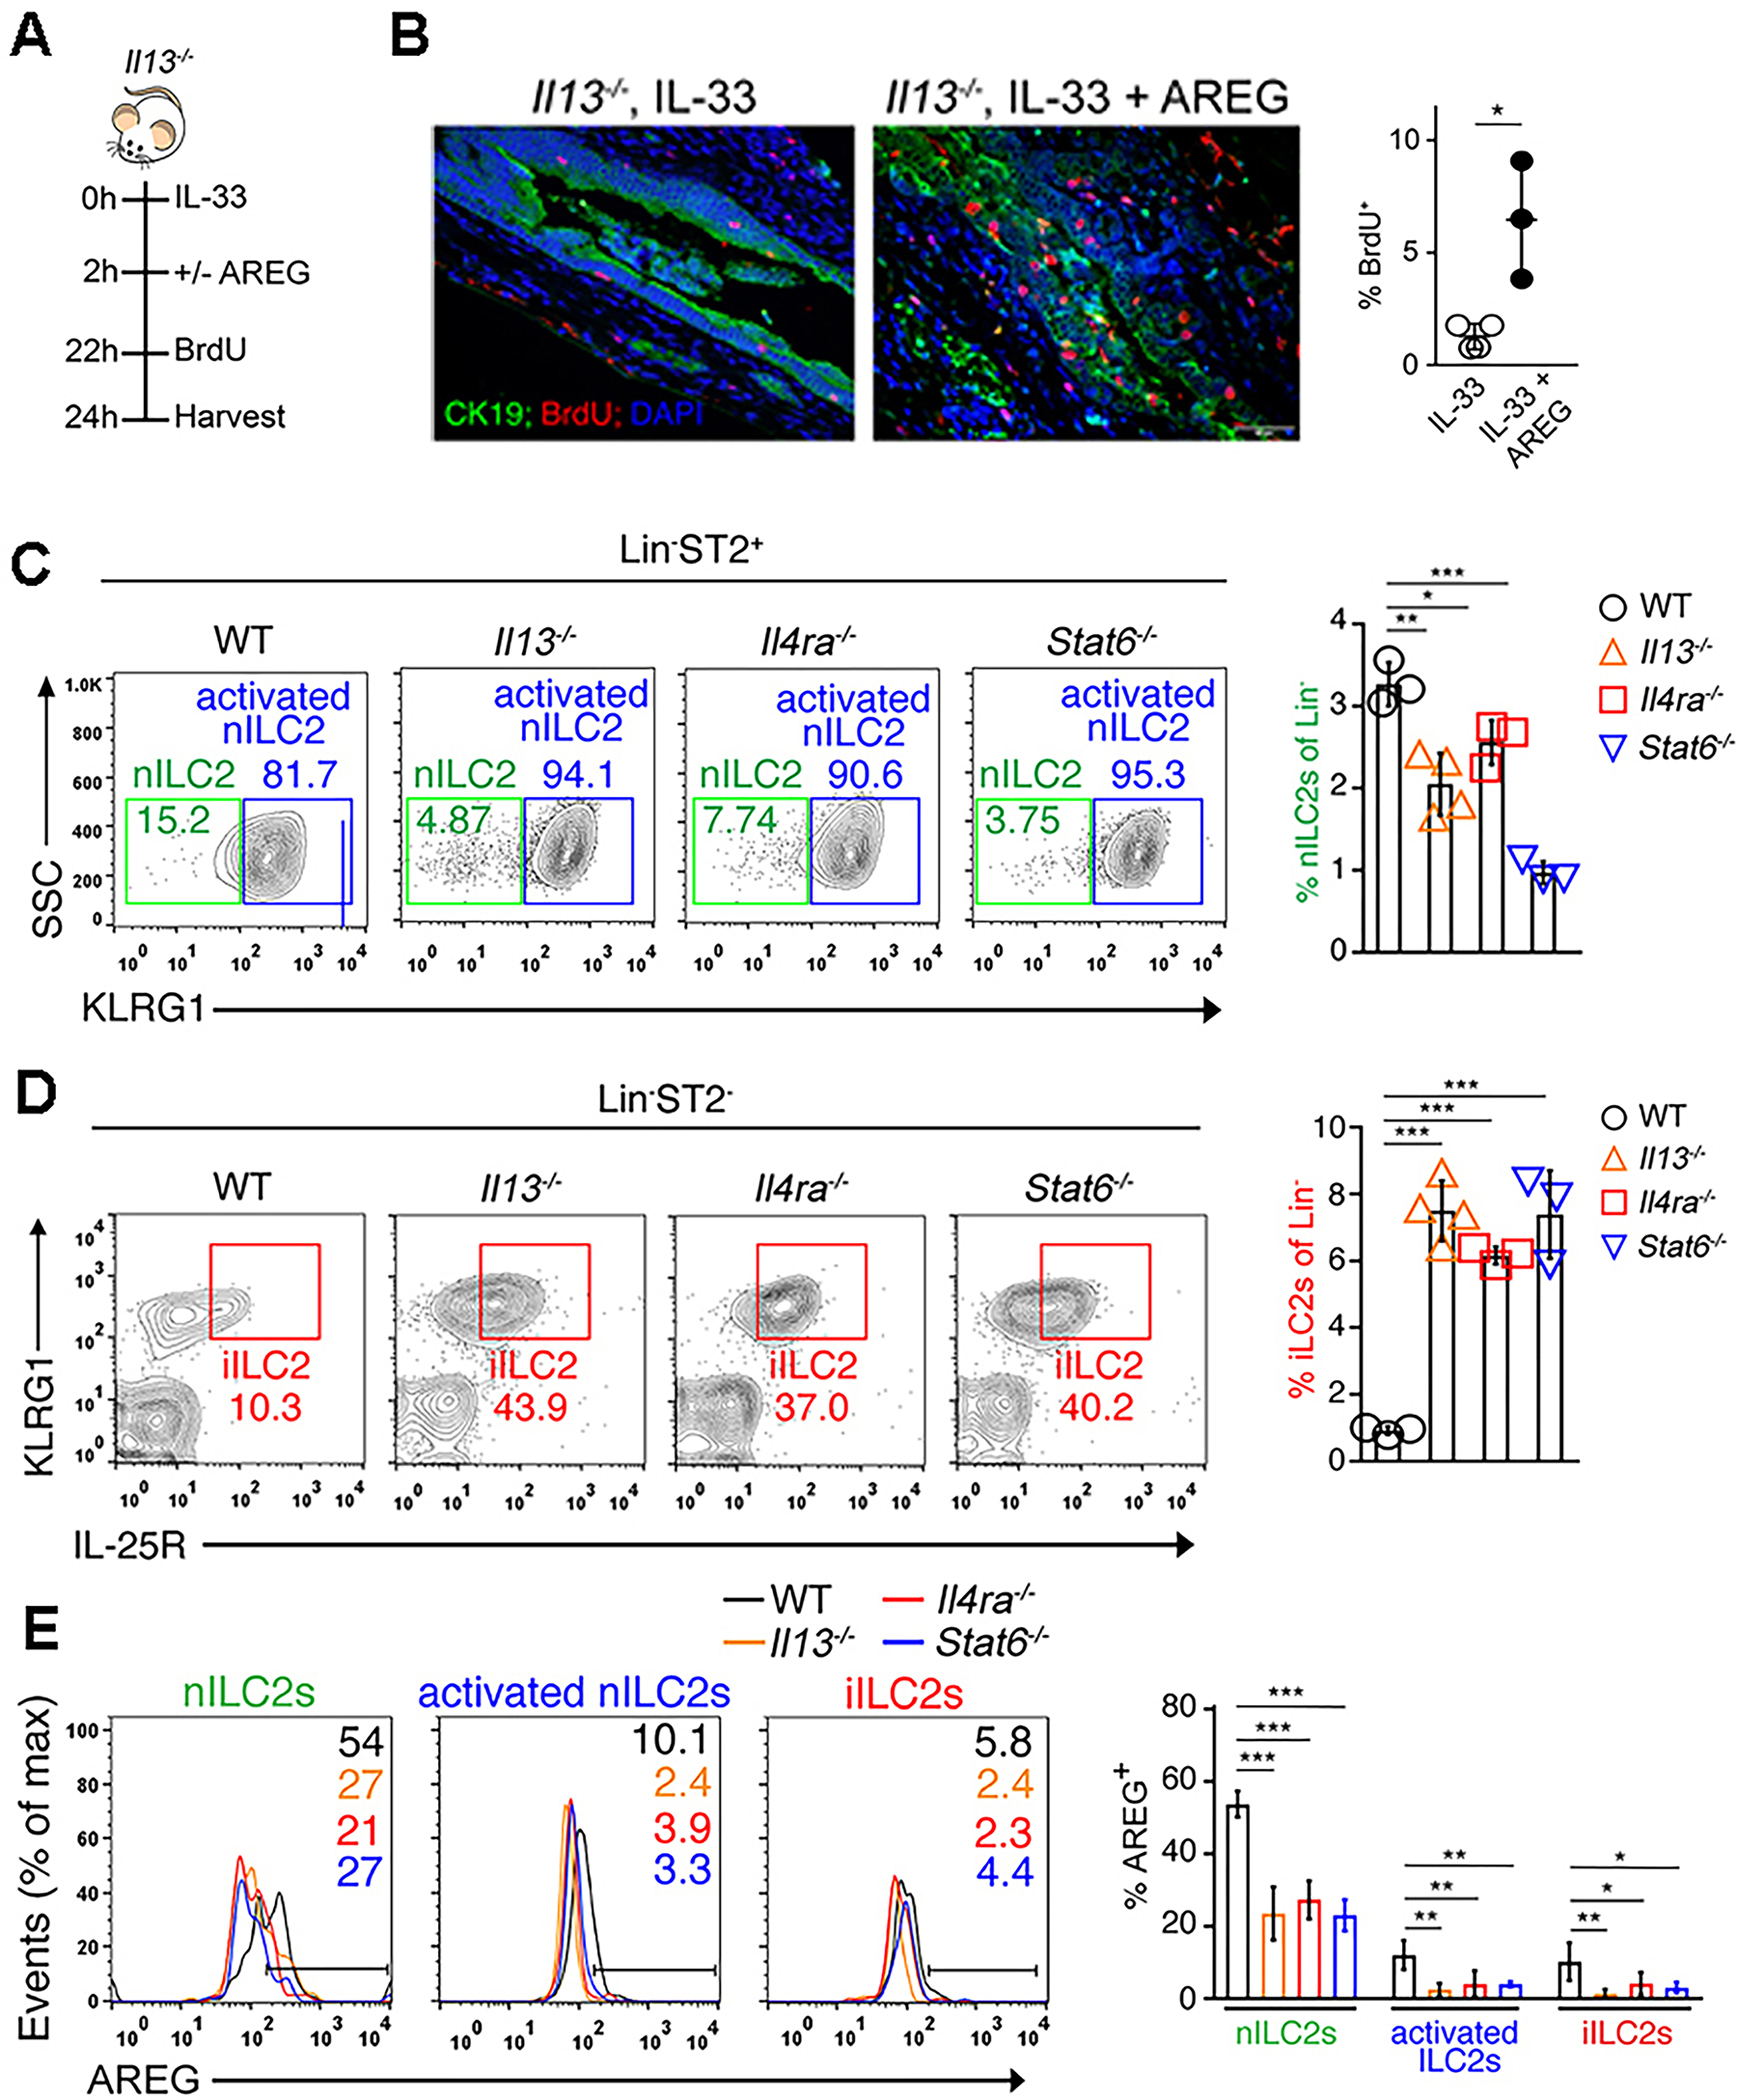
(A) Experimental schematic demonstrating IL-33 with and without AREG administration prior to BrdU injection to Il13−/− mice. (B) IHC (left) and quantification (right) of BrdU+ CK19+ cholangiocytes in the experimental design shown in (A). (C, D) Representative flow cytometry plots (left) and quantification (right) of Lin−ST2+ nILC2s (C) and iILC2s (D) in the liver of WT, Il13−/−, Il4ra−/− and Stat6−/− mice after injection with IL-33 daily for 4 days. (E) Representative flow cytometry histograms (right) and quantification (left) of AREG expression by hepatic ILC2 subtypes isolated from the livers of IL-33 treated WT and KO mice. *p<0.05, **p<0.01, ***p<0.001. Each point represents data from an individual mouse. Graphs are representative of 2 independent experiments with a mice per group per experiment.
Disruption of the IL-13/IL-4Rα/STAT6 pathway in vivo impairs epithelial cell proliferation in an AREG-dependent manner
To precisely determine if IL-13 and its IL-4Rα signaling are required for the proliferative properties of IL-33, we quantified BrdU+ cells in the EHBDs of Il13−/−, Il4ra−/−, and Stat6−/− mice after IL-33 administration. Proliferation and epithelial hyperplasia were significantly decreased in knockout mice (Figure 6A and Figure S5). To investigate the specificity of this finding to ILC2s (rather than impaired signaling in epithelial cells or T cell-dependent effects), we reconstituted Rag−/−gc−/− mice, which are deficient in ILCs, B cells, and T cells, with ILC2s from WT or Il13−/− mice by adoptive transfer (Figure 6B). The population of ILC2s in reconstituted Rag−/−gc−/− mice was documented by flow cytometry (Figure S6). Subjecting these recipient chimeric mice to IL-33, we found that cholangiocyte proliferation in EHBDs increased only in Rag−/−gc−/− mice reconstituted with ILC2s from WT mice (Figure 6C). Thus, ILC2s are necessary and sufficient to mediate IL-33-dependent cholangiocyte proliferation in the absence of T cells.
Figure 6. Disruption of the IL-13/IL-4Rα/STAT6 pathway in vivo impairs epithelial cell proliferation in an AREG-dependent manner.

(A) IHC staining (right) and quantification (left) of BrdU incorporation by CK19+ cholangiocytes in EHBDs of WT, Il13−/−, Il4ra−/− or Stat6−/− mice after 1 dose of IL-33. (B) Experimental schematic for (C); Hepatic Lin−ST2+ ILC2s were isolated from Il13−/− or IL13+/+ (WT) IL-33 treated donor mice. ILC-deficient Rag2−/−gc−/− recipient mice were reconstituted with 1×10⁵ ILC2s i.p. and treated with daily injections of IL-33 for 4 days. (C) IHC (right) and quantification (left) of proliferation by BrdU uptake in cholangiocytes of EHBDs. (D) Experimental schematic for (E,F); 6–10-week-old Il4ra−/− mice were sub-lethally irradiated (8 Gy) followed by intravenous (i.v.) injection of 0.5 – 1 × 10⁷ Il4ra+/+ (WT) or Il4ra−/− bone marrow cells (BMCs). Five weeks later, IL-33 or PBS was administered i.p. to the recipient mice daily for 4 days. (E) IHC staining (left) and quantification (right) of proliferation in bile ducts from the recipient mice. (F) Anti-AREG antibody (200 μg/mouse) was administered i.p. daily to bone marrow chimeric recipient mice 12 hours prior to each injection of IL-33 daily for 4 days. IHC (right) and quantification (left) of BrdU uptake in the bile ducts after treatment with IL-33 or IL-33 plus anti-AREG antibody (200 μg/mouse). *p<0.05, **p<0.01, ***p<0.001. Each point represents data from an individual mouse. Graphs are representative of 2 independent experiments with a 3–4 mice per group per experiment.
Next, we administered IL-33 i.p. into Il4ra−/− mice after their bone marrow had been reconstituted with cells from WT or Il4ra−/− mice (Figure 6D and Figure S7A,B). Quantifying BrdU-positive bile duct epithelial cells, we found that Il4ra−/− mice reconstituted with WT donor cells (Il4ra+/+ > Il4ra−/−) had an expected increase in cholangiocyte proliferation, which was substantially suppressed in Il4ra−/− mice receiving cells from Il4ra−/− donors (Figure 6E). Notably, the administration of anti-AREG antibodies to Il4ra−/− mice reconstituted with WT donor cells (Il4ra+/+ > Il4ra−/−) blocked the cholangiocyte proliferation induced by IL-33 (Figure 6F). These data demonstrate the independent role of ILC2s and of its own IL-13 in controlling the plasticity of the functional phenotypes. They also identify a hematopoietic source of IL-4Rα expression and AREG as a downstream effector molecule produced by nILC2s to promote proliferation of neighboring epithelial cells.
IL-2 restores the nILC2 phenotype and AREG expression in mice with defective IL-13 signaling
While nearly all ILCs are dependent on IL-7 for development39, the combination of IL-2 and IL-7 converts iILC2s into nILC2s in vitro.31 Thus, we hypothesized that IL-2 is required for nILC2 stability in addition to IL-33. This hypothesis is supported by the human Spearman correlation analysis demonstrating a positive correlation of nILC2s with IL33 + IL2 but not IL2 alone (see Figure 1A,B). To determine the in vivo effect of IL-2, we repopulated Rag−/−gc−/− mice with ILC2s from WT or Il13−/− mice and challenged mice with IL-33 ± IL-2/anti-IL-2 complex (which activates IL-2 signaling) (Figure 7A).40 Treatment with the IL-2/anti-IL-2 complex restored AREG production (Figure S8) and cholangiocyte proliferation (Figure 7B,C) in mice receiving Il13−/− nILC2s.
Figure 7. IL-2 restores the nILC2 phenotype and AREG expression in mice with defective IL-13 signaling.

(A) Experimental schematic for (B-C). Hepatic Lin−ST2+ ILC2s were isolated from Il13−/− or IL13+/+ (WT) IL-33 treated donor mice. ILC-deficient Rag2−/−gc−/− recipient mice were reconstituted with 0.5×10⁵ ILC2s and treated with daily injections of IL-33, IL-33 plus IL-2/anti-IL-2 complex, or PBS daily for 4 days. BrdU was administered 2 hours prior to harvest. (B,C) IHC (B) and quantification of proliferation (C) between the groups shown in (A). (D) WT or Il4ra−/− neonatal mice were infected with 1.5×10⁶ pfu RRV or saline i.p. within 24 hours of birth. Subsequently, they were given daily injections of IL-33 or IL-33 plus IL-2/anti-IL-2 complex 24 hours later and then x 5 days. Representative flow cytometry contour plots of KLRG1 expression by Lin−ST2+ hepatic ILC2s from WT or Il4ra−/− treated mice. (E) IHC with BrdU detection and (F) quantification of proliferation of the experimental groups described in (D). *p<0.05, **p<0.01, ***p<0.001, ****p<0.0001. Each point represents data from an individual mouse. Graphs are representative of 2 independent experiments with at least 3 mice per group per experiment.
Lastly, we infected Il4ra−/− neonatal mice with RRV, followed by daily administration of IL-33 ± IL-2/anti-IL-2 complex. RRV infection alone resulted in decreased expression of ILC2-related cytokines in mice compared to WT controls (Figure S9A). The IL-2/anti-IL-2R complex successfully restored the nILC2 cell population (Figure 7D), increased cholangiocyte proliferation (Figure 7E,F) and maintained the epithelial lining and patency of EHBD (Figure S9B). Altogether, the data underscored the key role of IL-2 in the regulation of ILC2 functional plasticity and its source of AREG as an important effector of epithelial proliferation induced by IL-33.
Discussion
ILC2s have seemingly disparate roles of promoting tissue repair or fibrosis.41 During physiologic states, they suppress excessive type 1 inflammation, maintain barrier defense, and regulate tissue regeneration. However, in states of excessive and chronic inflammation, they lead to reduced tissue immunity and lethal fibrosis. We propose that the dominant ILC2 subpopulation within a tissue (nLC2 or iILC2) is responsible for the functional ILC2 response. We demonstrate significant inter-lineage plasticity between these populations dependent on IL-2 and the IL-13/IL-4Rα/STAT6 pathway.
In biliary atresia, nearly 80% of patients with successful biliary drainage and jaundice clearance still develop hepatic fibrosis and chronic liver disease.1,42–46 Thus, even after resolution of cholestasis, additional factors remain that mediate disease progression. Our data suggest that ILC2s may be integral to this process. We propose that an nILC2-driven hepatobiliary response counteracts the initial type-1 immune response in biliary atresia. This pathway, controlled by IL-13/IL-4Ra/STAT6 and dependent on downstream AREG production, drives epithelial proliferation and tissue repair. However, in an environment of unchecked prolonged inflammation, we propose that nILC2s adopt an activated phenotype and ultimately switch to iILC2s to drive fibrosis (model in Figure 8). Future studies are needed to better define the functional role of activated nILC2s, both at homeostasis and under inflammatory conditions.
Figure 8. A proposed model for ILC2 plasticity determined by an intrinsic IL-13/IL-4Rα/STAT6 axis and dependent on AREG for epithelial cell proliferation.

(A) Under IL-33 stimulation, three distinct ILC2 subtypes emerge: Natural ILC2s (nILC2s, middle) which remain ST2+ and have intermediate expression of KLRG1; activated natural ILC2s (activated nILC2s, right) which also remain ST2+ but develop high expression of KLRG1; and inflammatory ILC2s (iILC2s, left) which lose ST2 expression and highly express KLRG1 in addition to the IL-25 receptor. Natural and activated natural ILC2s produce amphiregulin which promotes epithelial integrity and proliferation. In contrast, inflammatory ILC2s promote tissue damage and fibrosis. Upon stimulation by IL-2, iILC2s shift towards an nILC2-like phenotype, resulting in increased AREG expression and cholangiocyte proliferation. (B) Amphiregulin expression is dependent on an intrinsic IL-13→IL-4Rα→STAT6 pathway. Integrity of this pathway is necessary for AREG expression and cholangiocyte proliferation.
Our mechanistic studies delineating the plasticity of ILC2 subpopulations may explain the disparate roles of type 2 responses in biliary atresia and help answer the question; is the type 2 response in patients with biliary atresia compensatory and protective or pathogenic? Earlier reports identified several type 2 response-related genes, including IL4RA, ST2, and AREG, highly expressed in the livers of a subgroup of patients with biliary atresia.22 Intrahepatic ILC2s are found in the livers of human patients and correlate with the extent of hepatic cirrhosis.47 Interestingly, these ILC2s are strongly IL-13+ and weakly ST2+, suggesting they may actually be iILC2s that are associated with more severe hepatic fibrosis.
With a refined focus on ILC2 subpopulations, we found that patients with low nILC2/high iILC2 transcripts exhibited the lowest level of cholangiocyte proliferation and the worst survival with their native liver. Based on the role of cholangiocyte proliferation after damage to EHBDs, the correlative human liver gene expression data and the mechanistic experiments described herein identify nILC2s as key to bile duct repair. They are positioned at the center of a paracrine signaling network induced by the sequential release of IL-33 by injured cells, the expression of IL-2 by neighboring cells, and the effector properties of AREG to restore epithelial integrity, allow bile flow, and improve the outcome of children with bile duct obstruction. Understanding of the intricacies of type 2-responses is imperative for future therapeutic design as the goal is to reduce the type 2-mediated fibrosis without diminishing the type 2-mediated tissue regeneration. Our data provides a potential avenue for this by augmenting nILC2s via IL-2, the IL-13/IL-4Rα/STAT6 pathway, or direct delivery of nILC2s via the biliary system.48
Supplementary Material
Acknowledgments
We thank the Gene Analysis Core, the Integrative Morphology Core, and the Biostatistical Support of the Digestive Health Center at Cincinnati Children’s Hospital Medical Center (P30 DK 789392). We thank M. Rothenberg (Cincinnati Children’s Hospital Medical Center, Division of Allergy and Immunology), A. McKenzie (MRC Laboratory of Molecular Biology, Cambridge, UK) for Il13−/− mice, and Y.X. Wang for sharing the bone marrow transplant protocol.
Funding:
National Institutes of Health grant R01DK64008 (JAB)
National Institutes of Health grant R01DK78392 (JAB)
National Institutes of Health grant T32DK007727 (AER)
National Natural Science Foundation of China grant 82001589 (ZL)
National Natural Science Foundation of China grant 92168108 (ZL)
Abbreviations:
- ILC2
type 2 innate lymphoid cells
- nILC2
natural type 2 innate lymphoid cells
- iILC2
inflammatory type 2 innate lymphoid cells
- AREG
amphiregulin
- ssGSEA
single sample gene set enrichment analysis
- i.p.
intraperitonea
- HMNCs
hepatic mononuclear cells
- pfu
plaque-forming units
- RRV
rhesus rotavirus
- HPE
hepatoportoenterostomy
References
- 1.Bijl EJ, Bharwani KD, Houwen RH, de Man RA. The long-term outcome of the Kasai operation in patients with biliary atresia: a systematic review. Neth J Med. May 2013;71(4):170–3. [PubMed] [Google Scholar]
- 2.Fawaz R, Baumann U, Ekong U, et al. Guideline for the Evaluation of Cholestatic Jaundice in Infants: Joint Recommendations of the North American Society for Pediatric Gastroenterology, Hepatology, and Nutrition and the European Society for Pediatric Gastroenterology, Hepatology, and Nutrition. J Pediatr Gastroenterol Nutr. Jan 2017;64(1):154–168. doi: 10.1097/mpg.0000000000001334 [DOI] [PubMed] [Google Scholar]
- 3.Li J, Razumilava N, Gores GJ, et al. Biliary repair and carcinogenesis are mediated by IL-33-dependent cholangiocyte proliferation. J Clin Invest. Jul 2014;124(7):3241–51. doi: 10.1172/JCI73742 [DOI] [PMC free article] [PubMed] [Google Scholar]
- 4.Asai A, Miethke A, Bezerra JA. Pathogenesis of biliary atresia: defining biology to understand clinical phenotypes. Nat Rev Gastroenterol Hepatol. Jun 2015;12(6):342–52. doi: 10.1038/nrgastro.2015.74 [DOI] [PMC free article] [PubMed] [Google Scholar]
- 5.Mack CL, Tucker RM, Sokol RJ, et al. Biliary atresia is associated with CD4+ Th1 cell-mediated portal tract inflammation. Pediatr Res. Jul 2004;56(1):79–87. doi: 10.1203/01.pdr.0000130480.51066.fb [DOI] [PMC free article] [PubMed] [Google Scholar]
- 6.Mack CL, Falta MT, Sullivan AK, et al. Oligoclonal expansions of CD4+ and CD8+ T-cells in the target organ of patients with biliary atresia. Gastroenterology. Jul 2007;133(1):278–87. doi: 10.1053/j.gastro.2007.04.032 [DOI] [PMC free article] [PubMed] [Google Scholar]
- 7.Ohya T, Fujimoto T, Shimomura H, Miyano T. Degeneration of intrahepatic bile duct with lymphocyte infiltration into biliary epithelial cells in biliary atresia. J Pediatr Surg. Apr 1995;30(4):515–8. doi: 10.1016/0022-3468(95)90120-5 [DOI] [PubMed] [Google Scholar]
- 8.Shivakumar P, Sabla G, Mohanty S, et al. Effector role of neonatal hepatic CD8+ lymphocytes in epithelial injury and autoimmunity in experimental biliary atresia. Gastroenterology. Jul 2007;133(1):268–77. doi: 10.1053/j.gastro.2007.04.031 [DOI] [PMC free article] [PubMed] [Google Scholar]
- 9.Taylor SA, Malladi P, Pan X, et al. Oligoclonal immunoglobulin repertoire in biliary remnants of biliary atresia. Sci Rep. Mar 14 2019;9(1):4508. doi: 10.1038/s41598-019-41148-7 [DOI] [PMC free article] [PubMed] [Google Scholar]
- 10.Wang J, Xu Y, Chen Z, et al. Liver Immune Profiling Reveals Pathogenesis and Therapeutics for Biliary Atresia. Cell. Nov 26 2020;doi: 10.1016/j.cell.2020.10.048 [DOI] [PubMed] [Google Scholar]
- 11.Bezerra JA, Tiao G, Ryckman FC, et al. Genetic induction of proinflammatory immunity in children with biliary atresia. Lancet. Nov 23 2002;360(9346):1653–9. doi: 10.1016/s0140-6736(02)11603-5 [DOI] [PubMed] [Google Scholar]
- 12.He L, Ip DKM, Tam G, Lui VCH, Tam PKH, Chung PHY. Biomarkers for the diagnosis and post-Kasai portoenterostomy prognosis of biliary atresia: a systematic review and meta-analysis. Sci Rep. Jun 3 2021;11(1):11692. doi: 10.1038/s41598-021-91072-y [DOI] [PMC free article] [PubMed] [Google Scholar]
- 13.Klemann C, Schroder A, Dreier A, et al. Interleukin 17, Produced by gammadelta T Cells, Contributes to Hepatic Inflammation in a Mouse Model of Biliary Atresia and Is Increased in Livers of Patients. Gastroenterology. Jan 2016;150(1):229–241.e5. doi: 10.1053/j.gastro.2015.09.008 [DOI] [PubMed] [Google Scholar]
- 14.Luo Z, Shivakumar P, Mourya R, Gutta S, Bezerra JA. Gene Expression Signatures Associated With Survival Times of Pediatric Patients With Biliary Atresia Identify Potential Therapeutic Agents. Gastroenterology. Oct 2019;157(4):1138–1152 e14. doi: 10.1053/j.gastro.2019.06.017 [DOI] [PMC free article] [PubMed] [Google Scholar]
- 15.Mohanty SK, Donnelly B, Temple H, Bondoc A, McNeal M, Tiao G. T-Bet Deficiency Attenuates Bile Duct Injury in Experimental Biliary Atresia. Cells. December 08 2021;10(12)doi: 10.3390/cells10123461 [DOI] [PMC free article] [PubMed] [Google Scholar]
- 16.Shivakumar P, Campbell KM, Sabla GE, et al. Obstruction of extrahepatic bile ducts by lymphocytes is regulated by IFN-gamma in experimental biliary atresia. J Clin Invest. Aug 2004;114(3):322–9. doi: 10.1172/jci21153 [DOI] [PMC free article] [PubMed] [Google Scholar]
- 17.Shivakumar P, Mizuochi T, Mourya R, et al. Preferential TNFα signaling via TNFR2 regulates epithelial injury and duct obstruction in experimental biliary atresia. JCI Insight. Mar 9 2017;2(5):e88747. doi: 10.1172/jci.insight.88747 [DOI] [PMC free article] [PubMed] [Google Scholar]
- 18.Tucker RM, Feldman AG, Fenner EK, Mack CL. Regulatory T cells inhibit Th1 cell-mediated bile duct injury in murine biliary atresia. J Hepatol. Oct 2013;59(4):790–6. doi: 10.1016/j.jhep.2013.05.010 [DOI] [PMC free article] [PubMed] [Google Scholar]
- 19.Bednarek J, Traxinger B, Brigham D, et al. Cytokine-Producing B Cells Promote Immune-Mediated Bile Duct Injury in Murine Biliary Atresia. Hepatology. Nov 2018;68(5):1890–1904. doi: 10.1002/hep.30051 [DOI] [PMC free article] [PubMed] [Google Scholar]
- 20.Davenport M, Gonde C, Redkar R, et al. Immunohistochemistry of the liver and biliary tree in extrahepatic biliary atresia. J Pediatr Surg. Jul 2001;36(7):1017–25. doi: 10.1053/jpsu.2001.24730 [DOI] [PubMed] [Google Scholar]
- 21.Jian ZH, Wang LC, Lin CC, Wang JD. The correlation between plasma cytokine levels in jaundice-free children with biliary atresia. World J Pediatr. Nov 2015;11(4):352–7. doi: 10.1007/s12519-015-0023-5 [DOI] [PubMed] [Google Scholar]
- 22.Li J, Bessho K, Shivakumar P, et al. Th2 signals induce epithelial injury in mice and are compatible with the biliary atresia phenotype. J Clin Invest. Nov 2011;121(11):4244–56. doi: 10.1172/JCI57728 [DOI] [PMC free article] [PubMed] [Google Scholar]
- 23.Leonhardt J, Stanulla M, von Wasielewski R, et al. Gene expression profile of the infective murine model for biliary atresia. Pediatr Surg Int. Jan 2006;22(1):84–9. doi: 10.1007/s00383-005-1589-0 [DOI] [PubMed] [Google Scholar]
- 24.Yamada D, Rizvi S, Razumilava N, et al. IL-33 facilitates oncogene-induced cholangiocarcinoma in mice by an interleukin-6-sensitive mechanism. Hepatology. May 2015;61(5):1627–42. doi: 10.1002/hep.27687 [DOI] [PMC free article] [PubMed] [Google Scholar]
- 25.McHedlidze T, Waldner M, Zopf S, et al. Interleukin-33-dependent innate lymphoid cells mediate hepatic fibrosis. Immunity. Aug 22 2013;39(2):357–71. doi: 10.1016/j.immuni.2013.07.018 [DOI] [PMC free article] [PubMed] [Google Scholar]
- 26.Gieseck RL 3rd, Ramalingam TR, Hart KM, et al. Interleukin-13 Activates Distinct Cellular Pathways Leading to Ductular Reaction, Steatosis, and Fibrosis. Immunity. Jul 19 2016;45(1):145–58. doi: 10.1016/j.immuni.2016.06.009 [DOI] [PMC free article] [PubMed] [Google Scholar]
- 27.Monticelli LA, Sonnenberg GF, Abt MC, et al. Innate lymphoid cells promote lung-tissue homeostasis after infection with influenza virus. Nat Immunol. Nov 2011;12(11):1045–54. doi: 10.1031/ni.2131 [DOI] [PMC free article] [PubMed] [Google Scholar]
- 28.Salimi M, Barlow JL, Saunders SP, et al. A role for IL-25 and IL-33-driven type-2 innate lymphoid cells in atopic dermatitis. J Exp Med. Dec 16 2013;210(13):2939–50. doi: 10.1084/jem.20130351 [DOI] [PMC free article] [PubMed] [Google Scholar]
- 29.Monticelli LA, Osborne LC, Noti M, Tran SV, Zaiss DM, Artis D. IL-33 promotes an innate immune pathway of intestinal tissue protection dependent on amphiregulin-EGFR interactions. Proc Natl Acad Sci U S A. Aug 25 2015;112(34):10762–7. doi: 10.1073/pnas.1509070112 [DOI] [PMC free article] [PubMed] [Google Scholar]
- 30.Zaiss DM, Gause WC, Osborne LC, Artis D. Emerging functions of amphiregulin in orchestrating immunity, inflammation, and tissue repair. Immunity. Feb 17 2015;42(2):216–26. doi: 10.1016/j.immuni.2015.01.020 [DOI] [PMC free article] [PubMed] [Google Scholar]
- 31.Huang Y, Guo L, Qiu J, et al. IL-25-responsive, lineage-negative KLRG1(hi) cells are multipotential ‘inflammatory’ type 2 innate lymphoid cells. Nat Immunol. Feb 2015;16(2):161–9. doi: 10.1038/ni.3078 [DOI] [PMC free article] [PubMed] [Google Scholar]
- 32.Zhang K, Xu X, Pasha MA, et al. Cutting Edge: Notch Signaling Promotes the Plasticity of Group-2 Innate Lymphoid Cells. J Immunol. Mar 01 2017;198(5):1798–1803. doi: 10.4049/jimmunol.1601421 [DOI] [PMC free article] [PubMed] [Google Scholar]
- 33.Hanzelmann S, Castelo R, Guinney J. GSVA: gene set variation analysis for microarray and RNA-seq data. BMC Bioinformatics. Jan 16 2013;14:7. doi: 10.1186/1471-2105-14-7 [DOI] [PMC free article] [PubMed] [Google Scholar]
- 34.Huang Y, Paul WE. Inflammatory group 2 innate lymphoid cells. Int Immunol. Jan 2016;28(1):23–8. doi: 10.1093/intimm/dxv044 [DOI] [PMC free article] [PubMed] [Google Scholar]
- 35.Lee MW, Odegaard JI, Mukundan L, et al. Activated type 2 innate lymphoid cells regulate beige fat biogenesis. Cell. Jan 15 2015;160(1–2):74–87. doi: 10.1016/j.cell.2014.12.011 [DOI] [PMC free article] [PubMed] [Google Scholar]
- 36.Paranjpe S, Bowen WC, Mars WM, et al. Combined systemic elimination of MET and EGFR signaling completely abolishes liver regeneration and leads to liver decompensation. Hepatology. Oct 2016;64:355a–356a. [DOI] [PMC free article] [PubMed] [Google Scholar]
- 37.Shivakumar P, Sabla GE, Whitington P, Chougnet CA, Bezerra JA. Neonatal NK cells target the mouse duct epithelium via Nkg2d and drive tissue-specific injury in experimental biliary atresia. J Clin Invest. Aug 2009;119(8):2281–90. doi: 10.1172/jci38879 [DOI] [PMC free article] [PubMed] [Google Scholar]
- 38.McCormick SM, Heller NM. Commentary: IL-4 and IL-13 receptors and signaling. Cytokine. Sep 2015;75(1):38–50. doi: 10.1016/j.cyto.2015.05.023 [DOI] [PMC free article] [PubMed] [Google Scholar]
- 39.Koga S, Hozumi K, Hirano KI, et al. Peripheral PDGFRα(+)gp38(+) mesenchymal cells support the differentiation of fetal liver-derived ILC2. J Exp Med. Jun 4 2018;215(6):1609–1626. doi: 10.1084/jem.20172310 [DOI] [PMC free article] [PubMed] [Google Scholar]
- 40.Létourneau S, van Leeuwen EM, Krieg C, et al. IL-2/anti-IL-2 antibody complexes show strong biological activity by avoiding interaction with IL-2 receptor alpha subunit CD25. Proc Natl Acad Sci U S A. Feb 2 2010;107(5):2171–6. doi: 10.1073/pnas.0909384107 [DOI] [PMC free article] [PubMed] [Google Scholar]
- 41.Gieseck RL, Wilson MS, Wynn TA. Type 2 immunity in tissue repair and fibrosis. Nat Rev Immunol. January 2018;18(1):62–76. doi: 10.1038/nri.2017.90 [DOI] [PubMed] [Google Scholar]
- 42.Bezerra JA, Wells RG, Mack CL, et al. Biliary Atresia: Clinical and Research Challenges for the Twenty-First Century. Hepatology. Sep 2018;68(3):1163–1173. doi: 10.1002/hep.29905 [DOI] [PMC free article] [PubMed] [Google Scholar]
- 43.Chardot C, Buet C, Serinet MO, et al. Improving outcomes of biliary atresia: French national series 1986–2009. J Hepatol. Jun 2013;58(6):1209–17. doi: 10.1016/j.jhep.2013.01.040 [DOI] [PubMed] [Google Scholar]
- 44.Gad EH, Kamel Y, Salem TA, Ali MA, Sallam AN. Short- and long-term outcomes after Kasai operation for type III biliary atresia: Twenty years of experience in a single tertiary Egyptian center-A retrospective cohort study. Ann Med Surg (Lond). Feb 2021;62:302–314. doi: 10.1016/j.amsu.2021.01.052 [DOI] [PMC free article] [PubMed] [Google Scholar]
- 45.Serinet MO, Wildhaber BE, Broué P, et al. Impact of age at Kasai operation on its results in late childhood and adolescence: a rational basis for biliary atresia screening. Pediatrics. May 2009;123(5):1280–6. doi: 10.1542/peds.2008-1949 [DOI] [PubMed] [Google Scholar]
- 46.Wildhaber BE, Majno P, Mayr J, et al. Biliary atresia: Swiss national study, 1994–2004. J Pediatr Gastroenterol Nutr. Mar 2008;46(3):299–307. doi: 10.1097/MPG.0b013e3181633562 [DOI] [PubMed] [Google Scholar]
- 47.Jeffery HC, McDowell P, Lutz P, et al. Human intrahepatic ILC2 are IL-13positive amphiregulinpositive and their frequency correlates with model of end stage liver disease score. PLoS One. 2017;12(12):e0188649. doi: 10.1371/journal.pone.0188649 [DOI] [PMC free article] [PubMed] [Google Scholar]
- 48.Sampaziotis F, Muraro D, Tysoe OC, et al. Cholangiocyte organoids can repair bile ducts after transplantation in the human liver. Science. February 19 2021;371(6531):839–846. doi: 10.1126/science.aaz6964 [DOI] [PMC free article] [PubMed] [Google Scholar]
- 49.Bindea G, Mlecnik B, Tosolini M, et al. Spatiotemporal dynamics of intratumoral immune cells reveal the immune landscape in human cancer. Immunity. Oct 17 2013;39(4):782–95. doi: 10.1016/j.immuni.2013.10.003 [DOI] [PubMed] [Google Scholar]
Associated Data
This section collects any data citations, data availability statements, or supplementary materials included in this article.