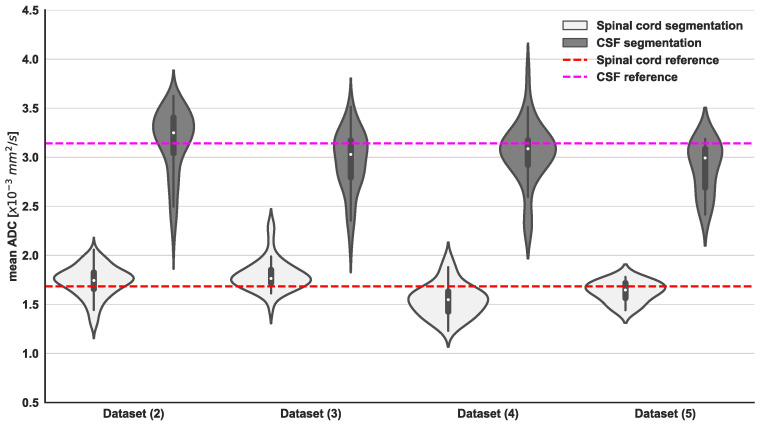
Figure 5.
Violin plots of derived spinal cord and CSF ADC mean from U-Net model segmentations and GMM fitting of ADC values within the delineated regions for all external validation datasets. Additionally, reference values for spinal cord (indicated by the red dashed line) and CSF (indicated by the purple dashed line) ADC mean were obtained from manual contours of the spinal canal on WBDWI studies included in Dataset (1). Statistical differences were observed between the 2 components of the GMM from the same dataset (Wilcoxon signed-rank test showed a p-value < 0.05). The same trend was observed for all the external validation datasets.

