

Abstract
Background
Acute pancreatitis is a common and potentially lethal disease with increasing incidence. Severe cases are characterised by high mortality, and despite improvements in intensive care management, no specific treatment relevantly improves clinical outcomes of the disease. Meta‐analyses suggest that enteral nutrition is more effective than conventional treatment consisting of discontinuation of oral intake with use of total parenteral nutrition. However, no systematic review has compared different enteral nutrition formulations for the treatment of patients with acute pancreatitis.
Objectives
To assess the beneficial and harmful effects of different enteral nutrition formulations in patients with acute pancreatitis.
Search methods
We searched the Cochrane Upper Gastrointestinal and Pancreatic Diseases Group Specialised Register of Clinical Trials, the Cochrane Central Register of Controlled Trials (CENTRAL) (2013, Issue 7), MEDLINE (from inception to 20 August 2013), EMBASE (from inception to 2013, week 33) and Science Citation Index–Expanded (from 1990 to August 2013); we conducted full‐text searches and applied no restrictions by language or publication status.
Selection criteria
We considered randomised clinical trials assessing enteral nutrition in patients with acute pancreatitis. We allowed concomitant interventions if they were received equally by all treatment groups within a trial.
Data collection and analysis
Two review authors independently assessed trials for inclusion and extracted data. We performed the analysis using Review Manager 5 (Review Manager 2013) and both fixed‐effect and random‐effects models. We expressed results as risk ratios (RRs) for dichotomous data, and as mean differences (MDs) for continuous data, both with 95% confidence intervals (CIs). Analysis was based on an intention‐to‐treat principle.
Main results
We included 15 trials (1376 participants) in this review. We downgraded the quality of evidence for many of our outcomes on the basis of high risk of bias. Low‐quality evidence suggests that immunonutrition decreases all‐cause mortality (RR 0.49, 95% CI 0.29 to 0.80). The effect of immunonutrition on other outcomes from a subset of the included trials was uncertain. Subgrouping trials by type of enteral nutrition did not explain any variation in effect. We found mainly very low‐quality evidence for the effects of probiotics on the main outcomes. One eligible trial in this comparison reported a higher rate of serious adverse events leading to increased organ failure and mortality due to low numbers of events and low risk of bias. When we excluded this study as a post hoc sensitivity analysis, risks of mortality (RR 0.30, 95% CI 0.10 to 0.84), organ failure (RR 0.74, 95% CI 0.59 to 0.92) and local septic complications (RR 0.40, 95% CI 0.22 to 0.72) were lower with probiotics. In one trial assessing immunonutrition with probiotics and fibres, no deaths occurred, but hospital stay was shorter with immunonutrition (MD ‐5.20 days, 95% CI ‐8.73 to ‐1.67). No deaths were reported following semi‐elemental enteral nutrition (EN), and the effect on length of hospital stay was small (MD 0.30 days, 95% CI ‐0.82 to 1.42). Fibre‐enriched formulations reduced the number of other local complications (RR 0.52, 95% CI 0.32 to 0.87) and length of hospital stay (MD ‐9.28 days, 95% CI ‐13.21 to ‐5.35) but did not significantly affect all‐cause mortality (RR 0.23, 95% CI 0.03 to 1.84) and other outcomes. Very low‐quality evidence from the subgroup of trials comparing EN versus no intervention showed a decrease in all‐cause mortality with EN (RR 0.50, 95% CI 0.29 to 0.86).
Authors' conclusions
We found evidence of low or very low quality for the effects of immunonutrition on efficacy and safety outcomes. The role of supplementation of enteral nutrition with potential immunomodulatory agents remains in question, and further research is required in this area. Studies assessing probiotics yielded inconsistent and almost contrary results, especially regarding safety and adverse events, and their findings do not support the routine use of EN enriched with probiotics in routine clinical practice. However, further research should be carried out to try to determine the potential efficacy or harms of probiotics. Lack of trials reporting on other types of EN assessed and lack of firm evidence regarding their effects suggest that additional randomised clinical trials are needed. The quality of evidence for the effects of any kind of EN on mortality was low, and further studies are likely to have an impact on the finding of improved survival with EN versus no nutritional support. Evidence remains insufficient to support the use of a specific EN formulation.
Keywords: Female, Humans, Male, Acute Disease, Dietary Fiber, Dietary Fiber/therapeutic use, Dietary Supplements, Enteral Nutrition, Enteral Nutrition/methods, Enteral Nutrition/mortality, Immunotherapy, Immunotherapy/methods, Immunotherapy/mortality, Pancreatitis, Pancreatitis/mortality, Pancreatitis/therapy, Probiotics, Probiotics/therapeutic use, Randomized Controlled Trials as Topic
Plain language summary
Tube feeding in patients with acute pancreatitis
Review question
The intention of this systematic review was to show whether specific enteral nutrition (EN) formulations have any beneficial or harmful effects in the treatment of patients with acute pancreatitis (AP), and whether possible advantages and disadvantages are associated with certain types of EN in comparison with others. Enteral nutrition consists of artificial complete nutrition in liquid form that is absorbed through the intestines.
Review authors conducted searches of available literature until August 2013 to look for studies comparing different types of EN formulations in the treatment of patients with AP. We included only randomised clinical trials in this review, as these studies, if designed and conducted properly, represent the highest methodological standard in clinical research.
Background
Acute pancreatitis is an inflammatory disease of the pancreas ‐ a gland situated in the upper abdominal region that is involved in the process of digestion. The main causes of AP are gallstone disease and excessive alcohol intake. Various factors may activate pancreatic digestive enzymes inside the gland itself, causing tissue damage and extensive inflammation, possibly leading to further damage and resulting in failure of the blood circulatory system, kidneys and/or lungs, and eventually death.
Despite improvements, mortality associated with severe AP is not decreasing, and no specific treatment is available. EN has proved to be more effective than total parenteral nutrition (stopping oral intake with intravenous administration of nutrients) in reducing organ failure, infectious complications and mortality. EN is usually intended to avoid the stomach and is, therefore, given by a feeding tube inserted through the nose, throat and stomach into the middle part of the small intestine. Many types of EN formulations are available; however, no systematic review of evidence has assessed potential benefits or harms of certain formulations over others.
Study characteristics
We included 15 trials with 1376 participants. Two trials included more than two study groups comparing different EN formulations. Six trials compared immunonutrition (EN supplemented with substances potentially able to change the immune response) versus control (other EN, sham treatment (placebo) or no treatment), and six trials investigated EN enriched with probiotics (live bacteria or yeasts that replace or add to helpful bacteria in the gastrointestinal tract). Two trials researched the use of semi‐elemental formulations, which are types of EN in which nutrients are broken down to smaller particles. Two trials studied fibre‐enriched EN, which may stimulate the growth of intestinal micro‐organisms. Only one trial compared immunonutrition enriched with probiotics and fibres versus control.
Key results
Immunonutrition compared with control showed reduction in all‐cause mortality. However, when only specific types of EN were compared, this could not be confirmed. Available evidence does not support the effectiveness of probiotics in AP. One trial that made this comparison reported a higher rate of serious adverse events, and consequently more occurrences of organ failure and higher mortality rate. When this trial was excluded, results showed a decrease in mortality, organ dysfunction and pancreatic infectious complications, but with evidence of low to very low quality. Fibre‐enriched formulations had a beneficial effect on decreasing local non‐infectious complications and shortening hospitalisation. No effects were confirmed for semi‐elemental formulations and immunonutrition enriched with probiotics and fibres. These results are inconclusive because of the paucity of data. Comparison of any kind of EN versus no intervention revealed a beneficial effect on all‐cause mortality. Overall, EN was associated with a rather small number of mild adverse events (most often nausea, vomiting, bloating, diarrhoea, pain relapse and higher serological concentrations of sodium) not requiring cessation of tube feeding. We cannot be certain that EN is safe in this population because the quality of evidence for adverse event outcomes is low.
Quality of the evidence
All included trials have been assessed as having high risk of bias, most often because they did not provide enough information for adequate assessment of certain study design characteristics, but also because some clear flaws were noted in the way they were designed and carried out. The quality of the evidence throughout this review is considered to be low to very low primarily because of the relatively small numbers of study participants and events included. Study results may reflect systematic and random errors.
Summary of findings
Summary of findings for the main comparison. Immunonutrition compared with control for acute pancreatitis.
| Immunonutrition compared with control for acute pancreatitis | ||||||
| Patient or population: patients with acute pancreatitis Settings: inpatients Intervention: immunonutrition Comparison: other type of enteral nutrition, placebo or no intervention | ||||||
| Outcomes | Illustrative comparative risks* (95% CI) | Relative effect (95% CI) | Number of participants (studies) | Quality of the evidence (GRADE) | Comments | |
| Assumed risk | Corresponding risk | |||||
| Other type of enteral nutrition, placebo or no intervention | Immunonutrition | |||||
| All‐cause mortality | 16 per 100 | 8 per 100 (4 to 12) | RR 0.49 (0.29 to 0.8) | 520 (6 studies) | ⊕⊕⊝⊝ Lowa,b,c | |
| Systemic inflammatory response syndrome | 40 per 100 | 40 per 100 (31 to 53) | RR 1.00 (0.76 to 1.31) | 278 (3 studies) | ⊕⊕⊝⊝ Lowa,b,c | |
| Organ failure | 25 per 100 | 19 per 100 (12 to 29) | RR 0.75 (0.49 to 1.13) | 290 (4 studies) | ⊕⊕⊝⊝ Lowa,b,c | |
| Adverse events | 10 per 100 | 13 per 100 (8 to 23) | RR 1.32 (0.78 to 2.24) | 294 (4 studies) | ⊕⊝⊝⊝ Very lowa,b,c,d | |
| *The basis for the assumed risk (e.g. median control group risk across studies) is provided in footnotes. The corresponding risk (and its 95% confidence interval) is based on the assumed risk in the comparison group and the relative effect of the intervention (and its 95% CI). CI: Confidence interval; RR: Risk ratio. | ||||||
| GRADE Working Group grades of evidence. High quality: Further research is very unlikely to change our confidence in the estimate of effect. Moderate quality: Further research is likely to have an important impact on our confidence in the estimate of effect and may change the estimate. Low quality: Further research is very likely to have an important impact on our confidence in the estimate of effect and is likely to change the estimate. Very low quality: We are very uncertain about the estimate. | ||||||
aAll trials were at high risk of bias. bTrials included in the meta‐analysis include few participants and few events. cQuality of evidence was downgraded by one level because of possible publication bias. dQuality of evidence was downgraded by one level because of inconsistency of results (statistical heterogeneity I² = 50%).
Summary of findings 2. Probiotics compared with control for acute pancreatitis.
| Probiotics compared with control for acute pancreatitis | ||||||
| Patient or population: patients with acute pancreatitis Settings: inpatients Intervention: enteral nutrition supplemented with probiotics Comparison: other type of enteral nutrition, placebo or no intervention | ||||||
| Outcomes | Illustrative comparative risks* (95% CI) | Relative effect (95% CI) | Number of participants (studies) | Quality of the evidence (GRADE) | Comments | |
| Assumed risk | Corresponding risk | |||||
| Other type of enteral nutrition, placebo or no intervention | Enteral nutrition supplemented with probiotics | |||||
| All‐cause mortality | 8 per 100 | 8 per 100 (5 to 14) | RR 1.13 (0.66 to 1.91) | 666 (6 studies) | ⊕⊝⊝⊝ Very lowa,b,c,d,e | |
| Systemic inflammatory response syndrome | 56 per 100 | 60 per 100 (50 to 71) | RR 1.07 (0.9 to 1.27) | 223 (3 studies) | ⊕⊝⊝⊝ Very lowa,d,e,f | |
| Organ failure | 31 per 100 | 26 per 100 (21 to 32) | RR 0.84 (0.67 to 1.04) | 644 (5 studies) | ⊕⊝⊝⊝ Very lowa,c,d,e,g | |
| Adverse events | 6 per 100 | 7 per 100 (2 to 26) | RR 1.18 (0.33 to 4.2) | 133 (2 studies) | ⊕⊕⊝⊝ Lowa,d,e | |
| Serious adverse events | RR 17.89 (1.05 to 304.59) | 298 (1 study) | ⊕⊝⊝⊝ Very lowa,d | 9 vs 0 participants in intervention and control groups, respectively, developed bowel ischaemia. Seven died as a result | ||
| *The basis for the assumed risk (e.g. median control group risk across studies) is provided in footnotes. The corresponding risk (and its 95% confidence interval) is based on the assumed risk in the comparison group and the relative effect of the intervention (and its 95% CI). CI: Confidence interval; RR: Risk ratio. | ||||||
| GRADE Working Group grades of evidence. High quality: Further research is very unlikely to change our confidence in the estimate of effect. Moderate quality: Further research is likely to have an important impact on our confidence in the estimate of effect and may change the estimate. Low quality: Further research is very likely to have an important impact on our confidence in the estimate of effect and is likely to change the estimate. Very low quality: We are very uncertain about the estimate. | ||||||
aAll trials were at high risk of bias. bQuality of evidence was downgraded by one level because of inconsistency of results (statistical heterogeneity I² = 57%). cQuality of evidence was downgraded by one level because of inconsistency of results as trials have very different intervention effect estimates. dTrials included in the analysis include few participants and few events. eQuality of evidence was downgraded by one level because of possible publication bias. fQuality of evidence was downgraded by one level because of inconsistency of results (statistical heterogeneity I² = 32%). gQuality of evidence was downgraded by one level because of inconsistency of results (statistical heterogeneity I² = 66%).
Summary of findings 3. Immunonutrition with probiotics and fibres compared with control for acute pancreatitis.
| Immunonutrition with probiotics and fibres compared with control for acute pancreatitis | ||||||
| Patient or population: patients with acute pancreatitis Settings: inpatients Intervention: enteral nutrition supplemented with immunonutrients, probiotics and fibres Comparison: other type of enteral nutrition, placebo or no intervention | ||||||
| Outcomes | Illustrative comparative risks* (95% CI) | Relative effect (95% CI) | Number of participants (studies) | Quality of the evidence (GRADE) | Comments | |
| Assumed risk | Corresponding risk | |||||
| Other type of enteral nutrition, placebo or no intervention | Enteral nutrition supplemented with immunonutrients, probiotics and fibres | |||||
| All‐cause mortality | See comment | See comment | Not estimable | 64 (1 study) | ⊕⊝⊝⊝ Very lowa,b,c | No deaths occurred in both groups |
| Systemic inflammatory response syndrome ‐ not reported | See comment | See comment | Not estimable | ‐ | See comment | Trial did not report on this outcome |
| Organ failure ‐ not reported | See comment | See comment | Not estimable | ‐ | See comment | Trial did not report on this outcome |
| Adverse events ‐ not reported | See comment | See comment | Not estimable | ‐ | See comment | Trial did not report on this outcome |
| *The basis for the assumed risk (e.g. median control group risk across studies) is provided in footnotes. The corresponding risk (and its 95% confidence interval) is based on the assumed risk in the comparison group and the relative effect of the intervention (and its 95% CI). CI: Confidence interval; RR: Risk ratio. | ||||||
| GRADE Working Group grades of evidence. High quality: Further research is very unlikely to change our confidence in the estimate of effect. Moderate quality: Further research is likely to have an important impact on our confidence in the estimate of effect and may change the estimate. Low quality: Further research is very likely to have an important impact on our confidence in the estimate of effect and is likely to change the estimate. Very low quality: We are very uncertain about the estimate. | ||||||
aHigh risk of bias trial. bOnly one trial was included with few randomly assigned participants. cQuality of evidence was downgraded by one level because of possible publication bias.
Summary of findings 4. Semi‐elemental enteral nutrition compared with control for acute pancreatitis.
| Semi‐elemental enteral nutrition compared with control for acute pancreatitis | ||||||
| Patient or population: patients with acute pancreatitis Settings: inhospital Intervention: semi‐elemental enteral nutrition Comparison: other type of enteral nutrition, placebo or no intervention | ||||||
| Outcomes | Illustrative comparative risks* (95% CI) | Relative effect (95% CI) | Number of participants (studies) | Quality of the evidence (GRADE) | Comments | |
| Assumed risk | Corresponding risk | |||||
| Other type of enteral nutrition, placebo or no intervention | Semi‐elemental enteral nutrition | |||||
| All‐cause mortality | See comment | See comment | Not estimable | 35 (1 study) | ⊕⊝⊝⊝ Very lowa,b,c | No deaths occurred in the only included trial |
| Systemic inflammatory response syndrome ‐ not reported | See comment | See comment | Not estimable | ‐ | See comment | None of the trials reported on systemic inflammatory response syndrome |
| Organ failure ‐ not reported | See comment | See comment | Not estimable | ‐ | See comment | None of the trials reported on organ failure |
| Adverse events ‐ not reported | See comment | See comment | Not estimable | ‐ | See comment | None of the trials reported on adverse events |
| *The basis for the assumed risk (e.g. median control group risk across studies) is provided in footnotes. The corresponding risk (and its 95% confidence interval) is based on the assumed risk in the comparison group and the relative effect of the intervention (and its 95% CI). CI: Confidence interval; RR: Risk ratio. | ||||||
| GRADE Working Group grades of evidence. High quality: Further research is very unlikely to change our confidence in the estimate of effect. Moderate quality: Further research is likely to have an important impact on our confidence in the estimate of effect and may change the estimate. Low quality: Further research is very likely to have an important impact on our confidence in the estimate of effect and is likely to change the estimate. Very low quality: We are very uncertain about the estimate. | ||||||
aAll trials were at high risk of bias. bTrials included in the meta‐analysis include few participants and few events. cQuality of evidence was downgraded by one level because of possible publication bias.
Summary of findings 5. Fibre‐enriched enteral nutrition compared with control for acute pancreatitis.
| Fibre‐enriched enteral nutrition compared with control for acute pancreatitis | ||||||
| Patient or population: patients with acute pancreatitis Settings: inhospital Intervention: fibre‐enriched enteral nutrition Comparison: other type of enteral nutrition, placebo or no intervention | ||||||
| Outcomes | Illustrative comparative risks* (95% CI) | Relative effect (95% CI) | Number of participants (studies) | Quality of the evidence (GRADE) | Comments | |
| Assumed risk | Corresponding risk | |||||
| Other type of enteral nutrition, placebo or no intervention | Fibre‐enriched enteral nutrition | |||||
| All‐cause mortality | 9 per 100 | 2 per 100 (0 to 16) | RR 0.23 (0.03 to 1.84) | 103 (2 studies) | ⊕⊝⊝⊝ Very lowa | |
| Systemic inflammatory response syndrome | 97 per 100 | 100 per 100 (91 to 100) | RR 1.03 (0.94 to 1.13) | 60 (1 study) | ⊕⊝⊝⊝ Very lowa,b,c | |
| Organ failure | 100 per 100 | 86 per 100 (73 to 100) | RR 0.86 (0.73 to 1.01) | 60 (1 study) | ⊕⊝⊝⊝ Very lowa,b,c | |
| Adverse events ‐ not reported | See comment | See comment | Not estimable | ‐ | See comment | None of the trials reported on adverse events |
| *The basis for the assumed risk (e.g. median control group risk across studies) is provided in footnotes. The corresponding risk (and its 95% confidence interval) is based on the assumed risk in the comparison group and the relative effect of the intervention (and its 95% CI). CI: Confidence interval; RR: Risk ratio. | ||||||
| GRADE Working Group grades of evidence. High quality: Further research is very unlikely to change our confidence in the estimate of effect. Moderate quality: Further research is likely to have an important impact on our confidence in the estimate of effect and may change the estimate. Low quality: Further research is very likely to have an important impact on our confidence in the estimate of effect and is likely to change the estimate. Very low quality: We are very uncertain about the estimate. | ||||||
aAll trials were at high risk of bias. bTrials included in the meta‐analysis include few participants and few events. cQuality of evidence was downgraded by one level because of possible publication bias.
Summary of findings 6. Enteral nutrition compared with no intervention for acute pancreatitis.
| Enteral nutrition compared with no intervention for acute pancreatitis | ||||||
| Patient or population: patients with acute pancreatitis Settings: inpatients Intervention: any enteral nutrition formulation Comparison: no intervention | ||||||
| Outcomes | Illustrative comparative risks* (95% CI) | Relative effect (95% CI) | Number of participants (studies) | Quality of the evidence (GRADE) | Comments | |
| Assumed risk | Corresponding risk | |||||
| No intervention | Any enteral nutrition formulation | |||||
| All‐cause mortality | 14 per 100 | 7 per 100 (4 to 12) | RR 0.50 (0.29 to 0.86) | 511 (4 studies) | ⊕⊕⊝⊝ Lowa,b,c | |
| Systemic inflammatory response syndrome | 48 per 100 | 45 per 100 (33 to 60) | RR 0.94 (0.70 to 1.26) | 214 (1 study) | ⊕⊝⊝⊝ Very lowa,b,c | |
| Organ failure | 30 per 100 | 24 per 100 (16 to 38) | RR 0.81 (0.52 to 1.26) | 214 (1 study) | ⊕⊝⊝⊝ Very lowa,b,c | |
| Adverse events | RR 9.00 (0.49 to 165.14) | 214 (1 study) | ⊕⊝⊝⊝ Very lowa,b,c | |||
| *The basis for the assumed risk (e.g. median control group risk across studies) is provided in footnotes. The corresponding risk (and its 95% confidence interval) is based on the assumed risk in the comparison group and the relative effect of the intervention (and its 95% CI). CI: Confidence interval; RR: Risk ratio. | ||||||
| GRADE Working Group grades of evidence. High quality: Further research is very unlikely to change our confidence in the estimate of effect. Moderate quality: Further research is likely to have an important impact on our confidence in the estimate of effect and may change the estimate. Low quality: Further research is very likely to have an important impact on our confidence in the estimate of effect and is likely to change the estimate. Very low quality: We are very uncertain about the estimate. | ||||||
aAll trials were at high risk of bias. bTrials included in the meta‐analysis include few participants and few events. cQuality of evidence was downgraded by one level because of possible publication bias.
Background
Description of the condition
Acute pancreatitis (AP) is a potentially life‐threatening inflammatory disorder of the pancreatic gland, with an incidence in most Western and Asian countries ranging between 10 and 30 per 100,000 inhabitants, and accounting for more than 270,000 hospital admissions in the United States annually (Goldacre 2004; Imamura 2004; Lindkvist 2004; NIS 2012). An indicative increase in the incidence of AP has been reported and has been attributed to the use of more accurate diagnostic tests (i.e. computed tomography (CT) and endoscopic ultrasound) and to an increase in the incidence of gallstones and obesity (Frey 2006; Yadav 2006). In about 80% to 85% of cases, AP presents as a mild and self‐limiting disease, requiring only conservative treatment; the remaining 15% to 20% of cases represent severe forms of the disease characterised by the development of local and systemic complications (Sakorafas 2010; Tonsi 2009). Local complications consist of possible tissue destruction or necrosis; formation of a pseudocyst ‐ an abnormal collection of fluid or necrotic material for which walls are formed by the pancreas and other surrounding organs; and formation of an enclosed collection of liquefied, dead and infected tissue, called abscess. Systemic complications are caused by a systemic inflammatory response possibly leading to organ failure (most commonly, kidney failure, respiratory failure and shock). The most common causes of AP are gallstone disease and excessive alcohol consumption, which account for more than two‐thirds of cases (Munsell 2010). Less common causes include metabolic disorders such as hypertriglyceridaemia (abnormal elevation of serum triglycerides ‐ normal constituents of oil and fat) and hypercalcaemia (abnormal elevation of serum calcium), autoimmune pancreatitis, various bacterial or viral infections (i.e. mumps, Coxsackievirus, Mycoplasma pneumoniae), parasitic infestations of the biliary tract (e.g. Ascaris lumbricoides), abdominal abnormalities, trauma and drugs (e.g. steroids, sulphonamides, furosemide, thiazides).
Although the disease mechanisms of AP are still controversial, it is believed that a causative factor leads to uncontrolled activation of enzymes (chemical compounds that promote chemical reactions) within the pancreatic tissue and to self‐digestion of the gland, causing release of molecules that mediate the inflammatory response, tissue damage and possible necrosis. These local changes can trigger an intense inflammatory cascade leading to the development of systemic inflammatory response syndrome (SIRS) ‐ a generalised inflammatory response affecting different organs and whole organ systems, which can consequently cause organ failure and death (Frossard 2008; Kilciler 2008). The described events represent the first phase of the clinical course of severe acute pancreatitis (SAP), which can be followed in up to 40% of cases by a second phase marked by infection of the dead (necrotic) pancreatic tissue (Haney 2007). Infected pancreatic necrosis usually develops after the first week of disease and is associated with a significant increase in the prevalence of organ failure, with death occurring in about 30% of cases (Büchler 2000; Uhl 2002).
According to clinical guidelines (Banks 2006; Forsmark 2007; UK Working Party on Acute Pancreatitis 2005), the diagnosis of AP is established by the presence of two of the following three features: a compatible clinical presentation, including abdominal pain, nausea and vomiting; a three‐fold or greater elevation in serum amylase or lipase concentrations (digestive enzymes essential in the breakdown of starch and fat, which are released to a greater extent from the inflamed pancreas into the blood); or evidence of AP on CT. No specific treatment is available for AP. Most patients respond well to conservative management, including fluid volume resuscitation, pain control, oxygen administration, use of anti‐vomiting drugs and introduction to and administration of regulated food intake. Severe cases require admission to an intensive care unit and continuous monitoring of vital signs. Severe acute pancreatitis precipitates metabolic distress, leading to increased total energy expenditure and enhanced protein consumption. Therefore, nutritional support is an essential part of disease treatment (Gianotti 2009; Meier 2006); several studies have suggested certain advantages of enteral nutrition (EN) versus total parenteral nutrition (TPN) (Al‐Omran 2010; Yi 2012). Enteral nutrition comprises nutritional preparations in liquid form, which are absorbed by the intestines. It usually involves the administration of nutrients directly into the stomach or small intestine in patients who have difficulty swallowing via specific tubes that can be placed throughout the oral or nasal cavity or can be surgically implanted through the abdominal wall directly into the specified gastrointestinal organ. Enteral nutrition can also be given orally, most often as a supplement to a specific diet in malnourished patients. Total parenteral nutrition is the intravenous administration of nutrients that a patient requires via a catheter inserted into a major central or smaller peripheral vein. Use of antibiotics to prevent infection of necrotic tissue is highly debated. A recent Cochrane systematic review showed no beneficial effects of antibiotic prophylaxis, except for imipenem, an antibiotic from the carbapenem group that has a broad antibacterial activity spectrum; its use has led to a significant decrease in the incidence of pancreatic infection (Villatoro 2010). Endoscopic procedures that facilitate visualisation of the common bile duct should be considered in the early stages of severe gallstone pancreatitis with co‐existing bile duct obstruction, infection of the biliary tract (cholangitis) or sepsis (bacterial infection of the blood) (Frossard 2008; Tse 2012). The most common procedure of this type is endoscopic retrograde cholangiopancreatography (ERCP), in which the biliary tract is visualised under X‐ray imaging when a contrast agent is injected from the initial part of the small bowel into the common bile duct. In these cases, cutting the sphincter of Oddi, a muscle that lies at the junction of the intestine with both the bile and the pancreatic ducts, could facilitate removal of bile duct stones or treatment of other causes of bile obstruction. Surgical removal of necrotic tissue, as well as fluid collections, pseudocysts or abscess drainage, is indicated only when infected tissue is present. Sterile necrosis should be treated conservatively (Isaji 2006; Werner 2005).
Description of the intervention
For decades, one of the main principles applied in the treatment of patients with AP has been 'nil‐by‐mouth' (no oral intake), with or without TPN, to achieve suppression of pancreatic enzyme secretion and bowel rest. However, experimental and clinical studies have demonstrated that this approach can lead to increased risk of infectious complications due to bacterial overgrowth and translocation in the gut, resulting in higher morbidity (disease state rate) and mortality (death rate) among patients with severe forms of the disease. Furthermore, SAP is marked by an increase in the amount of energy required to perform vital functions at complete rest, also called basal metabolism, with a potentially negative effect on nutritional status and disease progression (Meier 2006). Therefore, adequate nutritional support is essential, preferably provided by the enteral route. Administration should start as soon as possible, especially with pre‐existing malnutrition, usually within 48 hours of admission (McClave 2009). Nutritional support is preferably administered via a tube inserted through the nasal cavity and the upper gastrointestinal tract (oesophagus and stomach) into the middle part of the small intestine, called the jejunum. This nasojejunal tube should be placed distal to the duodenojejunal junction (the point at which the initial part of the small intestine ‐ the duodenum ‐ ends and the jejunum begins) blindly, endoscopically or through radiological procedures. It has been discussed that tube positioning offers several advantages: It avoids the problem of decreased or absent movement of the stomach wall (gastroparesis) and possible duodenal obstruction due to inflammation or pseudocyst formation; it also provides increased energy delivery to the small bowel and ensures better pancreatic rest than tubes placed closer to the stomach (Thomson 2008). However, studies show no significantly different effects between nasojejunal and nasogastric routes of administration, whereby nutrients are delivered into the stomach (Eatock 2005; Kumar 2006). A wide range of EN formulations are available for clinical use and for different indications. They can be divided into three groups: polymeric, oligomeric and specialised formulations. Polymeric formulations contain intact proteins, and carbohydrates are represented in the form of maltodextrins, or water‐soluble molecules containing three or more glucose molecules, and oligosaccharides, which are molecules that consist of two to six simple basic sugar molecules known as monosaccharides. Finally, lipids in polymeric formulations are present in the form of long‐chain fatty acids. Oligomeric, also known as elemental or semi‐elemental, formulations comprise maltodextrins and monosaccharides, medium‐chain fatty acids and free fatty acids; protein components consist of smaller molecules, such as free amino acids, dipeptides and tripeptides (two or three interconnected amino acids). Oligomeric formulations are preferred to polymeric formulations for the treatment of patients with AP because they are usually associated with better tolerance and absorption in the gut and improved achievement of pancreatic rest (Makola 2006; Tiengou 2006). However, they are several times more expensive than polymeric formulations. Specialised formulations represent a larger group of specifically designed formulas enriched with different supplements. These include immuno‐enhanced formulations, which are enhanced by substances potentially able to modify the immune response. They most often contain specific amino acids such as glutamine and arginine, omega‐3 fatty acids and nucleotides (chemical compounds composed of a base, a sugar molecule and a phosphate group, which are the main structural elements of nucleic acids such as deoxyribonucleic acid (DNA)). Other specialised formulations include fibre‐enhanced formulations that can have prebiotic activity, meaning that they can stimulate the growth of normal enteral micro‐organisms. Some formulations are supplemented with probiotics (substances containing live bacteria or yeasts that add to the normal gastrointestinal flora) and may contain probiotics and prebiotic fibres, which usually are called symbiotics; disease‐specific formulations are available (Petrov 2009). The cost of these specialised preparations is even higher, but evidence of their efficiency is not reliable. In addition, formulations enriched with certain strains of probiotics have been associated with increased mortality (Besselink 2008; Gianotti 2006).
How the intervention might work
Intestinal barrier dysfunction has a pivotal role in the course of AP. It is known that micro‐organisms responsible for pancreatic infection and septic complications are generally common enteric bacteria normally present in the gut (Beger 1986; MacFie 1999). Disruption and overgrowth of these bacterial populations that form the normal intestinal flora in a metabolically deprived and immobile bowel could lead to bacterial and endotoxin translocation, meaning that bacteria and their toxic products could move through the intestinal membrane to emerge in the lymphatic or internal organ circulation. This mechanism is further supported by increased permeability of the intestinal membrane and local ischaemia (insufficient blood supply) of the gut due to dynamic changes in blood flow regulation in AP. The intense inflammatory state and the above mentioned processes cause impairment of the patient's immunological system (Xu 2006). Direct delivery of nutrients to the gut and stimulation of metabolic activity help maintaining the structural and functional integrity of the intestinal mucosa, thereby possibly reducing septic complications and morbidity (Buchman 1995). Data suggest that EN reduces the acute phase response by preserving protein metabolism of internal organs and down‐regulating the cytokine response (proteins acting as mediators between cells, as in the generation of an immune response) (Windsor 1998). The use of immuno‐enhanced formulas is supposed to intensify this effect. Glutamine released from muscle tissue acts as a gene promotor for cellular protection and immune responsiveness by activating the peroxisome proliferator‐activated receptor gamma, an intracellular receptor that regulates glucose metabolism and fatty acid storage. In addition, glutamine is a potent antioxidant through its metabolite glutathione, which is a tripeptide important for the protection of various cellular structures and the detoxification of harmful compounds. Furthermore, glutamine stimulates production of arginine ‐ another supplement that has demonstrated potential effects by influencing the production of nitric oxide (a naturally occurring gas in the body that stimulates blood vessel dilation and improves blood flow). Nucleotides act as prebiotics ‐ substances that stimulate the growth of beneficial enteric bacteria. Fish oils containing omega‐3 fatty acids have a suppressive effect on endothelial cells and pro‐inflammatory mediators. Their effects are believed to result from inhibition of nuclear factor kappa B (a protein that controls gene expression), displacement of arachidonic acid from cellular membranes and stimulation of leukotriene B4 and prostaglandin E2 production (Santora 2010). Arachidonic acid is an essential fatty acid that is the precursor to leukotrienes and prostaglandins, which are classes of molecules produced by cells to mediate allergic and inflammatory reactions.
Why it is important to do this review
Acute pancreatitis represents a global burden of morbidity and mortality with an increasing incidence. As the result of differences among the studies conducted to date and a variety of accessible preparations for enteral feeding, a systematic review of specific formulations is needed to try to determine the most efficient and cost‐effective use of enteral nutrition in these patients.
Objectives
To assess the beneficial and harmful effects of different enteral nutrition formulations in patients with acute pancreatitis.
Methods
Criteria for considering studies for this review
Types of studies
Randomised clinical trials assessing enteral nutrition (EN) in patients with acute pancreatitis (AP).
We included randomised clinical trials irrespective of publication status, language or blinding. We assessed both included and excluded studies for reporting of adverse events. We listed in an additional table (Table 7) all studies reporting adverse events. However, only data from included trials were used in the statistical analysis.
1. Adverse events.
| Study | Participants in intervention group | Participants in control group | AEs in intervention group (participants) | AEs in control group (participants) | Author conclusions |
| Besselink 2008 | 153 | 145 | Nausea (20), Abdominal fullness (36), Diarrhoea (25), Bowel ischaemia (9) | Nausea (23), Abdominal fullness (43), Diarrhoea (28) | It was not clear wether the same participant experienced more than 1 adverse event. Of the 9 participants in the intervention group experiencing bowel ischaemia, 7 died as a result. None of the participants in the control group experienced bowel ischaemia |
| Hallay 2001 | 9 | 7 | No AEs | Bowel necrosis (1) | Serious adverse event, not clear whether it was associated with study medication |
| Huang 2008 | 14 | 18 | Nausea and vomiting (2), Bloating (5), Diarrhoea (5) | Nausea and vomiting (3), Bloating (3), Diarrhoea (2) | AEs were mild and did not require stoppage of EN administration |
| Karakan 2007 | 15 | 15 | Bloating and gas (3) | No AEs | Symptoms were mild and subsided spontaneously |
| Olah 2002 | 26 | 24 | EN intolerance (1), Feeding tube intolerance (2) | EN intolerance (2) | Participants were excluded from the analysis. Clinical manifestation of EN intolerance was not described |
| Olah 2007 | 42 | 41 | EN intolerance (2) | EN intolerance (2) | Participants were excluded from the analysis. Clinical manifestation of EN intolerance was not described |
| Pearce 2006 | 15 | 17 | Diarrhoea (1), Vomiting (2), Hypernatraemia (2) | Severe diarrhoea (2) | These AEs were clearly associated with EN according to trial authors. No further information was given regarding 2 participants experiencing severe diarrhoea |
| Poropat 2012 | 107 | 107 | Diarrhoea (4) | No AEs | These were mild cases of diarrhoea, not requiring cessation of EN |
| Sharma 2011 | 24 | 26 | No AEs | No AEs | No AEs were reported in both groups |
| Tiengou 2006 | 16 | 20 | Bloating (4) | Bloating (5) | AEs were mild in character |
AE = adverse events.
Types of participants
We included patients diagnosed with AP by any method according to, or compatible with, at least two of the three following criteria.
Abdominal pain consistent with AP.
Three‐fold or greater elevation in serum amylase or lipase.
Morphological (structural) changes consistent with AP detected on CT.
Exclusion criteria
Undefined EN formulations.
Use of enteral and parenteral nutrition combinations.
Acute pancreatitis after surgery.
Malignancy.
Patients younger than 18 years of age.
Types of interventions
Any type of EN regimen with a clearly specified type of nutritional formulation, irrespective of the route, start, rate or duration of administration versus a different type of EN formulation, placebo or no intervention for the treatment of patients with AP.
Any additional interventions were allowed if they were received equally by all treatment groups within a trial.
Types of outcome measures
Primary outcomes
All‐cause mortality.
Systemic inflammatory response syndrome (SIRS), defined by two or more of the following criteria: pulse rate > 90 beats per minute; respiratory rate > 20 per minute or arterial partial pressure of carbon dioxide (PaCO2) < 32mmHg; body temperature > 38ºC or < 36ºC; white cell count > 12,000 or < 4000 cells per mm3 (Buter 2002).
Multiple organ dysfunction syndrome, as defined by the Modified Marshall Scoring System, by which organ failure is defined as a score ≥ 2 for at least one of the three organ systems (Banks 2012).
Adverse events.
Secondary outcomes
Local septic complications (infected necrosis, abscess).
Other local complications (sterile necrosis, fluid collection, pseudocyst, fistula).
Other infection (e,g, pneumonia, urinary tract infection, septicaemia).
Length of hospital stay.
Quality of life.
Search methods for identification of studies
Electronic searches
We identified relevant randomised clinical trials by conducting electronic searches of the following.
The Cochrane Upper Gastrointestinal and Pancreatic Diseases Group Specialised Register of Clinical Trials, the Cochrane Central Register of Controlled Trials (CENTRAL) (2013, Issue 7) (Appendix 1).
MEDLINE from inception to 20 August 2013 (Appendix 2).
EMBASE from inception to 2013, week 33 (Appendix 3).
Science Citation Index–Expanded from 1980 to August 2013 (Appendix 4; Royle 2003).
Searching other resources
We searched the reference lists of identified relevant studies to look for additional trials. We checked review articles to find randomised trials not identified by the electronic searches. We contacted authors from relevant trials to request missing data so we could assess trials correctly. We contacted researchers active in the field and enquired whether they knew of any additional randomised clinical trials.. To obtain unpublished trials, we contacted pharmaceutical companies involved in the production and assessment of EN formulations. We searched for ongoing trials in ClinicalTrials.gov (http://clinicaltrials.gov/) and in the World Health Organization (WHO) International Clinical Trials Registry Platform (ICTRP) Search Portal (http://apps.who.int/trialsearch/).
Data collection and analysis
Selection of studies
Two review authors (GP, VG) retrieved the identified relevant trials for assessment. They independently evaluated whether these trials met the inclusion criteria. They listed excluded trials along with the reasons for exclusion. They resolved disagreements regarding trial selection by consulting a third review author (GH).
Data extraction and management
Two review authors (GP, VG) extracted and validated data independently using data extraction forms that were designed for this purpose. We requested the help of the Cochrane Upper Gastrointestinal and Pancreatic Disease Group in extracting information from non‐English language publications. For trials reported in more than one publication, we listed all publications under the publication with the most complete data and marked it as primary.
We searched for additional information and missing data by corresponding with principal investigators or co‐investigators of trials in cases in which relevant data were not published. We added to the data extraction forms information obtained through correspondence with these trial authors. We reported the dates when the information was requested and was eventually received in the 'Notes' section of the respective trial (Characteristics of included studies section). We resolved potential disparities in data extracted from the retrieved publications through consultation with the trial authors. We resolved disagreements among review authors by discussion. If we did not resolve disagreements through discussion, we consulted a third review author (GH or DS) to arbitrate the decision.
We extracted the following information from each trial: primary author, country of origin, trial design, number of participants randomly assigned, inclusion and exclusion criteria, participant characteristics, causes of AP, intervention regimens provided, period of follow‐up, participants lost to follow‐up, primary and secondary outcomes of trials at the latest available follow‐up, sample size estimation and intention‐to‐treat analysis. For a detailed description, review authors provided a data extraction sheet upon request by the primary review author (GP).
We assessed on a post‐protocol basis the overall quality of evidence for all primary outcomes according to the Grades of Recommendation, Assessment, Development and Evaluation (GRADE) system (GRADE 2004; Langendam 2013) using the software GRADE Profiler (GRADEpro). We downgraded the evidence from 'high quality' by one level for serious, or by two levels for very serious, study limitations (risk of bias) such as indirectness of of evidence, serious inconsistency, imprecision of effect estimates or potential publication bias (van Ginneken 2013).
Assessment of risk of bias in included studies
Confidence that the design and the report of the randomised clinical trial would restrict bias in the comparison of interventions defines methodological quality, and hence risk of bias (Gluud 2006; Kjaergard 2001; Moher 1998; Schulz 1995; Wood 2008). We assessed risk of bias using the following domains.
Allocation sequence generation
Low risk of bias: if the allocation sequence was generated by a computer or a random number table. Drawing lots, tossing a coin, shuffling cards and throwing dice were considered adequate.
Uncertain risk of bias: if the trial was described as randomised, but the method used for allocation sequence generation was not described.
High risk of bias: if a method involving dates, names or admittance numbers was used for allocation of participants. These trials will be excluded for assessment of benefits, but not of harms.
Allocation concealment
Low risk of bias: if allocation of participants involved a central independent unit, an on‐site locked computer, identically appearing numbered drug bottles or containers prepared by an independent pharmacist or investigator or sealed envelopes.
Uncertain risk of bias: if the trial was described as randomised, but the method of allocation concealment was not described.
High risk of bias: if the allocation sequence was known to the investigators who assigned participants, or if the study was quasi‐randomised. Quasi‐randomised studies would be excluded for assessment of benefits, but not of harms.
Blinding
Low risk of bias: if the trial was described as blind or if the parties that were blinded and the method of blinding were described, so that knowledge of allocation was adequately prevented during the trial.
Uncertain risk of bias: if the trial was described as blind, but the method of blinding was not described, so that knowledge of allocation was possible during the trial.
High risk of bias: if the trial was not blinded, so that allocation was known during the trial.
Incomplete outcome data
Low risk of bias: if the numbers of and reasons for withdrawals and dropouts in all intervention groups were described, or if it was specified that there were no withdrawals or dropouts.
Uncertain risk of bias: if the report gave the impression that there had been no withdrawals or dropouts, but this was not specifically stated.
High risk of bias: if the numbers of or reasons for withdrawals or dropouts were not stated.
Selective outcome reporting
Low risk of bias: if predefined or clinically relevant and reasonably expected outcomes (e.g. mortality, SIRS, multiple organ dysfunction syndrome, adverse events) were reported.
Uncertain risk of bias: if not all predefined or clinically relevant and reasonably expected outcomes were reported, or were not reported fully, or if it is unclear whether data on these outcomes were recorded.
High risk of bias: if one or more clinically relevant and reasonably expected outcomes were not reported; data on these outcomes were likely to have been recorded.
Other biases
Low risk of bias: if the trial appears to be free of other sources of bias (e.g. conflict of interest bias).
Uncertain risk of bias: if information is insufficient to assess whether other sources of bias are present.
High risk of bias: if it is likely that potential sources of bias related to specific design used, early termination due to some data‐dependent process, lack of sample size or power calculation or other risks of bias are present.
We assessed all included trials for risk of bias. If risk of bias in a trial was judged as 'low' in all of the above specified domains, the trial fell into the 'low risk of bias' group of trials. If risk of bias was judged as 'unclear' or 'high', the trial fell into the group with 'high risk of bias'.
Measures of treatment effect
We performed all statistical analyses using the statistical software of The Cochrane Collaboration ‐ Review Manager 5.2 (Review Manager 2013). For dichotomous outcomes, we expressed results as risk ratios (RRs) with 95% confidence intervals (CIs). When continuous scales of measurement were used to assess the effects of treatment, we used mean differences (MDs) with 95% CIs. We compared results of analyses including only one trial obtained with Review Manager 5.2 (Review Manager 2013) versus the recommended Fisher's exact test for dichotomous outcomes or the t‐test for continuous data, and we reported P values obtained by these tests.
Dealing with missing data
We tried to contact the original investigators to obtain missing data. We performed all analyses according to the intention‐to‐treat method, including all participants irrespective of compliance or follow‐up.
We included participants with incomplete or missing data in the sensitivity analyses by imputing data according to the following two scenarios (Hollis 1999).
'Best‐worst' case scenario analyses: Participants with missing outcomes data are considered successes in the experimental group and failures in the control group. The denominator included all participants in the trial.
'Worst‐best' case scenario analyses: Participants with missing outcomes data are considered failures in the experimental group and successes in the control group. The denominator included all participants in the trial.
If continuous data were missing, we used the 'last observation carried forward' method to deal with missing data.
Assessment of heterogeneity
We assessed the presence of statistical heterogeneity by performing the Chi² test with significance set at P value < 0.10 and measured the quantities of heterogeneity by using the I² statistic (Higgins 2003).
Assessment of reporting biases
We intended to use funnel plot graphs to inform us of the likelihood of bias in the meta‐analysis (Egger 1997). We did not prepare a funnel plot, as we did not have the recommended number of 10 or more trials for any meta‐analysis.
Data synthesis
We performed this review according to the recommendations of the Cochrane Handbook for Systematic Reviews of Interventions (Higgins 2011). We performed meta‐analysis of data using a random‐effects model, and we used a fixed‐effect model to ensure the robustness of results (Demets 1987; DerSimonian 1986). When significant differences were noted in results produced by the two models, we presented the results obtained with both methods. If no differences were observed between the results of the two models, we reported only the results of the fixed‐effect model analysis.
Subgroup analysis and investigation of heterogeneity
We planned to perform subgroup analysis on the following.
Trials comparing two or more types of EN formulations.
Trials comparing EN versus placebo.
Trials comparing EN versus no intervention.
Participants with severe acute pancreatitis.
Nasojejunal versus nasogastric route of administration.
Early (≤ 48 hours) versus late (> 48 hours) start of administration.
Oral refeeding started within seven days after admission versus oral refeeding started more than seven days after admission.
Trials with low risk of bias versus trials with high risk of bias.
Results
Description of studies
See Characteristics of included studies and Characteristics of excluded studies.
Results of the search
Our search of electronic databases yielded 751 references. We identified no additional records through other sources. We excluded 724 references on the basis of title and abstract alone because they were not randomised trials investigating the effect of EN in AP, they were reviews or they did not involve AP. We assessed for eligibility the remaining 27 articles and one additional article (Hallay 2001) identified by reading through the reference list of a published meta‐analysis of EN formulations in AP (Petrov 2009). We excluded eight articles and listed the reasons for exclusion (see Excluded studies). We identified 20 publications describing 15 randomised clinical trials (see Included studies). The study flow diagram is shown in Figure 1. Thirteen trials were published as full‐text articles (Besselink 2008; Hallay 2001; Huang 2008; Lasztity 2005; Lata 2010; Lu 2008; Olah 2002; Olah 2007; Pearce 2006; Petrov 2013; Plaudis 2012; Wang 2007; Wang 2013), and two trials were published as abstracts (Cravo 1989; Poropat 2012). We contacted the primary authors to ask for further information and data related to the trials. Dr Besselink kindly provided information regarding the method of allocation concealment applied (Besselink 2008). Dr Plaudis kindly provided information about the randomisation method used and about blinding (Plaudis 2012), and Dr Pearce provided details on the type of EN used in the Pearce 2006 trial. GP and DS provided unpublished data and information regarding the Poropat 2012 trial. Dr Olah kindly provided information regarding randomisation and exclusion of participants (Olah 2002; Olah 2007). Dr Cravo replied but provided no additional information (Cravo 1989). No other contacted study authors have replied so far.
1.

Study flow diagram.
We contacted pharmaceutical companies involved in the production and assessment of EN formulations and asked for information about ongoing or unpublished trials. We have received no responses so far.
We identified two ongoing trials by searching through ClinicalTrials.gov (http://ClinicalTrials.gov) and one additional trial by searching the World Health Organization (WHO) International Clinical Trials Registry Platform (http://www.who.int/ictrp/en/). We have classified these as ongoing trials (Characteristics of ongoing studies).
Included studies
A total of 1376 participants were randomly assigned in the 15 randomised clinical trials included in this review. Among the trials that reported gender ratio, approximately 60% of participants were male. All included trials applied a parallel‐group design. One trial, Wang 2013, consisted of three study groups, of which the third group (n = 60) received parenteral nutrition (PN). This group was not included in our analysis, as use of PN is an exclusion criterion; however, we analysed data from the other two study groups comparing probiotic EN versus a semi‐elemental type of EN. Two other trials, Plaudis 2012 and Wang 2007, included three study groups that were combined to ensure a pair‐wise comparison when needed. The Plaudis 2012 trial compared EN with probiotics and fibres versus an only fibre‐enriched formulation and versus a polymeric formulation. We arranged the analyses by comparing data from the group treated with EN with probiotics and fibres versus the combination of data from the remaining two groups, and we compared separately the fibre‐enriched group versus the polymeric group. In the Wang 2007 trial, the first group was treated by immunonutrition with probiotics, the second group received fibre‐enriched EN and the third group received no intervention. We compared data from the first group versus combined data from the remaining groups, and we separately compared data between the second and third groups of participants.
Four trials assessed the use of immunonutrition, three of them compared this with polymeric formulations (Huang 2008; Lasztity 2005; Pearce 2006) and one group compared it with no intervention (Poropat 2012). Two trials assessed immunonutrition with fibres, Hallay 2001 comparedthis with a fibre‐enriched polymeric formula and Lu 2008 used ebselen (a specific immunomodulatory agent) and ethyl‐hydroxyethyl cellulose (EHEC) as fibre in comparison with vehicle alone. Three other trials compared the use of EN supplemented with probiotics and fibres versus only fibre‐enriched EN (Besselink 2008; Olah 2002; Olah 2007), and Lata 2010 compared EN supplemented with probiotics versus a polymeric formulation. Two trials assessed the use of semi‐elemental formulations: One compared them versus a polymeric formulation (Cravo 1989), the other versus no intervention (Petrov 2013).
Most trials used a nasojejunal feeding tube, except for Petrov 2013, which used a nasogastric route of administration. One trial administered EN orally (Plaudis 2012), and two trials did not report the route of administration (Cravo 1989; Huang 2008).
Only two trials initiated EN after 48 hours following admission (Cravo 1989; Wang 2007), and two trials stated that enteral feeding was started within 72 hours of admission (Besselink 2008; Huang 2008). Lata 2010 gave no information about the initiation time of enteral feeding. All other included trials started EN within 24 to 48 hours from hospital admission.
The duration of EN administration was at least seven days in three trials (Lu 2008; Olah 2002; Olah 2007), at least five days in the Poropat 2012 trial and 14 days in the Huang 2008 trial. Pearce 2006 administered EN for a minimum of 72 hours to a maximum of 15 days, and Besselink 2008 and Petrov 2013 administered EN until oral feeding was re‐commenced, without specifying the exact time frame. In the Wang 2007 trial, EN was terminated when complete bowel function was recovered. The remaining six trials did not address this issue (Cravo 1989; Hallay 2001; Lasztity 2005; Lata 2010; Plaudis 2012; Wang 2013).
Excluded studies
We excluded eight trials; five trials used a combination of EN and PN (Bai 2010; Karakan 2007; Lu 2011; Powell 2000; Tiengou 2006), one trial assessed oral administration of probiotics as a supplement to different feeding modes in AP (Sharma 2011) and one trial used a combination of different EN formulations in the same group of participants, making it impossible for investigators to assess a specific EN formulation (Cui 2009). The specific type of EN formulation used was not stated in one trial (Pandey 2004).
Risk of bias in included studies
Risk of bias was assessed according to seven domains: allocation sequence generation, allocation concealment, blinding of participants and study personnel, blinding of outcome assessors, management of incomplete outcome data, selective outcome reporting and other potential sources of bias. All included trials were judged as having high risk of bias. Our risk of bias assessment is summarised in Figure 2 and Figure 3.
2.

Risk of bias graph: review authors' judgements about each risk of bias item presented as percentages across all included studies.
3.

Risk of bias summary: review authors' judgements about each risk of bias item for each included study.
Allocation
Allocation sequence was adequately generated in five trials (Besselink 2008; Pearce 2006; Petrov 2013; Plaudis 2012; Poropat 2012) by the use of computer‐generated random number sequences or lists of random numbers. We assessed 10 trials (Cravo 1989; Hallay 2001; Huang 2008; Lasztity 2005; Lata 2010; Lu 2008; Olah 2002; Olah 2007; Wang 2007; Wang 2013) as having unclear risk of bias because the method of allocation sequence generation was not described.
Three trials had appropriately concealed the randomisation sequence, three of them (Besselink 2008; Hallay 2001; Petrov 2013) by using sealed, opaque envelopes or sealed, numbered containers. Ten trials did not describe the method of allocation concealment used (Cravo 1989; Huang 2008; Lasztity 2005; Lu 2008; Olah 2002; Olah 2007; Pearce 2006; Plaudis 2012; Wang 2007; Wang 2013). In one trial (Poropat 2012), randomisation was performed by the hospital pharmacist, who was unaware of participants' characteristics and was not otherwise involved in the study; however, the randomisation list could have been viewed by other study personnel. Lata 2010 was assessed as having high risk of bias because six participants were allocated to the placebo group for safety reasons after results of concern about probiotic use in AP were published.
Blinding
We judged the method of blinding of participants and study personnel as adequate in the Besselink 2008 and Plaudis 2012 trials. Besselink 2008 also described adequate blinding of outcome assessors. Outcome assessors were adequately blinded in the Poropat 2012 trial, and participants and personnel clearly were not blinded to study treatment; therefore this study was judged as having high risk of bias. Eleven trials did not provide enough information regarding the blinding method used (Cravo 1989; Hallay 2001; Huang 2008; Lasztity 2005; Lu 2008; Olah 2002; Olah 2007; Pearce 2006; Petrov 2013; Wang 2007; Wang 2013). Blinding was broken, potentially influencing outcomes in the Lata 2010 trial.
Incomplete outcome data
Four trials adequately reported the numbers and reasons for withdrawals and dropouts (Besselink 2008; Olah 2002; Pearce 2006; Poropat 2012), and six trials described no withdrawals and dropouts (Huang 2008; Lasztity 2005; Lu 2008; Petrov 2013; Plaudis 2012; Wang 2007). Four trials provided insufficient information for assessment of attrition bias (Cravo 1989; Hallay 2001; Lata 2010; Wang 2013). We judged Olah 2007 as having high risk of bias as participant evaluation and exclusion of 21 patients were performed after randomisation, potentially influencing study outcomes.
Selective reporting
The trial protocol was available for three trials (Besselink 2008; Petrov 2013; Poropat 2012), and five additional trials reported all prespecified and expected outcomes (Huang 2008; Lasztity 2005; Plaudis 2012; Wang 2007; Wang 2013). The Pearce 2006 trial did not report on some prespecified and expected outcomes that are of great clinical importance (i.e. infected necrosis) and therefore was judged as having high risk of bias. The remaining trials provided insufficient information for adequate assessment of this domain (Cravo 1989; Hallay 2001; Lata 2010; Lu 2008; Olah 2002; Olah 2007).
Other potential sources of bias
We assessed 11 trials as being free of other potential sources of bias (Hallay 2001; Huang 2008; Lasztity 2005; Lu 2008; Olah 2002; Olah 2007; Petrov 2013; Plaudis 2012; Poropat 2012; Wang 2007; Wang 2013). The Pearce 2006 trial seems to have been supported by a sponsor; however study authors did not specifically describe the involvement of the sponsor in trial design, conduct, analyses of results and/or reporting. Cravo 1989 did not provide enough information for review authors to assess this domain. We judged the Lata 2010 trial as having high risk of bias because of probable baseline imbalance due to inadequate allocation of participants. We judged possible baseline imbalance due to a higher incidence of multiple organ failure in the intervention group, which could have influenced study outcomes in Besselink 2008, as causing unclear risk of bias.
Effects of interventions
See: Table 1; Table 2; Table 3; Table 4; Table 5; Table 6
Immunonutrition versus control
This analysis contained six trials (Hallay 2001; Huang 2008; Lasztity 2005; Lu 2008; Pearce 2006; Poropat 2012) including a total of 520 participants, which compared EN versus immunonutrients added to control. We summarised the results for primary outcome measures in Table 1. We downgraded the quality of the evidence for outcomes of all‐cause mortality, SIRS and organ failure from high to low because all included trials are at high risk of bias and included trials trials examined relatively small numbers of participants and events; we downgraded adverse events from high to very low as the result of additional inconsistency of results.
Primary outcomes
All‐cause mortality
Six trials provided data on all‐cause mortality (Hallay 2001; Huang 2008; Lasztity 2005; Lu 2008; Pearce 2006; Poropat 2012). Use of immunonutrition significantly decreased mortality in participants with AP (RR 0.49, 95% CI 0.29 to 0.80, I² = 0%) (Analysis 1.1). The number of deaths reported was 20/262 participants in the immunonutrition group versus 40/258 in the control group.
1.1. Analysis.
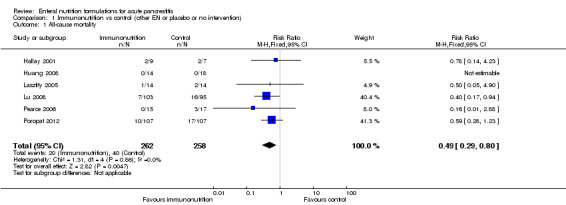
Comparison 1 Immunonutrition vs control (other EN or placebo or no intervention), Outcome 1 All‐cause mortality.
Systemic inflammatory response syndrome
Three trials reported on SIRS (Huang 2008; Pearce 2006; Poropat 2012). Immunonutrition had no significant effect on SIRS development (RR 1.00, 95% CI 0.76 to 1.31, I² = 0%) (Analysis 1.2). SIRS occurred in 56/136 and 57/142 participants in the immunonutrition and control groups, respectively.
1.2. Analysis.
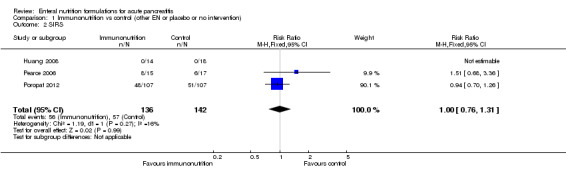
Comparison 1 Immunonutrition vs control (other EN or placebo or no intervention), Outcome 2 SIRS.
Organ failure
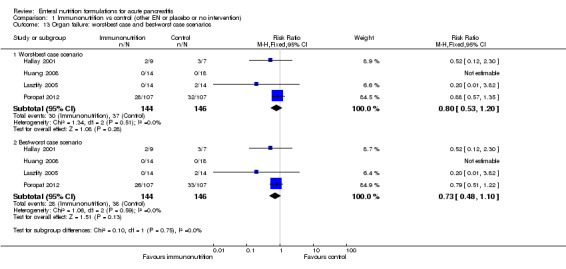
We obtained data on organ failure from four trials (Hallay 2001; Huang 2008; Lasztity 2005; Poropat 2012). Immunonutrition did not demonstrate any significant effect on the incidence of organ failure (RR 0.75, 95% CI 0.49 to 1.13, I² = 0%) (Analysis 1.3). A total of 28/144 participants with organ failure were reported in the immunonutrition group, and 37/146 in the control group.
1.3. Analysis.

Comparison 1 Immunonutrition vs control (other EN or placebo or no intervention), Outcome 3 Organ failure.
Adverse events
In total, four trials reported on adverse events (Hallay 2001; Huang 2008; Pearce 2006; Poropat 2012). Reported adverse events included nausea, vomiting, bloating, diarrhoea, pain relapse, hypernatraemia and in one case bowel necrosis. Bowel necrosis as a serious adverse event was reported for one participant in the control group of the Hallay 2001 trial, but no further information was available. Pearce 2006 reported two severe adverse events in the intervention group and four in the control group, however, with no other specification or explanation. The number of participants experiencing adverse events was not significantly different between groups (RR 1.32, 95% CI 0.78 to 2.24, I² = 50%) (Analysis 1.4); 17/145 and 15/149 participants were included in the immunonutrition and control groups, respectively.
1.4. Analysis.

Comparison 1 Immunonutrition vs control (other EN or placebo or no intervention), Outcome 4 Adverse events.
Secondary outcomes
Local septic complications
Only Poropat 2012 reported on local septic complications, the occurrence of which was not significantly different between groups (RR 5.00, 95% CI 0.24 to 102.93) (Analysis 1.5). Local septic complications were confirmed in 2/107 participants in the intervention group and in 0/107 participants in the control group (P value 0.49).
1.5. Analysis.

Comparison 1 Immunonutrition vs control (other EN or placebo or no intervention), Outcome 5 Local septic complications.
Other local complications
No significant difference was observed in the occurrence of other local complications (RR 1.18, 95% CI 0.89 to 1.57, I² = 0%) (Analysis 1.6), which was reported as an outcome in two trials (Lasztity 2005; Poropat 2012). These complications occurred in 58/121 and 49/121 participants in the intervention and control groups, respectively.
1.6. Analysis.
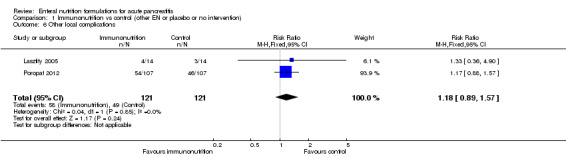
Comparison 1 Immunonutrition vs control (other EN or placebo or no intervention), Outcome 6 Other local complications.
Other infections
Two trials (Hallay 2001; Lasztity 2005) reported on other infections. Immunonutrition had no significant effect on the development of other infections (RR 0.56, 95% CI 0.24 to 1.28, I² = 2%) (Analysis 1.7). Other infections were reported in 5/23 and 9/21 participants in the immunonutrition and control groups, respectively.
1.7. Analysis.
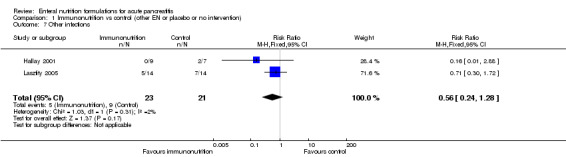
Comparison 1 Immunonutrition vs control (other EN or placebo or no intervention), Outcome 7 Other infections.
C‐reactive protein concentrations
We analysed the values measured on the third day after admission as reported by Lasztity 2005 and Poropat 2012. The difference was not significant (MD 1.98, 95% CI ‐21.17 to 25.13, I² = 71%) (Analysis 1.8). Values of serum CRP concentrations from last available follow‐up did not differ significantly (MD 16.30, 95% CI ‐3.03 to 35.63, I² = 6%) (Analysis 1.9) and were reported by three trials.
1.8. Analysis.

Comparison 1 Immunonutrition vs control (other EN or placebo or no intervention), Outcome 8 CRP: measured on day 3.
1.9. Analysis.

Comparison 1 Immunonutrition vs control (other EN or placebo or no intervention), Outcome 9 CRP: last available follow‐up.
Length of hospital stay
Differences in hospitalisation length as reported by five trials (Huang 2008; Lasztity 2005; Lu 2008; Pearce 2006; Poropat 2012) were not significant (RR 0.53, 95% CI ‐1.19 to 2.24, I² = 59%) (Analysis 1.10).
1.10. Analysis.

Comparison 1 Immunonutrition vs control (other EN or placebo or no intervention), Outcome 10 Length of hospital stay.
Quality of life
None of the trials reported on quality of life.
Worst‐best case and best‐worst case scenario sensitivity analyses
When we performed sensitivity analyses on primary outcomes according to worst‐best case and best‐worst case scenarios for missing data (Analysis 1.11; Analysis 1.12; Analysis 1.13; Analysis 1.14), our conclusions remained unchanged.
1.11. Analysis.

Comparison 1 Immunonutrition vs control (other EN or placebo or no intervention), Outcome 11 All‐cause mortality: worst‐best and best‐worst case scenarios.
1.12. Analysis.

Comparison 1 Immunonutrition vs control (other EN or placebo or no intervention), Outcome 12 SIRS: worst‐best case and best‐worst case scenarios.
1.13. Analysis.
Comparison 1 Immunonutrition vs control (other EN or placebo or no intervention), Outcome 13 Organ failure: worst‐best case and best‐worst case scenarios.
1.14. Analysis.

Comparison 1 Immunonutrition vs control (other EN or placebo or no intervention), Outcome 14 Adverse events: worst‐best case and best‐worst case scenarios.
Subgroup analyses
We performed subgroup analyses on primary outcomes of trials comparing two different EN formulations; in this case three trials compared immunonutrition versus a polymeric enteral feed (Huang 2008; Lasztity 2005; Pearce 2006), and one trial (Hallay 2001) compared immunonutrition versus addition of fibres to a polymeric fibre‐enriched formula. Immunonutrition versus polymeric EN did not show a significant effect on all‐cause mortality (RR 0.29, 95% CI 0.05 to 1.67, I² = 0%) (Analysis 1.15.1), organ failure (RR 0.20, 95% CI 0.01 to 3.82) (Analysis 1.16.1) or adverse events (RR 1.16, 95% CI 0.67 to 1.98, I² = 60%) (Analysis 1.17.1). Immunonutrition supplemented with fibres versus fibre‐enriched polymeric EN had no significant effect on mortality (RR 0.78, 95% CI 0.14 to 4.23) (Analysis 1.15.2), organ failure (RR 0.52, 95% CI 0.12 to 2.30) (Analysis 1.16.2) or adverse events (RR 0.27, 95% CI 0.01 to 5.70) (Analysis 1.17.2). Two studies comparing immunonutrition versus polymeric EN (Huang 2008; Pearce 2006) reported on SIRS and did not show a significant effect (RR 1.51, 95% CI 0.68 to 3.36) (Analysis 1.18).
1.15. Analysis.

Comparison 1 Immunonutrition vs control (other EN or placebo or no intervention), Outcome 15 All‐cause mortality: immunonutrition vs other EN.
1.16. Analysis.

Comparison 1 Immunonutrition vs control (other EN or placebo or no intervention), Outcome 16 Organ failure: immunonutrition vs other EN.
1.17. Analysis.

Comparison 1 Immunonutrition vs control (other EN or placebo or no intervention), Outcome 17 Adverse events: immunonutrition vs other EN.
1.18. Analysis.

Comparison 1 Immunonutrition vs control (other EN or placebo or no intervention), Outcome 18 SIRS: immunonutrition vs other EN.
We also performed subgroup analysis on primary outcomes for patients with severe acute pancreatitis (SAP). We included two trials (Huang 2008; Poropat 2012) that showed no significant effect on mortality (RR 0.77, 95% CI 0.42 to 1.40) (Analysis 1.19) or on SIRS (RR 1.03, 95% CI 0.80 to 1.34) (Analysis 1.20). Poropat 2012 defined participants with SAP according to the revised Atlanta criteria as those having persistent organ failure; therefore subgroup analysis on this outcome was not plausible. Huang 2008 reported that no organ failure occurred in both groups of participants. No adverse events were reported for participants with SAP in both trials.
1.19. Analysis.

Comparison 1 Immunonutrition vs control (other EN or placebo or no intervention), Outcome 19 All‐cause mortality: participants with SAP.
1.20. Analysis.

Comparison 1 Immunonutrition vs control (other EN or placebo or no intervention), Outcome 20 SIRS: participants with SAP.
Probiotics versus control
The analysis included six trials (Besselink 2008; Lata 2010; Olah 2002; Olah 2007; Plaudis 2012; Wang 2013) with a total of 666 participants comparing EN supplemented with probiotics versus control. We combined the data from Plaudis 2012 containing three different study groups to form one pair‐wise analysis of interest (Higgins 2011). We summarised results for primary outcome measures in Table 2. We downgraded the quality of evidence of all primary outcomes, except for adverse events, from high to very low because of high risk of bias, inconsistency and imprecision of results, and we graded the quality of adverse events as low.
Primary outcomes
All‐cause mortality
All six trials analysed and reported on all‐cause mortality (Besselink 2008; Lata 2010; Olah 2002; Olah 2007; Plaudis 2012; Wang 2013). The difference in all‐cause mortality between groups was not significant (RR 1.13, 95% CI 0.66 to 1.91, I² = 63%) (Analysis 2.1). Deaths occurred in 28/320 and 26/346 participants in the probiotics and control groups.
2.1. Analysis.

Comparison 2 Probiotics vs control (other EN or placebo or no intervention), Outcome 1 All‐cause mortality.
Systemic inflammatory response syndrome
Probiotics showed no significant effect on development of SIRS in three trials (Olah 2002; Olah 2007; Plaudis 2012) (RR 1.07, 95% CI 0.90 to 1.27, I² = 67%) (Analysis 2.2). SIRS was reported in 45/98 and 70/125 participants in the probiotics and control groups, respectively.
2.2. Analysis.

Comparison 2 Probiotics vs control (other EN or placebo or no intervention), Outcome 2 SIRS.
Organ failure
Five trials reported on the occurrence of organ failure (Besselink 2008; Olah 2002; Olah 2007; Plaudis 2012; Wang 2013). Investigators described no significant effect of probiotics on the occurrence of organ failure (RR 0.84, 95% CI 0.67 to 1.04, I² = 61%) (Analysis 2.3). In the probiotics group, 63/313 participants with organ failure were compared with 103/331 in the control group.
2.3. Analysis.

Comparison 2 Probiotics vs control (other EN or placebo or no intervention), Outcome 3 Organ failure.
Adverse events
Adverse events reported in the Olah 2002 and Olah 2007 trials were defined as intolerance of jejunal feeding and intolerance of the feeding tube. Five participants in the Olah 2002 trial and four participants in the Olah 2007 study who were reported as experiencing adverse events were excluded from the final analyses in these trials. The difference between the two groups among participants who experienced any adverse event was not significant (RR 1.18, 95% CI 0.33 to 4.20, I² = 0%) (Analysis 2.4).
2.4. Analysis.

Comparison 2 Probiotics vs control (other EN or placebo or no intervention), Outcome 4 Adverse events.
We did not include data from Besselink 2008 because the trial authors reported the total number of events, instead of the number of participants experiencing adverse events, so it was unclear wether one participant experienced more than one adverse event. The trial reported nausea (n = 20), abdominal fullness (n = 36), diarrhoea (n = 25) and bowel ischaemia (n = 9) in the probiotics group, and nausea (n = 23), abdominal fullness (n = 43), diarrhoea (n = 28) and bowel ischaemia (n = 0) in the control group. No significant difference was noted in the occurrence of nausea (RR 0.82, 95% CI 0.47 to 1.42) (P value 0.51), abdominal fullness (RR 0.79, 95% CI 0.54 to 1.15) (P value 0.24) or diarrhoea (RR 0.84, 95% CI 0.52 to 1.37) (P value 0.55). However, bowel ischaemia as a serious adverse event was significantly more frequent in the probiotics group (RR 17.89, 95% CI 1.05 to 304.59) (P value 0.004), and eight of these participants died as a result.
Secondary outcomes
Local septic complications
All six trials (Besselink 2008; Lata 2010; Olah 2002; Olah 2007; Plaudis 2012; Wang 2013) included in this analysis reported on this outcome. The use of probiotics did not reach statistical significance in decreasing the occurrence of local septic complications (RR 0.69, 95% CI 0.46 to 1.05, I² = 48%) (Analysis 2.5). Local septic complications were detected in 34/320 and 51/346 participants in the probiotics and control groups, respectively.
2.5. Analysis.

Comparison 2 Probiotics vs control (other EN or placebo or no intervention), Outcome 5 Local septic complications.
Other local complications
Other local complications were reported by three trials (Besselink 2008; Olah 2002; Olah 2007), and no significant effect of probiotics was confirmed (RR 1.13, 95% CI 0.86 to 1.49, I² = 0%) (Analysis 2.6). Other local complications were reported in 75/221 and 63/210 participants in the probiotics and control groups, respectively.
2.6. Analysis.

Comparison 2 Probiotics vs control (other EN or placebo or no intervention), Outcome 6 Other local complications.
Other infections
Three trials reported a significantly lower rate of other infections in the probiotics group (Olah 2002; Olah 2007; Plaudis 2012) (RR 0.56, 95% CI 0.32 to 0.98, I² = 0%) (Analysis 2.7), with 15/98 and 30/125 participants reported in the probiotics and control groups, respectively.
2.7. Analysis.
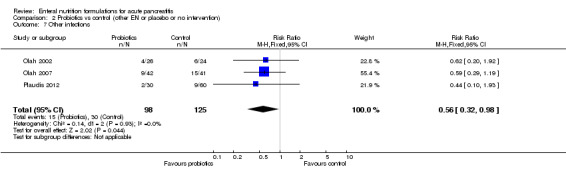
Comparison 2 Probiotics vs control (other EN or placebo or no intervention), Outcome 7 Other infections.
Besselink 2008 reported the total number of infections, instead of the numbers of participants developing other infections, with bacteraemia occurring in 33 versus 22 (RR 1.42, 95% CI 0.87 to 2.32) (P value 0.18), pneumonia in 24 versus 16 (RR 1.42, 95% CI 0.79 to 2.57) (P value 0.31), urosepsis in one versus two (RR 0.47, 95% CI 0.04 to 5.17) (P value 0.61) and infected ascites in four versus zero (RR 8.53, 95% CI 0.46 to 157.09) (P value 0.12) participants in the probiotics and control groups, respectively. Differences between specific infections were not significant.
C‐reactive protein concentrations
Two trials (Lata 2010; Plaudis 2012) reported measurements of CRP concentrations. We assessed values of serum CRP concentrations measured on the third day after admission detecting a significantly higher value in the intervention group (MD 90.59, 95% CI 43.77 to 137.41, I² = 93%) (Analysis 2.8). Last available follow‐up values of CRP did not differ significantly between groups (MD 2.81, 95% CI ‐4.90 to 10.53, I² = 14%) (Analysis 2.9). Last available follow‐up for CRP in Lata 2010 was detected on the tenth day after admission, and in Plaudis 2012 at discharge from hospital. We were able to include data from Plaudis 2012 regarding only the comparison between the group receiving polymeric EN supplemented with probiotics and fibres versus the group receiving polymeric EN supplemented only with fibres, because authors were not able to provide data from the third study group treated with a plain polymeric formulation for technical reasons.
2.8. Analysis.

Comparison 2 Probiotics vs control (other EN or placebo or no intervention), Outcome 8 CRP: measured on day 3.
2.9. Analysis.
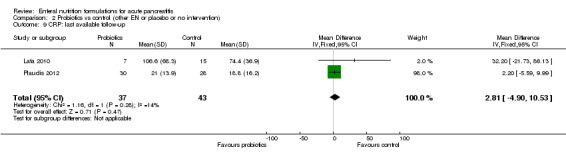
Comparison 2 Probiotics vs control (other EN or placebo or no intervention), Outcome 9 CRP: last available follow‐up.
Length of hospital stay
We performed this analysis on data reported by five trials (Besselink 2008; Lata 2010; Olah 2002; Olah 2007; Plaudis 2012). As standard deviations were missing in the Olah 2007 trial, we had to impute them as an average of standard deviations from other trials included in the analysis. We found no statistically significant differences in length of hospitalisation between groups (MD ‐1.71, 95% CI ‐6.04 to 2.61, I² = 37%) (Analysis 2.10).
2.10. Analysis.

Comparison 2 Probiotics vs control (other EN or placebo or no intervention), Outcome 10 Length of hospital stay.
Quality of life
None of the trials reported on quality of life.
Worst‐best case and best‐worst case scenario analyses
In the worst‐best case scenario, all‐cause mortality was significantly higher in the probiotics group than in the control group in the fixed‐effect model (RR 1.64, 95% CI 1.02 to 2.65, I² = 37%) (Analysis 2.11), but was not significantly different in the random‐effects model (RR 1.52, 95% CI 0.72 to 3.21, I² = 37%). Occurrence of SIRS was significantly higher in the probiotics group with the fixed‐effect model (RR 1.30, 95% CI 1.08 to 1.56, I² = 97%) (Analysis 2.12), but not with the random‐effects model (RR 1.74, 95% CI 0.22 to 13.83, I² = 97%). No significant difference in organ failure was noted between groups (RR 0.99, 95% CI 0.80 to 1.22, I² = 26%) (Analysis 2.13), nor in the occurrence of adverse events (RR 2.87, 95% CI 0.97 to 8.44, I² = 3%) (Analysis 2.14).
2.11. Analysis.

Comparison 2 Probiotics vs control (other EN or placebo or no intervention), Outcome 11 All‐cause mortality: worst‐best case and best‐worst case scenarios.
2.12. Analysis.

Comparison 2 Probiotics vs control (other EN or placebo or no intervention), Outcome 12 SIRS: worst‐best case and best‐worst case scenarios.
2.13. Analysis.

Comparison 2 Probiotics vs control (other EN or placebo or no intervention), Outcome 13 Organ failure: worst‐best case and best‐worst case scenarios.
2.14. Analysis.

Comparison 2 Probiotics vs control (other EN or placebo or no intervention), Outcome 14 Adverse events: worst‐best case and best‐worst case scenarios.
In the best‐worst case scenario, no significant difference was noted in all‐cause mortality (RR 0.70, 95% CI 0.44 to 1.11, I² = 80%) (Analysis 2.11) nor in SIRS between groups (RR 0.84, 95% CI 0.70 to 1.00, I² = 96%) (Analysis 2.12). Results showed a significantly lower number of participants with organ failure in the probiotics group with a fixed‐effect model (RR 0.71, 95% CI 0.57 to 0.88, I² = 87%) (Analysis 2.13), but not with a random‐effects model (RR 0.59, 95% CI 0.27 to 1.28, I² = 87%). The number of adverse events was significantly higher in the control group (RR 0.18, 95% CI 0.06 to 0.55, I² = 0%) (Analysis 2.14).
Subgroup analyses
When stratifying analysis for trials comparing two different EN formulations, we assessed four trials comparing polymeric EN supplemented with probiotics and fibres versus a fibre‐enriched polymeric formula (Besselink 2008; Olah 2002; Olah 2007; Plaudis 2012). We found no significant differences in all‐cause mortality (RR 1.41, 95% CI 0.80 to 2.49, I² = 61%) (Analysis 2.15), SIRS (RR 1.08, 95% CI 0.87 to 1.33, I² = 73%) (Analysis 2.16), organ failure (RR 0.95, 95% CI 0.72 to 1.24, I² = 45%) (Analysis 2.17) nor adverse events (RR 1.18, 95% CI 0.33 to 4.20, I² = 0%) (Analysis 2.18).
2.15. Analysis.
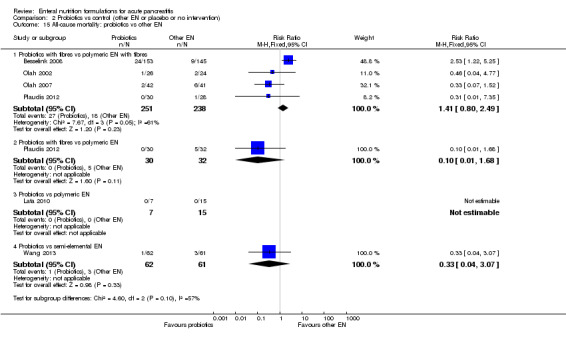
Comparison 2 Probiotics vs control (other EN or placebo or no intervention), Outcome 15 All‐cause mortality: probiotics vs other EN.
2.16. Analysis.

Comparison 2 Probiotics vs control (other EN or placebo or no intervention), Outcome 16 SIRS: probiotics vs other EN.
2.17. Analysis.

Comparison 2 Probiotics vs control (other EN or placebo or no intervention), Outcome 17 Organ failure: probiotics vs other EN.
2.18. Analysis.
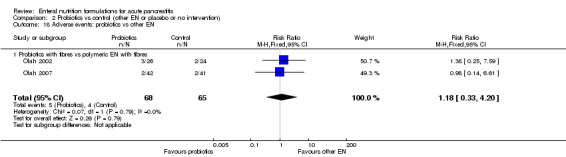
Comparison 2 Probiotics vs control (other EN or placebo or no intervention), Outcome 18 Adverse events: probiotics vs other EN.
One trial compared a polymeric formulation supplemented with probiotics and fibres versus a plain polymeric formulation (Plaudis 2012) and showed no significant effect on all‐cause mortality (RR 0.10, 95% CI 0.01 to 1.68) (Analysis 2.15) (P value 0.05), SIRS (RR 1.03, 95% CI 0.94 to 1.12) (Analysis 2.16) (P value 1.00) or organ failure (RR 0.90, 95% CI 0.79 to 1.03) (Analysis 2.17) (P value 0.11). Adverse events were not reported.
One trial assessed the use of polymeric EN supplemented with probiotics versus a plain polymeric formulation (Lata 2010). Investigators reported only on all‐cause mortality and showed no significant effect (RR not estimable, as no deaths occurred in both study groups) (Analysis 2.15).
One trial assessed a semi‐elemental formulation supplemented with probiotics versus a plain semi‐elemental formula (Wang 2013). Results showed no significant effect on all‐cause mortality (RR 0.33, 95% CI 0.04 to 3.07) (Analysis 2.15) (P value 0.36) nor on organ failure (RR 0.46, 95% CI 0.20 to 1.05) (Analysis 2.17) (P value 0.06).
Tests for subgroup differences were not statistically significant for all analysed outcomes.
All trials in this comparison included patients with predicted SAP, so the subgroup analysis stratified for patients with severe forms of disease corresponds to the main analyses.
Immunonutrition with probiotics and fibres versus control
Only one trial investigated the use of EN supplemented with immunonutrients, probiotics and fibres (Wang 2007). The trial consisted of three study groups comparing the latter mentioned type of EN versus a fibre‐enriched formulation, and versus no intervention. Therefore, we combined analysed outcomes of the fibre‐enriched and no intervention groups according to the recommendations provided in the Cochrane Handbook for Sytematic Reviews of Interventions (Higgins 2011). The trial included a total of 64 participants and reported on all‐cause mortality and length of hospital stay. Results for primary outcome measures are summarised in Table 3.
All‐cause mortality was not significantly different between groups. The RR was not estimable, as no deaths occurred in the intervention and control groups (0/21 vs 0/43, respectively). The quality of evidence was downgraded from high to very low because of high risk of bias and high imprecision of results in the included trial.
Length of hospital stay was significantly shorter in the intervention group (MD ‐5.20, 95% CI ‐8.73 to ‐1.67) (Analysis 3.1) (P value 0.01).
3.1. Analysis.

Comparison 3 Immunonutrition with probiotics and fibres vs control, Outcome 1 Length of hospital stay.
Subgroup analysis
We included only one trial in this comparison; therefore subgroup analysis was not possible. The trial assessed only participants with severe forms of the disease.
Semi‐elemental EN versus control
Only two trials with a total of 126 participants investigated the use of a semi‐elemental formulation, one comparing it with no nutritional support (Petrov 2013), and the other comparing it with a polymeric formula (Cravo 1989). Only Petrov 2013 reported on all‐cause mortality, and both trials reported on length of hospital stay. No information on the remaining outcomes could be obtained from both trials. Results for primary outcome measures are summarised in Table 4.
Use of semi‐elemental EN did not have a significant effect on all‐cause mortality. Risk ratio was not estimable, as no deaths occurred in both groups. Quality of evidence was downgraded from high to very low because of high risk of bias of included studies and imprecision of results.
Both trials reported on length of hospital stay; however, Petrov 2013 expressed values as medians and interquartile ranges, and Cravo 1989 expressed values as means and standard deviations. According to the recommendations of the Cochrane Handbook for Systematic Reviews of Interventions (Higgins 2011), it is not advisable to perform meta‐analysis in such cases. As reported by Cravo 1989, length of hospital stay was not significantly different between intervention and control groups (MD 0.30, 95% CI ‐0.82 to 1.42) (Analysis 4.1) (P value 0.61). The difference was not significant in the Petrov 2013 trial, with medians for intervention and control groups of 9 and 8.5 days, and interquartile ranges of 5 to 12 and 6 to 13 days, respectively.
4.1. Analysis.

Comparison 4 Semi‐elemental EN vs control (other EN or placebo or no intervention), Outcome 1 Length of hospital stay.
Subgroup analysis
It was not possible to perform subgroup analysis of trials comparing two different EN formulations because of the paucity of trials.
Cravo 1989 included patients with AP regardless of severity, and Petrov 2013 included only patients with mild forms; therefore subgroup analysis on participants with SAP was not possible.
Fibre‐enriched EN versus control
Two trials comparing EN enriched with fibres with a total of 103 participants were included in the analysis. One trial compared it with a polymeric formulation (Plaudis 2012), and the other with no intervention (Wang 2007). Results for primary outcome measures are summarised in Table 5. Quality of evidence for outcomes of all‐cause mortality, SIRS and organ failure were downgraded from high to low risk of bias because of high risk of bias of included studies, and because of the relatively small numbers of included participants and events.
Primary outcomes
All‐cause mortality
Both trials (Plaudis 2012; Wang 2007) reported a total of 1/47 and 5/56 deaths in the fibre‐enriched EN and control groups. The difference was not significant (RR 0.23, 95% CI 0.03 to 1.84) (Analysis 5.1).
5.1. Analysis.

Comparison 5 Fibre‐enriched EN vs control, Outcome 1 All‐cause mortality.
Systemic inflammatory response syndrome
Plaudis 2012 showed no significant difference in the occurrence of SIRS between groups (RR 1.03, 95% CI 0.94 to 1.13) (Analysis 5.2) (P value 1.00). SIRS occurred in 28/28 participants in the fibre‐enriched EN group and in 31/32 participants in the control group.
5.2. Analysis.

Comparison 5 Fibre‐enriched EN vs control, Outcome 2 SIRS.
Organ failure
Use of fibre‐enriched EN did not reach statistical significance in decreasing the occurrence of organ failure compared with control as reported by Plaudis 2012 (RR 0.86, 95% CI 0.73 to 1.01) (Analysis 5.3). However, when performed with Fisher's exact test, the difference was significant (P value 0.04). Organ failure occurred in 24/28 and 32/32 participants in the fibre‐enriched EN and control groups, respectively.
5.3. Analysis.

Comparison 5 Fibre‐enriched EN vs control, Outcome 3 Organ failure.
Adverse events
None of the trials reported on adverse events.
Secondary outcomes
Local septic complications
This outcome was reported only by Plaudis 2012. Two of 28 participants in the fibre‐enriched EN group and 3/32 in the control group developed local septic complications. No significant differences between groups were detected (RR 0.76, 95% CI 0.14 to 4.24) (Analysis 5.4) (P value 1.00).
5.4. Analysis.
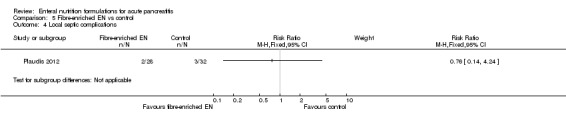
Comparison 5 Fibre‐enriched EN vs control, Outcome 4 Local septic complications.
Other local complications
The occurrence of other local complications as reported by Plaudis 2012 was significantly lower in the fibre‐enriched EN group than in the control group (RR 0.52, 95% CI 0.32 to 0.87) (Analysis 5.5) (P value 0.008), occurring in 11/28 versus 24/32 participants, respectively.
5.5. Analysis.

Comparison 5 Fibre‐enriched EN vs control, Outcome 5 Other local complications.
Other infections
Fibre‐enriched EN had no significant effect on the occurrence of other infections (RR 0.33, 95% CI 0.07 to 1.45) (Analysis 5.6) (P value 0.15). Infections were reported in 2/28 and 7/32 participants in the fibre‐enriched EN and control groups.
5.6. Analysis.
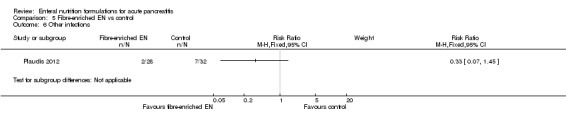
Comparison 5 Fibre‐enriched EN vs control, Outcome 6 Other infections.
C‐reactive protein concentrations
Plaudis 2012 reported on serum CRP concentrations; however study authors were unable to provide standard deviations for the control group for technical reasons, so the analysis could not be carried out. Wang 2007 did not report on CRP levels.
Length of hospital stay
Length of hospital stay was reported by both trials (Plaudis 2012; Wang 2007) and was significantly shorter in the fibre‐enriched EN group than in the control group (MD ‐9.28, 95% CI ‐13.21 to ‐5.35, I² = 18%) (Analysis 5.7).
5.7. Analysis.

Comparison 5 Fibre‐enriched EN vs control, Outcome 7 Length of hospital stay.
Quality of life
None of the trials reported on this outcome.
Subgroup analyses
Subgroup analysis of trials comparing two different EN formulations was not possible, as only one trial (Plaudis 2012) compared fibre‐enriched EN versus a polymeric formulation. All‐cause mortality in this trial was not significantly affected (RR 0.23, 95% CI 0.03 to 1.84) (P value 0.20). Analyses on SIRS and organ failure correspond to the previously reported Analysis 5.2 and Analysis 5.3, and adverse events were not reported.
Both trials included patients with SAP according to the specified criteria; therefore analysis based on severe forms of disease corresponds to the main analysis.
Other subgroup analyses
Trials comparing enteral nutrition versus placebo
None of the trials used placebo as a comparator versus an EN preparation. All trials performed only comparisons between different EN formulations, or comparisons between EN and no intervention. If placebo was used, it was given as a supplement to a certain EN formulation to achieve blinding in trials assessing the supplementation of, for example, probiotics to EN.
Trials comparing enteral nutrition versus no intervention
Four trials assessed the use of any type of EN versus no intervention (Lu 2008; Petrov 2013; Poropat 2012; Wang 2007). All four trials reported on all‐cause mortality, which was significantly decreased compared with participants who received no nutritional support (RR 0.50, 95% CI 0.29 to 0.86, I² = 0%) (Analysis 6.1). Other primary outcomes were reported only by Poropat 2012 and showed no significant differences in occurrence of SIRS (RR 0.94, 95% CI 0.70 to 1.26) (P value 0.78), organ failure (RR 0.81, 95% CI 0.52 to 1.26) (P value 0.44) or adverse events (RR 9.00, 95% CI 0.49 to 165.14) (P value 0.12) (see: Table 6). Quality of evidence for all‐cause mortality was downgraded to low, and for other primary outcomes to very low, because of high risk of bias and imprecision of results.
6.1. Analysis.

Comparison 6 Other subgroup analyses, Outcome 1 All‐cause mortality stratified for trials assessing EN compared with no intervention.
Nasojejunal compared with nasogastric route of administration
Two trials did not report on the route of EN administration (Cravo 1989; Huang 2008), and in one trial EN was administered orally (Plaudis 2012). Only one trial used a nasogastric feeding tube (Petrov 2013) for which results were already reported, and all other trials administered EN through a nasojejunal tube. We did not perform subgroup analysis because of the paucity of trials.
Early (≤ 48 hours) compared with late (> 48 hours) start of administration
Authors did not state the start time of EN administration in one trial (Lata 2010), and two trials initiated enteral feeding within 72 hours of admission (Besselink 2008; Huang 2008). Among the remaining trials, only one started EN after 48 hours of admission (Cravo 1989), and this trial did not report on any of the review's primary outcomes. We did not perform subgroup analysis, as comparison of trials according to start time of enteral feeding was not possible.
Oral refeeding started within seven days after admission compared with oral refeeding started more than seven days after admission
We did not perform this subgroup analysis because most trials did not address this issue, and when trials did report time of oral refeeding, it was usually based on the clinical course of the disease and the presence of abdominal symptoms among participants, not on a specific time frame.
Trials at low risk of bias compared with trials at high risk of bias
This subgroup analysis could not be performed as all included trials were judged as having high risk of bias.
Post hoc sensitivity analysis
Results of the post hoc sensitivity analysis based on exclusion of patients from Besselink 2008 showed a significant reduction in all‐cause mortality in the probiotics group (RR 0.30, 95% CI 0.10 to 0.84, I² = 0%) (Analysis 7.1), as well as in organ failure (RR 0.74, 95% CI 0.59 to 0.92, I² = 83%) (Analysis 7.2) and local septic complications (RR 0.40, 95% CI 0.22 to 0.72, I² = 0%) (Analysis 7.3). No significant difference was shown for other local complications (RR 0.96, 95% CI 0.65 to 1.41, I² = 0%) (Analysis 7.4) or for length of hospital stay (MD ‐4.87, 95% CI ‐10.07 to 0.33, I² = 0%) (Analysis 7.5). Other outcomes were not reported by Besselink 2008.
7.1. Analysis.
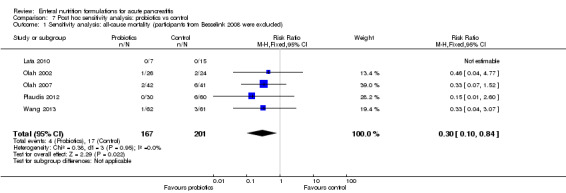
Comparison 7 Post hoc sensitivity analysis: probiotics vs control, Outcome 1 Sensitivity analysis: all‐cause mortality (participants from Besselink 2008 were excluded).
7.2. Analysis.

Comparison 7 Post hoc sensitivity analysis: probiotics vs control, Outcome 2 Sensitivity analysis: organ failure (participants from Besselink 2008 were excluded).
7.3. Analysis.

Comparison 7 Post hoc sensitivity analysis: probiotics vs control, Outcome 3 Sensitivity analysis: local septic complications (participants from Besselink 2008 were excluded).
7.4. Analysis.

Comparison 7 Post hoc sensitivity analysis: probiotics vs control, Outcome 4 Sensitivity analysis: other local complications (participants from Besselink 2008 were excluded).
7.5. Analysis.

Comparison 7 Post hoc sensitivity analysis: probiotics vs control, Outcome 5 Sensitivity analysis: length of hospital stay (participants from Besselink 2008 were excluded).
Discussion
Summary of main results
This systematic review contains 15 trials with a total of 1376 participants investigating different types of enteral nutrition (EN) formulations for the treatment of patients with acute pancreatitis (AP). To address the diversity of available EN formulations, we constructed five separate analyses comparing a specific formulation versus control, consisting of another type of EN, placebo or no intervention. These five analyses refer to immunonutrition; EN supplemented with probiotics; formulations supplemented with immunonutrients, probiotics and fibres; semi‐elemental formulations; and fibre‐enriched EN. All trials were assessed as having high risk of bias.
Immunonutrition compared with control showed a reduction in all‐cause mortality, but no such improvement was confirmed for other outcomes, which were reported by fewer trials. When we stratified analyses on primary outcomes only for studies comparing immunonutrition versus other EN formulations, we could not confirm this effect. Therefore, benefit derived from the addition of immunomodulatory agents to any type of EN is questionable. These findings are based on low‐quality evidence, which was downgraded by one point for high risk of bias of included trials, and by one point for imprecision of results. Subgroup analysis stratified for patients with severe AP could not confirm a significant difference between immunonutrition and control regarding all‐cause mortality and occurrence of systemic inflammatory response syndrome (SIRS). Immunonutrition generally was well tolerated, with few mild adverse events reported. One isolated case of bowel ischaemia developed in the Hallay 2001 trial, affecting a participant in the control group who was receiving fibre‐enriched polymeric EN; this was judged by review authors as a serious adverse event. Sensitivity analyses performed according to 'worst‐best case' and 'best‐worst case' scenarios for primary outcomes yielded similar results, most likely because a fairly small number of participants were lost to follow‐up.
Evidence of an effect on primary outcomes when EN is supplemented with probiotics with or without fibres is inconclusive and has been graded as having low to very low quality based on high risk of bias, rather small numbers of participants and events included and inconsistency of results. We noted a reduction in other infections, but numbers of local septic complications were similar in both groups. The frequency of adverse events was similar in the two groups; however, we were not able to include data from Besselink 2008 because it was not clear whether one participant experienced more than one reported adverse event. The same participant could, for example, have had abdominal pain and diarrhoea due to bowel ischaemia, but all were reported separately. In this trial, 9/153 participants in the probiotic group developed bowel ischaemia, and seven died as a result of this. This number was significantly higher than that reported in the trial's control group, which received fibre‐enriched polymeric EN without probiotics, and in which none of the participants developed bowel ischaemia. As a consequence, trial investigators reported a significantly higher death rate in the group treated with probiotics, addressing a warning for use of probiotics in the treatment of patients with AP. However, the Besselink 2008 trial had been criticised for design issues and flaws, and we raise concern regarding the detected baseline imbalance between study groups, with a significantly higher number of patients with organ failure at baseline included in the probiotics group. Nevertheless, because of the rather small numbers of participants and adverse events reported in this comparison, and because significant heterogeneity was detected between studies included in assessment of all‐cause mortality, the review authors would like to emphasise that safety concerns regarding use of probiotics in patients with AP do exist, and that routine supplementation of EN with probiotics is not backed up by currently available evidence. We undertook analysis of serum C‐reactive protein (CRP) concentrations measured on the third day after admission, which is a generally accepted point in time by which CRP reaches its highest levels. These high values are not usually a consequence of infective complications but instead are due to a non‐septic inflammatory response typical among patients with AP. Infectious complications such as infected pancreatic necrosis are more common in later phases of the disease, usually during the second week, and are characterised by a secondary rise in CRP levels. C‐reactive protein levels were higher in the probiotics group, but this result should be interpreted with caution, as it is based on reports of only two trials. Furthermore, this finding could not be explained by the occurrence of SIRS, as this was not significantly different between groups. When analysing last available follow‐up values for CRP concentrations, we could not confirm a conclusive effect of probiotics on CRP values. Other analysed secondary outcomes were similar. Subgroup analysis of specific formulations of EN supplemented with probiotics compared with other specific EN formulas did not confirm any specific advantage or disadvantage of the intervention for primary outcomes.
Sensitivity analyses for missing data based on 'worst‐best case' and 'best‐worst case' scenarios suggest that the numbers of participants lost to follow‐up were quite large, and this could have potentially influenced outcomes. As the 'worst‐best case' scenario resulted in a higher incidence of mortality and SIRS with no difference in organ failure, while the 'best‐worst case' scenario resulted in a lower incidence of organ failure with no differences in mortality and SIRS between probiotics and control, results of these extreme case scenarios should be taken cautiously because they may not be realistic.
In the light of previously discussed inconsistencies among results and observed heterogeneity, as well as design issues regarding the Besselink 2008 trial, we performed a post hoc sensitivity analysis by excluding participants from Besselink 2008 for all respective outcomes. Results of these analyses show that probiotics decreased all‐cause mortality, occurrence of organ failure and local septic complications but had no impact on other local complications and length of hospitalisation. This analysis may provide justification for further investigation of probiotics as EN supplements for patients with AP to potentially determine their efficacy or potential harmfulness.
Only one study evaluated the use of a fibre‐enriched polymeric EN supplemented with both immunonutrients and probiotics compared with a fibre‐enriched and plain polymeric EN, reporting no deaths in all three groups, as well as shorter hospital stay. However, results from only one study with very wide confidence intervals represent very low quality of evidence with no possibility of a conclusion regarding the effect of the intervention. Two studies evaluated the use of semi‐elemental formulations compared with polymeric and no nutritional support and did not confirm any effect on all‐cause mortality nor on length of hospital stay. As the quality of evidence was very low, we cannot be confident that this intervention had any effect on assessed outcomes. Two trials were included in the comparison of fibre‐enriched EN versus polymeric EN, showing a reduction in length of hospital stay; one trial reported reduced numbers of other local complications. Other reported outcomes were similar in the two groups. These findings are also based on very small numbers of included participants and reported events, thus they should be understood as very imprecise and derived from trials with high risk of bias. In this way, we downgraded the quality of evidence from high to very low.
We performed a subgroup analysis on trials comparing EN versus no intervention with the intention of assessing whether use of any type of EN formulation has any beneficial or harmful effect compared with no nutritional support at all. Our results, which were based on a total of 511 participants, suggest that EN decreases all‐cause mortality compared with no nutritional support, thus supporting the use of EN in patients with AP. However, very few cases of all‐cause mortality were reported among the included participants, and only one trial reported on SIRS, resulting in low to very low quality of available evidence. Although clinical logic and experience may suggest the usefulness and benefit of EN over no nutritional intervention in patients with AP, such assertions and opinions cannot currently be backed up by solid evidence.
Overall completeness and applicability of evidence
Included studies could not be pooled in a unique analysis because this would not be consistent with the purpose of this review, and because different EN formulations were assessed by investigators. Most trials included patients with AP of any severity, although some trials examined only severe cases and one trial (Petrov 2013) assessed exclusively mild forms of AP. In most trials, disease severity and local and systemic complications were defined according to the previous version of the Atlanta criteria (Bradley 1993). Poropat 2012 used the new revised Atlanta criteria from 2012 (Banks 2012); Huang 2008 defined severity according to the Bangkok 2002 criteria (Toouli 2002), and Wang 2007 according to the Chinese acute pancreatitis treatment guidelines (draft) (CMA 2004), so these differences should be taken into account.
Regarding comparisons of immunonutrition versus control and probiotics versus control, most included trials had similar endpoints and reported on outcomes of interest. However, the remaining three comparisons involved only one or two trials, which reported on very few outcomes, so overall completeness and applicability of the evidence are very limited.
Quality of the evidence
The overall quality of the evidence is low or very low. One of the main limitations of this systematic review is the diversity of interventions studied across trials, which explains why specific analyses had to be divided to fulfil the clinical meaning and aspects of use of different EN formulations for AP, as well as to satisfy the purposes of this review. Therefore, specific analyses included few trials with rather limited numbers of participants. We explored statistical heterogeneity qualitatively and quantitatively by using Chi2 tests and I² values, respectively (Higgins 2003). When a meta‐analysis included a small number of trials or trials with small sample sizes, the Chi2 test was seen to have low power, meaning that a statistically significant result may indicate a problem with heterogeneity, but lack of a statistically significant result does not exclude heterogeneity. This is why we applied both fixed‐effect and random‐effects models, and determined statistical significance for heterogeneity at a P value of 0.10. All included trials are at high risk of bias; therefore results of these studies should be interpreted with caution.
Potential biases in the review process
This systematic review was performed according to the recommendations of The Cochrane Collaboration. We strongly believe that the search strategies developed, as well as the predefined inclusion and exclusion criteria used, ensured unbiased selection of studies of interest. We performed searches of literature until the end of August 2013 (i.e. around six months before review submission), and review authors are unaware of newly published trials of substantial power that would drastically and significantly affect outcome estimates. Besides trials that reported in English, two trials that reported exclusively in Chinese and one trial that reported in Czech were included in this review, and three trials published in Chinese were excluded on the basis of study selection criteria. We also included unpublished information from one trial (Poropat 2012). GP and VG independently extracted data, assessed risk of bias and graded evidence quality. VG as an author of this systematic review was not otherwise involved in the planning, conduct, data analysis or writing of the abstract, nor in any other aspect of the Poropat 2012 trial. We contacted primary and corresponding authors of all trials to request additional information. Authors of seven included trials replied, providing additional information on trial design and conduct, missing data and other information of interest. One study (Pearce 2006) did not address the extent of the sponsor's involvement in the trial. Another trial (Olah 2007) did not provide the standard deviation (SD) for length of hospital stay, so we imputed values as an average of other trials included in the analysis. Lu 2008 presented data on length of hospital stay as means with standard errors, which we converted to SDs. Petrov 2013 reported length of hospital stay as medians with interquartile ranges, which we did not include in the analysis because of the possibility of skewed data.
All of the 15 trials included in our systematic review had been judged to have high risk of bias, and such trials are known to influence intervention effect estimates in such a way as to overestimate intervention effects. Five trials (33%) reported adequate random sequence generation, three (20%) had adequate allocation concealment, blinding was assessed as adequate in only two trials (13%), ten trials had low risk of attrition bias (67%), nine trials (60%) adequately reported on all prespecified and expected outcomes and eleven trials (73%) were assessed as having low risk of other potential sources of bias. Therefore, results and estimations of the intervention effect should be interpreted cautiously because systematic error is possible. Moreover, publication bias could not be assessed because of the limited number of trials included in the specific analyses of the review.
As a result of the diversity of interventions investigated in the included trials, we performed a fairly large number of subgroup analyses. This approach can easily lead to increased random error and spuriously significant results. We have to acknowledge that certain subgroup analyses intended to compare exclusively specific types of EN were insufficiently powered to reliably detect treatment effects.
Agreements and disagreements with other studies or reviews
We were able to identify only one meta‐analysis addressing the issue of use of different EN formulations in patients with AP (Petrov 2009). It included 20 randomised controlled trials with a total of 1070 participants. The review consisted of four separate analyses comparing semi‐elemental versus polymeric formulations, fibre‐enriched EN supplemented with probiotics versus fibre‐enriched EN, fibre‐enriched EN supplemented with immunonutrition versus fibre‐enriched EN and other studies that were not included in the meta‐analysis. However, it has to be stated that most of these comparisons were based on indirect meta‐analyses of groups of participants included in trials comparing EN versus TPN, in which TPN was used as a reference treatment. Furthermore, the review included certain trials in which the same group of participants or at least some participants were treated with a combination of EN and PN. Results could not confirm significant differences in effect of a specific EN formulation over another regarding infectious complications and mortality, nor regarding tolerance and safety of enteral feeding. Results of this review regarding efficacy of specific EN formulations are basically in agreement with the results that we reported; however, our results represent a contemporary and comprehensive systematic review based on reliable tools for assessing risk of bias in each included study as recommended by The Cochrane Collaboration. Furthermore, on the basis of relatively recent findings, our systematic review raises important concerns regarding the safety of EN supplemented with probiotics in the treatment of patients with AP .
Authors' conclusions
Implications for practice.
The findings of our systematic review are based on evidence of low to very low quality and show no beneficial effects of one specific enteral nutrition formulation over another. Immunonutrition seems generally well tolerated and safe on the basis of evidence of low to very low quality. Our results showed a reduction in all‐cause mortality, which is based on evidence of low quality. Routine use of probiotic supplements to enteral nutrition should be avoided on the basis of current available evidence because of safety concerns. We have found evidence of low or very low quality for the effects of nutrition over no nutritional support in reduction of all‐cause mortality.
Implications for research.
Inconsistencies among results, large heterogeneity and high risk of bias in trials assessing the use of probiotics suggest that further well‐designed, well‐conducted and adequately powered randomised trials are needed to investigate the efficacy and potential harms of immunonutrition and supplementation of enteral nutrition with probiotics. Lack of trials reporting on other types of enteral nutrition assessed and lack of firm evidence regarding their effects suggest that additional randomised clinical trials are needed. Future trials should adopt uniform criteria for determination of disease severity. Outcomes that need to be addressed include mortality, transient and persistent organ failure, systemic inflammatory response syndrome (SIRS), local septic complications, other local complications and adverse events.
Acknowledgements
We show our immense gratitude to the whole team of the Cochrane Upper Gastrointestinal and Pancreatic Disease Group, with special thanks to Karin Dearness and Racquel Simpson for their efforts, wonderful communication, help and contributions throughout this entire process. Great thanks to Yuan‐Yuan for assistance provided regarding articles published in Chinese. Thanks to the authors of trials ‐ Dr Marc Besselink, Dr Marilia Cravo, Dr Judit Hallay, Dr Atilla Olah, Dr Callum Pearce and Dr Haralds Plaudis ‐ who kindly replied to our emails and provided additional information. Last, but not least, thanks to all patients involved in the trials and all investigators who conducted them.
Appendices
Appendix 1. CENTRAL search strategy
Pancreatitis, Acute Necrotizing/
Pancreatitis/et [Etiology]
(acute adj2 pancrea*).tw.
(necro* adj2 pancrea*).tw.
(inflam* adj3 pancrea*).tw.
((interstitial or edema*) adj2 pancrea*).tw.
or/1‐6
Food, Formulated/
(elemental adj2 diet*).tw.
(formulat* adj2 (food* or nutrition* or feed*)).tw.
Enteral Nutrition/
((enteral or enteric) adj2 (feed* or nutrition*)).tw.
(nasojejunal adj2 (feed* or nutrition*)).tw.
(tube adj feed*).tw.
(polymeric adj3 mixture*).tw.
polymeric feed*.tw.
oligomeric feed*.tw.
(oligomeric adj3 mixture*).tw.
Nutritional Support/
Glutamine/
Arginine/
Fatty Acids, Omega‐3/
Probiotics/
prebiotic.tw.
Dietary Fiber/
((fibre or fiber) adj enrich* adj diet*).tw.
semi‐elemental.tw.
or/8‐27
7 and 28
Appendix 2. MEDLINE search strategy
Pancreatitis, Acute Necrotizing/
Pancreatitis/et [Etiology]
(acute adj2 pancrea*).tw.
(necro* adj2 pancrea*).tw.
(inflam* adj3 pancrea*).tw.
((interstitial or edema*) adj2 pancrea*).tw.
or/1‐6
Food, Formulated/
(elemental adj2 diet*).tw.
(formulat* adj2 (food* or nutrition* or feed*)).tw.
Enteral Nutrition/
((enteral or enteric) adj2 (feed* or nutrition*)).tw.
(nasojejunal adj2 (feed* or nutrition*)).tw.
(tube adj feed*).tw.
(polymeric adj3 mixture*).tw.
polymeric feed*.tw.
oligomeric feed*.tw.
(oligomeric adj3 mixture*).tw.
Nutritional Support/
Glutamine/
Arginine/
Fatty Acids, Omega‐3/
Probiotics/
prebiotic.tw.
Dietary Fiber/
((fibre or fiber) adj enrich* adj diet*).tw.
semi‐elemental.tw.
or/8‐27
7 and 28
randomized controlled trial.pt.
controlled clinical trial.pt.
randomized.ab.
placebo.ab.
drug therapy.fs.
randomly.ab.
trial.ab.
groups.ab.
or/30‐37
exp animals/ not humans.sh.
38 not 39
29 and 40
Appendix 3. EMBASE search strategy
acute pancreatitis/
acute hemorrhagic pancreatitis/
pancreatitis/et [Etiology]
(acute adj2 pancrea*).tw.
(necro* adj2 pancrea*).tw.
(inflam* adj3 pancrea*).tw.
((interstitial or edema*) adj2 pancrea*).tw.
or/1‐7
elemental diet/
(elemental adj2 diet*).tw.
(formulat* adj2 (food* or nutrition* or feed*)).tw.
enteric feeding/
((enteral or enteric) adj2 (feed* or nutrition*)).tw.
nose feeding/
(nasojejunal adj2 (feed* or nutrition*)).tw.
(tube adj feed*).tw.
(polymeric adj3 mixture*).tw.
polymeric feed*.tw.
oligomeric feed*.tw.
(oligomeric adj3 mixtures).tw.
*nutritional support/
glutamine/
arginine/
omega 3 fatty acid/
probiotic agent/
prebiotic agent/
dietary fiber/
((fibre or fiber) adj enrich* adj diet*).tw.
semi‐elemental.tw.
or/9‐29
8 and 30
random:.tw. or placebo:.mp. or double‐blind:.tw.
31 and 32
Appendix 4. Science Citation Index‐Expanded search strategy
| # 32 | #31 AND #28 Databases=SCI‐EXPANDED, CPCI‐S Timespan=All Years Lemmatization=On |
| # 31 | #30 OR #29 Databases=SCI‐EXPANDED, CPCI‐S Timespan=All Years Lemmatization=On |
| # 30 | Topic=(placebo* OR random* OR trial OR trials) Databases=SCI‐EXPANDED, CPCI‐S Timespan=All Years Lemmatization=On |
| # 29 | Topic=((singl* OR doubl* OR trebl* OR tripl*)) AND Topic=((blind* OR mask*)) Databases=SCI‐EXPANDED, CPCI‐S Timespan=All Years Lemmatization=On |
| # 28 | #27 AND #6 Databases=SCI‐EXPANDED, CPCI‐S Timespan=All Years Lemmatization=On |
| # 27 | #26 OR #25 OR #24 OR #23 OR #22 OR #21 OR #20 OR #19 OR #18 OR #17 OR #16 OR #15 OR #14 OR #13 OR #12 OR #11 OR #10 OR #9 OR #8 OR #7 Databases=SCI‐EXPANDED, CPCI‐S Timespan=All Years Lemmatization=On |
| # 26 | Topic=(semi‐elemental) Databases=SCI‐EXPANDED, CPCI‐S Timespan=All Years Lemmatization=On |
| # 25 | Topic=(((fibre or fiber) enrich* diet*)) Databases=SCI‐EXPANDED, CPCI‐S Timespan=All Years Lemmatization=On |
| # 24 | Topic=(Diet* Fiber) Databases=SCI‐EXPANDED, CPCI‐S Timespan=All Years Lemmatization=On |
| # 23 | Topic=(Probiotics) Databases=SCI‐EXPANDED, CPCI‐S Timespan=All Years Lemmatization=On |
| # 22 | Topic=(Omega‐3 Fatty Acids) Databases=SCI‐EXPANDED, CPCI‐S Timespan=All Years Lemmatization=On |
| # 21 | Topic=(Arginine) Databases=SCI‐EXPANDED, CPCI‐S Timespan=All Years Lemmatization=On |
| # 20 | Topic=(Glutamine) Databases=SCI‐EXPANDED, CPCI‐S Timespan=All Years Lemmatization=On |
| # 19 | Topic=(Nutritional Support) Databases=SCI‐EXPANDED, CPCI‐S Timespan=All Years Lemmatization=On |
| # 18 | Topic=(oligomeric mixture*) Databases=SCI‐EXPANDED, CPCI‐S Timespan=All Years Lemmatization=On |
| # 17 | Topic=(oligomeric feed*) Databases=SCI‐EXPANDED, CPCI‐S Timespan=All Years Lemmatization=On |
| # 16 | Topic=(polymeric feed*) Databases=SCI‐EXPANDED, CPCI‐S Timespan=All Years Lemmatization=On |
| # 15 | Topic=(polymeric mixture*) Databases=SCI‐EXPANDED, CPCI‐S Timespan=All Years Lemmatization=On |
| # 14 | Topic=(tube feed*) Databases=SCI‐EXPANDED, CPCI‐S Timespan=All Years Lemmatization=On |
| # 13 | Topic=(nasojejunal nutrition*) Databases=SCI‐EXPANDED, CPCI‐S Timespan=All Years Lemmatization=On |
| # 12 | Topic=(nasojejunal feed*) Databases=SCI‐EXPANDED, CPCI‐S Timespan=All Years Lemmatization=On |
| # 11 | Topic=(((enteral or enteric) NEAR (feed* or nutrition*))) Databases=SCI‐EXPANDED, CPCI‐S Timespan=All Years Lemmatization=On |
| # 10 | Topic=(Enteral Nutrition) Databases=SCI‐EXPANDED, CPCI‐S Timespan=All Years Lemmatization=On |
| # 9 | Topic=((formulat* NEAR (food* or nutrition* or feed*))) Databases=SCI‐EXPANDED, CPCI‐S Timespan=All Years Lemmatization=On |
| # 8 | Topic=(elemental diet) Databases=SCI‐EXPANDED, CPCI‐S Timespan=All Years Lemmatization=On |
| # 7 | Topic=(Formulated Food) Databases=SCI‐EXPANDED, CPCI‐S Timespan=All Years Lemmatization=On |
| # 6 | #5 OR #4 OR #3 OR #2 OR #1 Databases=SCI‐EXPANDED, CPCI‐S Timespan=All Years Lemmatization=On |
| # 5 | Topic=(((interstitial or edema*) NEAR pancrea*)) Databases=SCI‐EXPANDED, CPCI‐S Timespan=All Years Lemmatization=On |
| # 4 | Topic=((inflam* NEAR pancrea*)) Databases=SCI‐EXPANDED, CPCI‐S Timespan=All Years Lemmatization=On |
| # 3 | Topic=((necro* NEAR pancrea*)) Databases=SCI‐EXPANDED, CPCI‐S Timespan=All Years Lemmatization=On |
| # 2 | Topic=(acute hemorrhagic pancreatitis) Databases=SCI‐EXPANDED, CPCI‐S Timespan=All Years Lemmatization=On |
| # 1 | Topic=(acute pancreatitis) Databases=SCI‐EXPANDED, CPCI‐S Timespan=All Years Lemmatization=On |
Data and analyses
Comparison 1. Immunonutrition vs control (other EN or placebo or no intervention).
| Outcome or subgroup title | No. of studies | No. of participants | Statistical method | Effect size |
|---|---|---|---|---|
| 1 All‐cause mortality | 6 | 520 | Risk Ratio (M‐H, Fixed, 95% CI) | 0.49 [0.29, 0.80] |
| 2 SIRS | 3 | 278 | Risk Ratio (M‐H, Fixed, 95% CI) | 1.00 [0.76, 1.31] |
| 3 Organ failure | 4 | 290 | Risk Ratio (M‐H, Fixed, 95% CI) | 0.75 [0.49, 1.13] |
| 4 Adverse events | 4 | 294 | Risk Ratio (M‐H, Fixed, 95% CI) | 1.32 [0.78, 2.24] |
| 5 Local septic complications | 1 | Risk Ratio (M‐H, Fixed, 95% CI) | Subtotals only | |
| 6 Other local complications | 2 | 242 | Risk Ratio (M‐H, Fixed, 95% CI) | 1.18 [0.89, 1.57] |
| 7 Other infections | 2 | 44 | Risk Ratio (M‐H, Fixed, 95% CI) | 0.56 [0.24, 1.28] |
| 8 CRP: measured on day 3 | 2 | 242 | Mean Difference (IV, Fixed, 95% CI) | 1.98 [‐21.17, 25.13] |
| 9 CRP: last available follow‐up | 3 | 258 | Mean Difference (IV, Fixed, 95% CI) | 16.30 [‐3.03, 35.63] |
| 10 Length of hospital stay | 5 | 504 | Mean Difference (IV, Fixed, 95% CI) | 0.53 [‐1.19, 2.24] |
| 11 All‐cause mortality: worst‐best and best‐worst case scenarios | 6 | Risk Ratio (M‐H, Fixed, 95% CI) | Subtotals only | |
| 11.1 Worst‐best case scenario | 6 | 520 | Risk Ratio (M‐H, Fixed, 95% CI) | 0.53 [0.33, 0.87] |
| 11.2 Best‐worst case scenario | 6 | 520 | Risk Ratio (M‐H, Fixed, 95% CI) | 0.46 [0.28, 0.76] |
| 12 SIRS: worst‐best case and best‐worst case scenarios | 3 | Risk Ratio (M‐H, Fixed, 95% CI) | Subtotals only | |
| 12.1 Worst‐best case scenario | 3 | 278 | Risk Ratio (M‐H, Fixed, 95% CI) | 1.03 [0.79, 1.35] |
| 12.2 Best‐worst case scenario | 3 | 278 | Risk Ratio (M‐H, Fixed, 95% CI) | 0.96 [0.74, 1.26] |
| 13 Organ failure: worst‐best case and best‐worst case scenarios | 4 | Risk Ratio (M‐H, Fixed, 95% CI) | Subtotals only | |
| 13.1 Worst‐best case scenario | 4 | 290 | Risk Ratio (M‐H, Fixed, 95% CI) | 0.80 [0.53, 1.20] |
| 13.2 Best‐worst case scenario | 4 | 290 | Risk Ratio (M‐H, Fixed, 95% CI) | 0.73 [0.48, 1.10] |
| 14 Adverse events: worst‐best case and best‐worst case scenarios | 4 | Risk Ratio (M‐H, Fixed, 95% CI) | Subtotals only | |
| 14.1 Worst‐best case scenario | 4 | 294 | Risk Ratio (M‐H, Fixed, 95% CI) | 1.46 [0.86, 2.47] |
| 14.2 Best‐worst case scenario | 4 | 294 | Risk Ratio (M‐H, Fixed, 95% CI) | 1.17 [0.70, 1.96] |
| 15 All‐cause mortality: immunonutrition vs other EN | 4 | 108 | Risk Ratio (M‐H, Fixed, 95% CI) | 0.43 [0.13, 1.46] |
| 15.1 Immunonutrition vs polymeric EN | 3 | 92 | Risk Ratio (M‐H, Fixed, 95% CI) | 0.29 [0.05, 1.67] |
| 15.2 Immunonutrition with fibres vs polymeric EN with fibres | 1 | 16 | Risk Ratio (M‐H, Fixed, 95% CI) | 0.78 [0.14, 4.23] |
| 16 Organ failure: immunonutrition vs other EN | 3 | 76 | Risk Ratio (M‐H, Fixed, 95% CI) | 0.38 [0.10, 1.47] |
| 16.1 Immunonutrition vs polymeric EN | 2 | 60 | Risk Ratio (M‐H, Fixed, 95% CI) | 0.2 [0.01, 3.82] |
| 16.2 Immunonutrition with fibres vs polymeric EN with fibres | 1 | 16 | Risk Ratio (M‐H, Fixed, 95% CI) | 0.52 [0.12, 2.30] |
| 17 Adverse events: immunonutrition vs other EN | 3 | 80 | Risk Ratio (M‐H, Fixed, 95% CI) | 1.05 [0.62, 1.79] |
| 17.1 Immunonutrition vs polymeric EN | 2 | 64 | Risk Ratio (M‐H, Fixed, 95% CI) | 1.16 [0.67, 1.98] |
| 17.2 Immunonutrition with fibres vs polymeric EN with fibres | 1 | 16 | Risk Ratio (M‐H, Fixed, 95% CI) | 0.27 [0.01, 5.70] |
| 18 SIRS: immunonutrition vs other EN | 2 | 64 | Risk Ratio (M‐H, Fixed, 95% CI) | 1.51 [0.68, 3.36] |
| 18.1 Immunonutrition vs polymeric EN | 2 | 64 | Risk Ratio (M‐H, Fixed, 95% CI) | 1.51 [0.68, 3.36] |
| 19 All‐cause mortality: participants with SAP | 2 | 90 | Risk Ratio (M‐H, Fixed, 95% CI) | 0.77 [0.42, 1.40] |
| 20 SIRS: participants with SAP | 2 | 90 | Risk Ratio (M‐H, Fixed, 95% CI) | 1.03 [0.80, 1.34] |
Comparison 2. Probiotics vs control (other EN or placebo or no intervention).
| Outcome or subgroup title | No. of studies | No. of participants | Statistical method | Effect size |
|---|---|---|---|---|
| 1 All‐cause mortality | 6 | 666 | Risk Ratio (M‐H, Fixed, 95% CI) | 1.13 [0.66, 1.91] |
| 2 SIRS | 3 | 223 | Risk Ratio (M‐H, Fixed, 95% CI) | 1.07 [0.90, 1.27] |
| 3 Organ failure | 5 | 644 | Risk Ratio (M‐H, Fixed, 95% CI) | 0.84 [0.67, 1.04] |
| 4 Adverse events | 2 | 133 | Risk Ratio (M‐H, Fixed, 95% CI) | 1.18 [0.33, 4.20] |
| 5 Local septic complications | 6 | 666 | Risk Ratio (M‐H, Fixed, 95% CI) | 0.69 [0.46, 1.05] |
| 6 Other local complications | 3 | 431 | Risk Ratio (M‐H, Fixed, 95% CI) | 1.13 [0.86, 1.49] |
| 7 Other infections | 3 | 223 | Risk Ratio (M‐H, Fixed, 95% CI) | 0.56 [0.32, 0.98] |
| 8 CRP: measured on day 3 | 2 | 80 | Mean Difference (IV, Fixed, 95% CI) | 90.59 [43.77, 137.41] |
| 9 CRP: last available follow‐up | 2 | 80 | Mean Difference (IV, Fixed, 95% CI) | 2.81 [‐4.90, 10.53] |
| 10 Length of hospital stay | 5 | 538 | Mean Difference (IV, Fixed, 95% CI) | ‐1.71 [‐6.04, 2.61] |
| 11 All‐cause mortality: worst‐best case and best‐worst case scenarios | 6 | Risk Ratio (M‐H, Fixed, 95% CI) | Subtotals only | |
| 11.1 Worst‐best case scenario | 6 | 666 | Risk Ratio (M‐H, Fixed, 95% CI) | 1.64 [1.02, 2.65] |
| 11.2 Best‐worst case scenario | 6 | 666 | Risk Ratio (M‐H, Fixed, 95% CI) | 0.70 [0.44, 1.11] |
| 12 SIRS: worst‐best case and best‐worst case scenarios | 3 | Risk Ratio (M‐H, Fixed, 95% CI) | Subtotals only | |
| 12.1 Worst‐best case scenario | 3 | 223 | Risk Ratio (M‐H, Fixed, 95% CI) | 1.30 [1.08, 1.56] |
| 12.2 Best‐worst case scenario | 3 | 223 | Risk Ratio (M‐H, Fixed, 95% CI) | 0.84 [0.70, 1.00] |
| 13 Organ failure: worst‐best case and best‐worst case scenarios | 5 | Risk Ratio (M‐H, Fixed, 95% CI) | Subtotals only | |
| 13.1 Worst‐best case scenario | 5 | 644 | Risk Ratio (M‐H, Fixed, 95% CI) | 0.99 [0.80, 1.22] |
| 13.2 Best‐worst case scenario | 5 | 644 | Risk Ratio (M‐H, Fixed, 95% CI) | 0.71 [0.57, 0.88] |
| 14 Adverse events: worst‐best case and best‐worst case scenarios | 2 | Risk Ratio (M‐H, Fixed, 95% CI) | Subtotals only | |
| 14.1 Worst‐best case scenario | 2 | 133 | Risk Ratio (M‐H, Fixed, 95% CI) | 2.87 [0.97, 8.44] |
| 14.2 Best‐worst case scenario | 2 | 113 | Risk Ratio (M‐H, Fixed, 95% CI) | 0.18 [0.06, 0.55] |
| 15 All‐cause mortality: probiotics vs other EN | 6 | Risk Ratio (M‐H, Fixed, 95% CI) | Subtotals only | |
| 15.1 Probiotics with fibres vs polymeric EN with fibres | 4 | 489 | Risk Ratio (M‐H, Fixed, 95% CI) | 1.41 [0.80, 2.49] |
| 15.2 Probiotics with fibres vs polymeric EN | 1 | 62 | Risk Ratio (M‐H, Fixed, 95% CI) | 0.10 [0.01, 1.68] |
| 15.3 Probiotics vs polymeric EN | 1 | 22 | Risk Ratio (M‐H, Fixed, 95% CI) | 0.0 [0.0, 0.0] |
| 15.4 Probiotics vs semi‐elemental EN | 1 | 123 | Risk Ratio (M‐H, Fixed, 95% CI) | 0.33 [0.04, 3.07] |
| 16 SIRS: probiotics vs other EN | 3 | Risk Ratio (M‐H, Fixed, 95% CI) | Subtotals only | |
| 16.1 Probiotics with fibres vs polymeric EN with fibres | 3 | 191 | Risk Ratio (M‐H, Fixed, 95% CI) | 1.08 [0.87, 1.33] |
| 16.2 Probiotics with fibres vs polymeric EN | 1 | 62 | Risk Ratio (M‐H, Fixed, 95% CI) | 1.03 [0.94, 1.12] |
| 17 Organ failure: probiotics vs other EN | 5 | Risk Ratio (M‐H, Fixed, 95% CI) | Subtotals only | |
| 17.1 Probiotics with fibres vs polymeric EN with fibres | 4 | 489 | Risk Ratio (M‐H, Fixed, 95% CI) | 0.95 [0.72, 1.24] |
| 17.2 Probiotics with fibres vs polymeric EN | 1 | 62 | Risk Ratio (M‐H, Fixed, 95% CI) | 0.90 [0.79, 1.03] |
| 17.3 Probiotics vs semi‐elemental EN | 1 | 123 | Risk Ratio (M‐H, Fixed, 95% CI) | 0.46 [0.20, 1.05] |
| 18 Adverse events: probiotics vs other EN | 2 | 133 | Risk Ratio (M‐H, Fixed, 95% CI) | 1.18 [0.33, 4.20] |
| 18.1 Probiotics with fibres vs polymeric EN with fibres | 2 | 133 | Risk Ratio (M‐H, Fixed, 95% CI) | 1.18 [0.33, 4.20] |
Comparison 3. Immunonutrition with probiotics and fibres vs control.
| Outcome or subgroup title | No. of studies | No. of participants | Statistical method | Effect size |
|---|---|---|---|---|
| 1 Length of hospital stay | 1 | Mean Difference (IV, Fixed, 95% CI) | Subtotals only |
Comparison 4. Semi‐elemental EN vs control (other EN or placebo or no intervention).
| Outcome or subgroup title | No. of studies | No. of participants | Statistical method | Effect size |
|---|---|---|---|---|
| 1 Length of hospital stay | 1 | Mean Difference (IV, Fixed, 95% CI) | Subtotals only |
Comparison 5. Fibre‐enriched EN vs control.
| Outcome or subgroup title | No. of studies | No. of participants | Statistical method | Effect size |
|---|---|---|---|---|
| 1 All‐cause mortality | 2 | 103 | Risk Ratio (M‐H, Fixed, 95% CI) | 0.23 [0.03, 1.84] |
| 2 SIRS | 1 | Risk Ratio (M‐H, Fixed, 95% CI) | Subtotals only | |
| 3 Organ failure | 1 | Risk Ratio (M‐H, Fixed, 95% CI) | Subtotals only | |
| 4 Local septic complications | 1 | Risk Ratio (M‐H, Fixed, 95% CI) | Subtotals only | |
| 5 Other local complications | 1 | Risk Ratio (M‐H, Fixed, 95% CI) | Subtotals only | |
| 6 Other infections | 1 | Risk Ratio (M‐H, Fixed, 95% CI) | Subtotals only | |
| 7 Length of hospital stay | 2 | 103 | Mean Difference (IV, Fixed, 95% CI) | ‐9.28 [‐13.21, ‐5.35] |
Comparison 6. Other subgroup analyses.
| Outcome or subgroup title | No. of studies | No. of participants | Statistical method | Effect size |
|---|---|---|---|---|
| 1 All‐cause mortality stratified for trials assessing EN compared with no intervention | 4 | 511 | Risk Ratio (M‐H, Fixed, 95% CI) | 0.50 [0.29, 0.86] |
Comparison 7. Post hoc sensitivity analysis: probiotics vs control.
| Outcome or subgroup title | No. of studies | No. of participants | Statistical method | Effect size |
|---|---|---|---|---|
| 1 Sensitivity analysis: all‐cause mortality (participants from Besselink 2008 were excluded) | 5 | 368 | Risk Ratio (M‐H, Fixed, 95% CI) | 0.30 [0.10, 0.84] |
| 2 Sensitivity analysis: organ failure (participants from Besselink 2008 were excluded) | 4 | 346 | Risk Ratio (M‐H, Fixed, 95% CI) | 0.74 [0.59, 0.92] |
| 3 Sensitivity analysis: local septic complications (participants from Besselink 2008 were excluded) | 5 | 368 | Risk Ratio (M‐H, Fixed, 95% CI) | 0.40 [0.22, 0.72] |
| 4 Sensitivity analysis: other local complications (participants from Besselink 2008 were excluded) | 2 | 133 | Risk Ratio (M‐H, Fixed, 95% CI) | 0.96 [0.65, 1.41] |
| 5 Sensitivity analysis: length of hospital stay (participants from Besselink 2008 were excluded) | 4 | 240 | Mean Difference (IV, Fixed, 95% CI) | ‐4.87 [‐10.07, 0.33] |
Characteristics of studies
Characteristics of included studies [ordered by study ID]
Besselink 2008.
| Methods | Study design: double‐blind placebo‐controlled randomised multi‐centre trial with parallel‐group design Country of origin: the Netherlands Pre‐sample size estimation: yes, study authors anticipated that probiotics would lead to a reduction in infectious complications from 50% to 30% of participants. Sample size calculation was based on α = 0.05 and power of 80%, leading to the required 188 participants. Taking into account 5% loss‐to‐follow up, a required total sample size of 200 participants was calculated Intention‐to‐treat: yes, all randomly assigned participants were included in the analysis |
|
| Participants | Number of participants randomly assigned: 298 Probiotics group (n = 152)
Placebo group (n = 144)
Inclusion criteria
Exclusion criteria
Causes of acute pancreatitis (n)
Participant attrition/loss to follow‐up/deviations from protocol
|
|
| Interventions | Probiotics group
EN was started in both groups within 72 hours of admission. Initial rate of administration was not specified; however it is stated that a gradual increase over the first days with an energy target of 125 kJ/kg (up to 90 kg body weight) on day 4 after start of EN When participants started oral intake, the nasojejunal tube was removed and the study product or placebo was administered orally for the remainder of the 28 days in total |
|
| Outcomes | Primary endpoint
Secondary endpoints
|
|
| Notes | Additional information was requested 22 January 2014 and reply was received 22 January 2014 through personal communication with principal trial author, Dr Marc Besselink Dr Besselink provided data on the following.
|
|
| Risk of bias | ||
| Bias | Authors' judgement | Support for judgement |
| Random sequence generation (selection bias) | Low risk | Computer‐generated permuted‐block sequence and balanced by participating centre and by presumed origin (biliary vs non‐biliary) in blocks of 4 |
| Allocation concealment (selection bias) | Low risk | Study drug and placebo were packaged in identical numbered sachets and were stored in identical numbered containers |
| Blinding of participants and personnel (performance bias) All outcomes | Low risk | Method of blinding was described; both study drug and placebo were white powders, identical in weight, smell and taste |
| Blinding of outcome assessment (detection bias) All outcomes | Low risk | Blinding of outcome assessment was ensured, as stated by study authors |
| Incomplete outcome data (attrition bias) All outcomes | Low risk | Numbers of and reasons for dropouts and withdrawals in all intervention groups were described. Two participants, 1 from each group, were excluded from analysis because of wrong diagnosis of AP |
| Selective reporting (reporting bias) | Low risk | All expected and prespecified outcomes were reported. Study protocol was available for assessment |
| Other bias | Unclear risk | Baseline imbalance is possible as a significantly higher number of participants with organ failure were included in the intervention group at baseline. Role of the funding sponsor was clearly described; study is not likely to be influenced by it |
Cravo 1989.
| Methods | Study design: prospective randomised trial Country of origin: Portugal Pre‐sample size estimation: not stated Intention‐to‐treat: not enough information provided |
|
| Participants | Number of participants randomly assigned: 91 Group I (n = 47)
Group II (n = 44)
Inclusion criteria
Exclusion criteria
Causes of acute pancreatitis: data not shown Participant attrition/loss of follow‐up/deviations from protocol: none stated |
|
| Interventions | Group I: elemental EN formulation Group II: polymeric EN formulation Administration in both groups started more than 48 hours after admission. Route, rate and duration of both interventions were not described |
|
| Outcomes | Outcomes
|
|
| Notes | Additional information was requested 22 January 2014 and reply was received 22 January 2014 through personal communication with principal trial author, Dr Marilia Cravo Dr.Cravo stated that the study has never been published as a full paper but provided no additional information |
|
| Risk of bias | ||
| Bias | Authors' judgement | Support for judgement |
| Random sequence generation (selection bias) | Unclear risk | Trial was described as randomised, but method of sequence generation was not specified |
| Allocation concealment (selection bias) | Unclear risk | Not enough information was provided to assess this outcome |
| Blinding of participants and personnel (performance bias) All outcomes | Unclear risk | Trial did not provide information for assessment of this domain, but it is not likely to have been blinded |
| Blinding of outcome assessment (detection bias) All outcomes | Unclear risk | Trial did not provide information for assessment of this domain, but it is not likely to have been blinded |
| Incomplete outcome data (attrition bias) All outcomes | Unclear risk | Reporting of potential attrition and/or exclusions was insufficient to permit judgement |
| Selective reporting (reporting bias) | Unclear risk | Not enough information was provided to assess this outcome |
| Other bias | Unclear risk | Not enough information was provided to assess this outcome |
Hallay 2001.
| Methods | Study design: prospective randomised trial with parallel‐group design Country of origin: Hungary Pre‐sample size estimation: not stated Intention‐to‐treat: yes, all randomly assigned participants were included in the analysis |
|
| Participants | Number of participants randomly assigned: 16 Group I (n = 9)
Group II (n = 7)
Inclusion criteria
Exclusion criteria
Etiology of acute pancreatitis
Participant attrition/loss to follow‐up/deviations from protocol: none stated |
|
| Interventions | Group I
Group II
|
|
| Outcomes | Outcomes assessed
|
|
| Notes | Additional information was requested 2 February 2014 and reply was received 3 February 2014 through personal communication with principal trial author, Dr Judit Hallay Dr Hallay provided data on the following:
|
|
| Risk of bias | ||
| Bias | Authors' judgement | Support for judgement |
| Random sequence generation (selection bias) | Unclear risk | Not enough information was provided |
| Allocation concealment (selection bias) | Low risk | Allocation concealment was maintained by the use of sealed envelopes |
| Blinding of participants and personnel (performance bias) All outcomes | Unclear risk | Trial did not provide information for assessment of this domain, but it is not likely to have been blinded |
| Blinding of outcome assessment (detection bias) All outcomes | Unclear risk | Trial did not provide information for assessment of this domain, but it is not likely to have been blinded |
| Incomplete outcome data (attrition bias) All outcomes | Unclear risk | Study did not address this outcome |
| Selective reporting (reporting bias) | Unclear risk | Outcomes were not clearly prespecified |
| Other bias | Low risk | Study seems free of other potential sources of bias |
Huang 2008.
| Methods | Study design: prospective randomised trial with parallel‐group design Country of origin: China Pre‐sample size estimation: not stated Intention‐to‐treat: yes |
|
| Participants | Number of participants randomly assigned: 32 Group I (n = 18)
Group II (n = 14)
Inclusion criteria
Exclusion criteria
Causes of acute pancreatitis: not stated Participant attrition/loss to follow‐up/deviations from protocol: none stated |
|
| Interventions | Group I: polymeric EN formulation Group II: polymeric EN formulation supplemented with glutamine (0.1 g/kg body weight/d) and arginine (0.2 g/kg body weight/d) Administration of EN in both groups started within 72 hours from admission and lasted for at least 14 days. Route and rate of administration were not stated |
|
| Outcomes | Outcomes
|
|
| Notes | Additional information was requested 7 February 2014, but no reply has been received | |
| Risk of bias | ||
| Bias | Authors' judgement | Support for judgement |
| Random sequence generation (selection bias) | Unclear risk | Method of randomisation was described as 'simple randomisation method', but no other information was provided |
| Allocation concealment (selection bias) | Unclear risk | Not enough information was provided to assess this outcome |
| Blinding of participants and personnel (performance bias) All outcomes | Unclear risk | Trial did not provide information for assessment of this domain, but it is not likely to have been blinded |
| Blinding of outcome assessment (detection bias) All outcomes | Unclear risk | Trial did not provide information for assessment of this domain, but it is not likely to have been blinded |
| Incomplete outcome data (attrition bias) All outcomes | Low risk | Seems that no losses to follow‐up and no withdrawals occurred |
| Selective reporting (reporting bias) | Low risk | All outcomes were reported |
| Other bias | Low risk | Trial seems to be free of other potential sources of bias |
Lasztity 2005.
| Methods | Study design: prospective randomised controlled trial Country of origin: Hungary Pre‐sample size estimation: not stated Intention‐to‐treat: yes, all randomly assigned participants were included in the analysis |
|
| Participants | Number of participants randomly assigned: 28 n‐3 PUFA group (n = 14)
Control group (n = 14)
Inclusion criteria
Exclusion criteria
Causes of acute pancreatitis (n)
Participant attrition/loss to follow‐up/deviations from protocol: none stated |
|
| Interventions | n‐3 PUFA group
Control group
Duration of EN administration in both groups was not specified |
|
| Outcomes | Primary endpoints
|
|
| Notes | Additional information was requested 22 January 2014, but no reply has been received | |
| Risk of bias | ||
| Bias | Authors' judgement | Support for judgement |
| Random sequence generation (selection bias) | Unclear risk | Trial was described as randomised, but method of sequence generation was not specified |
| Allocation concealment (selection bias) | Unclear risk | Not enough information was provided to assess this outcome |
| Blinding of participants and personnel (performance bias) All outcomes | Unclear risk | Trial did not provide information for assessment of this domain, but it is not likely to have been blinded |
| Blinding of outcome assessment (detection bias) All outcomes | Unclear risk | Trial did not provide information for assessment of this domain, but it is not likely to have been blinded |
| Incomplete outcome data (attrition bias) All outcomes | Low risk | No outcome data seem to be missing |
| Selective reporting (reporting bias) | Low risk | All expected and prespecified outcomes were reported |
| Other bias | Low risk | Trial seems to be free of other potential sources of bias |
Lata 2010.
| Methods | Study design: randomised placebo‐controlled double‐blind study with parallel groups Country of origin: Czech Republic Pre‐sample size estimation: not stated Intention‐to‐treat: All randomly assigned participants were included in the analysis; however 6 participants in the placebo group were transferred for safety reasons and were analysed as part of the placebo group |
|
| Participants | Number of participants randomly assigned: 22 Probiotic group (n = 7)
Placebo group (n = 15)
Inclusion criteria
Exclusion criteria
Causes of acute pancreatitis (n)
Participant attrition/loss to follow‐up/deviations from protocol: none stated |
|
| Interventions | Probiotic group
Placebo group
Co‐interventions in both groups: standard treatment; in case of biliary origin, ERCP with papillosphincterotomy was performed; antibiotics were not given as a prophylactic measure |
|
| Outcomes | Outcomes
|
|
| Notes | Additional information was requested 22 January 2014, but no reply has been received | |
| Risk of bias | ||
| Bias | Authors' judgement | Support for judgement |
| Random sequence generation (selection bias) | Unclear risk | Trial was described as randomised, but method of sequence generation was not specified |
| Allocation concealment (selection bias) | High risk | Six participants were allocated directly to placebo group for safety reasons, after results of concern regarding probiotic use were published |
| Blinding of participants and personnel (performance bias) All outcomes | High risk | Blinding was broken, potentially influencing outcomes |
| Blinding of outcome assessment (detection bias) All outcomes | High risk | Blinding was broken, potentially influencing outcomes |
| Incomplete outcome data (attrition bias) All outcomes | Unclear risk | Study did not address this outcome |
| Selective reporting (reporting bias) | Unclear risk | Outcomes were not clearly prespecified, and insufficient information was provided to assess this domain |
| Other bias | High risk | Baseline imbalance is a possible source of bias in this study |
Lu 2008.
| Methods | Study design: prospective randomised clinical trial with parallel groups Country of origin: China Pre‐sample size estimation: not stated Intention‐to‐treat: yes, all randomly assigned participants were included in the analysis |
|
| Participants | Number of participants randomly assigned: 198 SOD (ebselen + EHEC) (n = 48)
MOD (ebselen + EHEC) (n = 55)
SOD (vehicle) (n = 43)
MOD (vehicle) (n = 52)
Inclusion criteria
Exclusion criteria
Causes of acute pancreatitis (n)
Participant attrition/loss to follow‐up/deviations from protocol: none stated |
|
| Interventions | SOD (ebselen + EHEC) and MOD (ebselen + EHEC)
SOD (vehicle) and MOD (vehicle)
|
|
| Outcomes | Outcomes
|
|
| Notes | Additional information was requested 16 December 2013 and 27 January 2014, but no reply has been received | |
| Risk of bias | ||
| Bias | Authors' judgement | Support for judgement |
| Random sequence generation (selection bias) | Unclear risk | Study authors stated that a method of simple randomisation was performed; however no other information was given to permit judgement |
| Allocation concealment (selection bias) | Unclear risk | Not enough information was given to assess this domain |
| Blinding of participants and personnel (performance bias) All outcomes | Unclear risk | Trial did not provide information for assessment of this domain, but it is not likely to have been blinded |
| Blinding of outcome assessment (detection bias) All outcomes | Unclear risk | Trial did not provide information for assessment of this domain, but it is not likely to have been blinded |
| Incomplete outcome data (attrition bias) All outcomes | Low risk | No outcome data seem to be missing |
| Selective reporting (reporting bias) | Unclear risk | Outcomes were not clearly prespecified, and provided information was insufficient to assess this domain |
| Other bias | Low risk | Study seems to be free of other sources of bias |
Olah 2002.
| Methods | Study design: randomised double‐blind trial, parallel groups Country of origin: Hungary Pre‐sample size estimation: not stated Intention‐to‐treat: no, 5 randomly assigned participants were excluded from the analyses |
|
| Participants | Number of participants randomly assigned: 50 Group A (n = 23)
Group B (n = 22)
Inclusion criteria
Exclusion criteria
Causes of acute pancreatitis (n)
Participant attrition/loss to follow‐up/deviations from protocol: 5 participants were excluded from the study after randomisation; 2 were excluded from group A because of feeding intolerance; 3 were excluded from group B (1 because of feeding intolerance, and 2 because of repeated feeding tube removal) |
|
| Interventions | Group A: polymeric formula supplemented twice daily with heat‐inactivated Lactobacillus plantarum 299 and 10 g oat fibre (prebiotic) Group B: polymeric formula supplemented twice daily with 109Lactobacillus plantarum 299 and 10 g oat fibre (prebiotic) Administration of EN in both groups started within 24 hours from admission, except in some cases no later than noon the next day, via a nasojejunal tube, at a gradually increasing rate, reaching the target of 30 kcal/kg body weight intake Duration of administration: 7 days |
|
| Outcomes | Outcomes
|
|
| Notes | Additional information was requested 27 January 2014 and reply was received 28 January 2014 through personal communication with principal trial author, Dr Attila Olah Dr Olah provided data on the following:
|
|
| Risk of bias | ||
| Bias | Authors' judgement | Support for judgement |
| Random sequence generation (selection bias) | Unclear risk | Trial was described as randomised, but method of sequence generation was not specified |
| Allocation concealment (selection bias) | Unclear risk | Not enough information was provided to assess this outcome |
| Blinding of participants and personnel (performance bias) All outcomes | Unclear risk | Trial was described as double‐blind, but not enough information was given to assess this domain |
| Blinding of outcome assessment (detection bias) All outcomes | Unclear risk | Trial was described as double‐blind, but not enough information was given to assess this domain |
| Incomplete outcome data (attrition bias) All outcomes | Low risk | Numbers of and reasons for dropouts and withdrawals were given |
| Selective reporting (reporting bias) | Unclear risk | Outcomes were not clearly prespecified, and insufficient information was provided to assess this domain |
| Other bias | Low risk | Study seems to be free from other sources of bias |
Olah 2007.
| Methods | Study design: prospective randomised double‐blind study Country of origin: Hungary Pre‐sample size estimation: not stated Intention‐to‐treat: no, of the initially 83 randomly assigned participants, only 62 were included in the analysis |
|
| Participants | Number of participants randomly assigned: 83 Group A (n = 42)
Group B (n = 41)
Inclusion criteria
Exclusion criteria
Causes of acute pancreatitis (n)
Participant attrition/loss to follow‐up/deviations from protocol: 21 participants were excluded after randomisation, 7 from Group A and 10 from Group B were excluded from the trial because calculated Imrie score was less than 3 and/or CRP value was less than 150 mg/L and/or abdominal CT was indicated and showed less than 30% necrosis; additional 2 participants from Group A and 2 from Group B were excluded from analyses because of intolerance of jejunal feeding |
|
| Interventions | Group A
Group B
Administration of EN in both groups started within 24 hours of admission with a goal to supply 30 kcal/kg body weight over a period ≥ 7 days |
|
| Outcomes | Outcomes
|
|
| Notes | Additional information was requested 19 and 21 January 2014 and reply was received 21 January 2014 through personal communication with principal trial author, Dr Attila Olah Dr Olah provided data on the following:
|
|
| Risk of bias | ||
| Bias | Authors' judgement | Support for judgement |
| Random sequence generation (selection bias) | Unclear risk | Method of random sequence generation was not described |
| Allocation concealment (selection bias) | Unclear risk | Not enough information was given to assess this domain |
| Blinding of participants and personnel (performance bias) All outcomes | Unclear risk | Trial was described as double‐blind, but not enough information was given to assess this domain |
| Blinding of outcome assessment (detection bias) All outcomes | Unclear risk | Trial was described as double‐blind, but not enough information was given to assess this domain |
| Incomplete outcome data (attrition bias) All outcomes | High risk | Twenty‐one participants were excluded after randomisation because they did not meet additional criteria and because they were intolerant of jejunal feeding |
| Selective reporting (reporting bias) | Unclear risk | Outcomes were not clearly prespecified, and insufficient information was provided to assess this domain |
| Other bias | Low risk | Study seems to be free of other sources of bias |
Pearce 2006.
| Methods | Study design: randomised parallel‐group clinical trial Country of origin: United Kingdom Pre‐sample size estimation: yes, estimated sample size of 17 participants per group was calculated to detect a reduction in CRP of 40 mg/L with a 95% confidence interval of less than 40 mg/L, a power of 0.8 and a P value of less than 0.05. However, the intended number of participants was not achieved because of time constraints as stated Intention‐to‐treat: no, 1 participant from the control group withdrew from the study and was not included in the analysis |
|
| Participants | Number of participants randomly assigned: 32 Study group (n = 15)
Control group (n = 17)
Inclusion criteria
Exclusion criteria
Causes of acute pancreatitis: not stated Participant attrition/loss to follow‐up/deviations from protocol: 1 participant from control group withdrew from the study without giving a reason (was not included in the analysis) |
|
| Interventions | Study group
Control group
Enteral nutrition was started on day 0 in both groups, for at least 72 hours. If further feeding was required, study was continued up to a maximum of 15 days as long as enteral feeding was believed to be indicated. Rate of administration was not stated Enteral nutrition was administered through a blindly placed nasojejunal tube in 23 participants, an endoscopically placed nasojejunal tube in 3 participants and a nasogastric tube in 4 participants; 1 participant had feeding administered through a needle jejunostomy |
|
| Outcomes | Primary endpoint
Secondary endpoints
|
|
| Notes | Additional information was requested 4 December 2013 and reply was received 5 December 2013 through personal communication with principal trial author, Dr Callum B Pearce Dr Pearce provided data on the following:
|
|
| Risk of bias | ||
| Bias | Authors' judgement | Support for judgement |
| Random sequence generation (selection bias) | Low risk | Computer‐generated sequence was used according to the principle of randomly permuted blocks |
| Allocation concealment (selection bias) | Unclear risk | Study authors stated that randomisation was performed by the sponsor; however method of allocation concealment was not described |
| Blinding of participants and personnel (performance bias) All outcomes | Unclear risk | Trial was described as double‐blind, but not enough information was given to assess this domain |
| Blinding of outcome assessment (detection bias) All outcomes | Unclear risk | Not enough information was given to assess this domain |
| Incomplete outcome data (attrition bias) All outcomes | Low risk | Study authors stated that 1 participant in the control group withdrew from the trial on day 2 without giving a reason |
| Selective reporting (reporting bias) | High risk | Not all expected and prespecified outcomes were reported (i.e. infected necrosis, other infection) |
| Other bias | Unclear risk | Trial seems to have been supported by a sponsor; however study authors did not specifically describe sponsor's involvement in trial design, conduct, analyses of results and/or reporting. Furthermore, statistically significant differences in gender distribution were noted between the 2 groups, as well as in height and weight, although BMI was comparable between groups. Furthermore, trial was stopped early because of time constraints |
Petrov 2013.
| Methods | Study design: prospective randomised controlled trial with parallel groups Country of origin: New Zealand Pre‐sample size estimation: yes. Given that mean length of hospitalisation for mild AP in study hospital was 6 ± 1.5 days, a sample size of 70 participants (35 in each group) was calculated to have 80% power (2‐sided α = 0.05) to detect a 1‐day difference in total length of hospital stay between study arms. However, study did not reach required sample size because it was stopped early as the result of futility Intention‐to‐treat: yes |
|
| Participants | Number of participants randomly assigned: 35 NGT group (n = 17)
NPO group (n = 18)
Inclusion criteria
Exclusion criteria
Causes of acute pancreatitis
Participant attrition/loss to follow‐up/deviations from protocol: none |
|
| Interventions | NGT group
NPO group
|
|
| Outcomes | Primary outcomes
Secondary outcomes
|
|
| Notes | Additional information was requested 22 and 27 January 2014, but no reply has been received | |
| Risk of bias | ||
| Bias | Authors' judgement | Support for judgement |
| Random sequence generation (selection bias) | Low risk | Computer‐generated sequence was used and was balanced with the use of blocks of 4 and 6 to mask assignment |
| Allocation concealment (selection bias) | Low risk | Sealed numbered envelopes were used |
| Blinding of participants and personnel (performance bias) All outcomes | Unclear risk | Study did not address this outcome, but it is not likely to have been blinded |
| Blinding of outcome assessment (detection bias) All outcomes | Unclear risk | Study did not address this outcome, and insufficient information was given to permit judgement |
| Incomplete outcome data (attrition bias) All outcomes | Low risk | No dropouts or withdrawals occurred during the study |
| Selective reporting (reporting bias) | Low risk | Protocol of the study was available and outcomes were prespecified; all expected outcomes were reported |
| Other bias | Low risk | Study authors stated that funding sponsor did not participate in study design, data collection and analysis and interpretation of results |
Plaudis 2012.
| Methods | Study design: prospective Country of origin: Latvia Pre‐sample size estimation: no Intention‐to‐treat: yes |
|
| Participants | Number of participants randomly assigned: 90
Proportion of males and females in study population was 1:1.7. Alcohol and gallstones were predominant etiological factors for AP among enrolled participants. No other specific baseline data were given Inclusion criteria
Exclusion criteria
Causes of acute pancreatitis: alcohol predominantly amongst men and biliary amongst women; actual data were not given Participant attrition/loss to follow‐up/deviations from protocol: none |
|
| Interventions | SYNBIO group: polymeric low‐volume EN formulation supplemented with daily dose of 800 billion lactic acid bacteria and 20 g fibres FIBRE group: polymeric low‐volume EN formulation supplemented with daily dose of 20 g fibres Control group: polymeric low‐volume EN formulation All participants received EN orally at an initial rate of 20 mL every 2 hours, with gradual increase to 20 mL/h. If tolerated, rate was increased to 50 mL/h in participants after surgery EN was administered via nasojejunal tube Start and duration of interventions were not stated |
|
| Outcomes | Outcomes
|
|
| Notes | Additional information was requested 19 December 2014 and reply was received 3 January 2014 through personal communication with principal trial author, Dr Haralds Plaudis Dr Plaudis provided data on the following:
|
|
| Risk of bias | ||
| Bias | Authors' judgement | Support for judgement |
| Random sequence generation (selection bias) | Low risk | A nurse picked up a number between 1 and 3. It was not possible to pick the same number twice in a row |
| Allocation concealment (selection bias) | Unclear risk | An unblinded nurse prepared the enteral feedings; however, it was not clear whether allocation was kept concealed until treatment assignment |
| Blinding of participants and personnel (performance bias) All outcomes | Low risk | The 2 EN formulations looked the same and did not differ regarding taste and smell |
| Blinding of outcome assessment (detection bias) All outcomes | Unclear risk | Trial did not provide information for assessment of this domain |
| Incomplete outcome data (attrition bias) All outcomes | Low risk | Study authors stated that all participants completed the trial without deviation from treatment protocol |
| Selective reporting (reporting bias) | Low risk | All prespecified and expected outcomes were reported |
| Other bias | Low risk | Study seems to be free of other sources of bias |
Poropat 2012.
| Methods | Study design: prospective randomised clinical trial Country of origin: Croatia Pre‐sample size estimation: yes, calculated for a 2‐sample comparison of proportions with assumptions that alpha equalled 0.05 (2‐sided), with a power of 0.8, proportion of participants with primary outcome in control group 0.6, and proportion of participants with primary outcome in experimental group 0.4. Estimated required sample size for each group was 107 participants Intention‐to‐treat: yes |
|
| Participants | Number of participants randomly assigned: 214 EN group (n = 107)
Nil‐by‐mouth group (n = 107)
Inclusion criteria
Exclusion criteria
Causes of acute pancreatitis (n)
Participant attrition/loss to follow‐up/deviations from protocol (n)
|
|
| Interventions | EN group
Nil‐by‐mouth
Co‐interventions: All participants received standard symptomatic treatment, intravenous fluid replacement and antibiotic prophylaxis with imipenem 500 mg iv 3 times daily during the first 10 days |
|
| Outcomes | Primary outcome measures
Secondary outcome measures
|
|
| Notes | Financial support: grant from Ministry of Science, Education and Sports of the Republic of Croatia. This entity was in no way involved in design and conduct of the trial, data collection and analysis, interpretation of data and writing of the manuscript | |
| Risk of bias | ||
| Bias | Authors' judgement | Support for judgement |
| Random sequence generation (selection bias) | Low risk | Computer‐generated sequence was used to randomly assign participants to study groups in a 1:1 ratio |
| Allocation concealment (selection bias) | Unclear risk | Randomisation was performed by hospital pharmacist, who was unaware of participant characteristics and was not otherwise involved in the study. However, the sequence could potentially be viewed by other study personnel |
| Blinding of participants and personnel (performance bias) All outcomes | High risk | Participants and study personnel were not blinded to assigned treatment |
| Blinding of outcome assessment (detection bias) All outcomes | Low risk | Outcome assessors were blinded to participant allocation and were not otherwise involved in the treatment of participants |
| Incomplete outcome data (attrition bias) All outcomes | Low risk | Numbers and reasons for dropouts and withdrawals in all intervention groups were described |
| Selective reporting (reporting bias) | Low risk | All expected and prespecified outcomes were reported. Protocol was accessible for assessment |
| Other bias | Low risk | Study seems free of other sources of bias |
Wang 2007.
| Methods | Study design: prospective randomised clinical trial with parallel‐group design Country of origin: China Pre‐sample size estimation: no Intention‐to‐treat: not stated |
|
| Participants | Number of participants randomly assigned: 64 Group A (n = 24)
Group B (n = 19)
Group C (n = 21)
Inclusion criteria
Exclusion criteria
Causes of acute pancreatitis: not stated Participant attrition/loss to follow‐up/deviations from protocol: none |
|
| Interventions | Group A
Group B
Group C
|
|
| Outcomes | Outcomes
|
|
| Notes | Additional information requested 30 January 2014, but no reply has been received | |
| Risk of bias | ||
| Bias | Authors' judgement | Support for judgement |
| Random sequence generation (selection bias) | Unclear risk | Study authors stated that trial was randomised; however method of random sequence generation was not described |
| Allocation concealment (selection bias) | Unclear risk | Insufficient information was given to assess this domain |
| Blinding of participants and personnel (performance bias) All outcomes | Unclear risk | Trial did not provide information for assessment of this domain, but it is not likely to have been blinded |
| Blinding of outcome assessment (detection bias) All outcomes | Unclear risk | Trial did not provide information for assessment of this domain, but it is not likely to have been blinded |
| Incomplete outcome data (attrition bias) All outcomes | Low risk | Seems that no participants withdrew and no losses to follow‐up occurred |
| Selective reporting (reporting bias) | Low risk | All prespecified and expected outcomes were reported |
| Other bias | Low risk | Trial seems to be free of other possible sources of bias |
Wang 2013.
| Methods | Study design: prospective double‐blind study with parallel groups Country of origin: China Pre‐sample size estimation: no Intention‐to‐treat: seems that all randomly assigned participants were included in the analyses; no exclusions from analyses were stated |
|
| Participants | Number of participants randomly assigned: 183 PN group (n = 60)
EN group (n = 61)
EN + EIN group (n = 62)
Inclusion criteria
Exclusion criteria
Causes of acute pancreatitis
Participant attrition/loss to follow‐up/deviations from protocol: not stated |
|
| Interventions | PN group
EN group
EIN group
|
|
| Outcomes | Outcomes
|
|
| Notes | Additional information requested 22 January 2014, but no reply has been received | |
| Risk of bias | ||
| Bias | Authors' judgement | Support for judgement |
| Random sequence generation (selection bias) | Unclear risk | Trial was described as randomised, but method of sequence generation was not specified |
| Allocation concealment (selection bias) | Unclear risk | Not enough information was given to assess this domain |
| Blinding of participants and personnel (performance bias) All outcomes | Unclear risk | Trial was described as double‐blind, but not enough information was given to assess this domain |
| Blinding of outcome assessment (detection bias) All outcomes | Unclear risk | Trial was described as double‐blind, but not enough information was given to assess this domain |
| Incomplete outcome data (attrition bias) All outcomes | Unclear risk | Study did not address this outcome |
| Selective reporting (reporting bias) | Low risk | All expected and prespecified outcomes were reported |
| Other bias | Low risk | Study seems to be free of other sources of bias |
AP = acute pancreatitis.
APACHE = Acute Physiology and Chronic Health Evaluation.
BMI = body mass index.
CAPAP = carboxypeptidase B activation peptide.
CRP = C‐reactive protein.
CT = computed tomography.
CVVH = continuous venovenous haemofiltration.
DHA = docosahexaenoic acid.
EHEC = ethyl‐hydroxyethyl cellulose.
EIN = ecoimmunonutrition.
EN = enteral nutrition.
EPA = eicosapentaenoic acid.
ERCP = endoscopic retrograde cholangiopancreatography.
GSH = glutathione.
ICU = intensive care unit.
Ig = immunoglobulin.
IL = interleukin.
LAL = Limulus amoebocyte lysate.
MOD = multiple organ dysfunction.
MOF = multiple organ failure.
NGT = nasogastric tube.
NPO = nothing by mouth.
NYHA = New York Heart Association.
PN = parenteral nutrition.
PUFA = polyunsaturated fatty acid.
SAP = severe acute pancreatitis.
SD = standard deviation.
SIRS = systemic inflammatory response syndrome.
SOD = single organ dysfunction.
SOFA = sequential organ failure assessment.
TBARS = thiobarbituric acid reactive substances.
TISS = therapeutic intervention score.
TNF = tumour necrosis factor.
TPN = total parenteral nutrition.
ULN = upper limit of normal.
Characteristics of excluded studies [ordered by study ID]
| Study | Reason for exclusion |
|---|---|
| Bai 2010 | Insufficient energy and nitrogen were supplemented with PN |
| Cui 2009 | Different EN formulations with addition of other nutritional supplements was used in the same groups of participants |
| Karakan 2007 | Study assessed the use of EN in combination with PN, which is an exclusion criterion for this review |
| Lu 2011 | Insufficient energy and nitrogen were supplemented by PN, which is an exclusion criterion for this review |
| Pandey 2004 | Specific type of EN formulation used was not stated. Study authors were contacted, but no reply has been received |
| Powell 2000 | A proportion of participants received a combination of enteral and parenteral nutrition |
| Sharma 2011 | Trial assessed the use of probiotics versus placebo, but not in the context of a supplement to specific enteral nutrition formulation, rather as a supplement to any current mode of feeding in enrolled participants |
| Tiengou 2006 | Participants were treated with TPN before insertion of nasojejunal tube and commencement of enteral feeding |
EN = enteral nutrition.
PN = parenteral nutrition.
TPN = total parenteral nutrition.
Characteristics of ongoing studies [ordered by study ID]
ChiCTR‐TRC‐13003762.
| Trial name or title | Sequential treatment of rhubarb combined with early enteral nutrition for bowel dysfunction of severe acute pancreatitis |
| Methods | Randomised trial with parallel‐group design |
| Participants | Patients with severe acute pancreatitis |
| Interventions | PN group: parenteral nutrition EEN group: early enteral nutrition Rhubarb/EEN group: rhubarb combination with early enteral nutrition |
| Outcomes | Primary outcomes: IL‐6 and IL‐11 |
| Starting date | November 2013 |
| Contact information | http://apps.who.int/trialsearch/Trial.aspx?TrialID=ChiCTR‐TRC‐13003762 |
| Notes | Trial is currently recruiting participants |
NCT01249963.
| Trial name or title | Evaluation of oral enteral nutrition supplement in patients with mild acute pancreatitis |
| Methods | Randomised trial with parallel‐group design |
| Participants | Patients with mild acute pancreatitis |
| Interventions | Intervention: polymeric EN supplemented with phentermine Control: immunonutrition |
| Outcomes | Primary outcomes: acceptance, tolerance and nutritional status Secondary outcomes: inflammatory parameter evolution and EN complications |
| Starting date | February 2011 |
| Contact information | http://www.ClinicalTrials.gov/show/NCT01249963 |
| Notes | Recruitment status of this study is unknown because the information has not been verified recently |
NCT01798511.
| Trial name or title | Oral Refeeding IntOlerance After Nasogastric Tube Feeding (ORION) |
| Methods | Randomised trial with parallel‐group design |
| Participants | Patients with acute pancreatitis |
| Interventions | Intervention: nasogastric tube feeding with a semi‐elemental EN formulation Control: nil‐by‐mouth regimen |
| Outcomes | Primary outcome: incidence of oral food intolerance Secondary outcomes
|
| Starting date | April 2013 |
| Contact information | http://www.clinicaltrials.gov/show/NCT01798511 |
| Notes | This study is not yet open for participant recruitment |
EEN = early enteral nutrition.
EN = enteral nutrition.
IL = interleukin.
PN = parenteral nutrition.
Differences between protocol and review
We assessed on a post‐protocol basis the overall quality of evidence for all primary outcomes according to GRADE (Grades of Recommendation, Assessment, Development and Evaluation) recommendations (GRADE 2004).
Contributions of authors
GP, VG, GH and DS were involved in conception and design of the review. GP and VG screened the literature, assessed trials for eligibility and selected them according to inclusion and exclusion criteria; they also performed data extraction and risk of bias assessment. GP, VG and GH analysed and interpreted data and results. GP drafted the manuscript. GH and DS critically reviewed the manuscript and resolved discrepancies.
Sources of support
Internal sources
The Cochrane Upper Gastrointestinal and Pancreatic Disease Group, McMaster University, Hamilton, Ontario, Canada.
Department of Gastroenterology, University Hospital Rijeka, Rijeka, Croatia.
External sources
No sources of support supplied
Declarations of interest
GP is the primary author in one included trial (Poropat 2012). He has no affiliation with any of the producers of different EN modulations. An Editor in the Cochrane Upper Gastrointestinal and Pancreatic Diseases Review Group carried out data abstraction for this study.
VG: none.
GH: none.
DS is the co‐author in one included trial (Poropat 2012). He has lectured on behalf of Fresenius Kabi, a healthcare company that manufactures medicines for clinical nutrition. Nutritional products produced by this company were used in the Pearce 2006 trial among the included studies, and in the Cui 2009 and Karakan 2007 trials among the excluded studies. DS had no knowledge of which particular brands of enteral nutrition preparations were evaluated in any of the studies.
New
References
References to studies included in this review
Besselink 2008 {published data only}
- Besselink MG, Santvoort HC, Buskens E, Boermeester MA, Goor H, Timmerman HM, et al. Probiotic prophylaxis in predicted severe acute pancreatitis: a randomised, double‐blind, placebo‐controlled trial. Lancet 2008;371(9613):651‐9. [PUBMED: 18279948] [DOI] [PubMed] [Google Scholar]
- Besselink MGH, Timmerman HM, Buskens E, Niuwehuijs VB, Akkermans LMA, Gooszen HG, et al. Probiotic prophylaxis in patients with predicted severe acute pancreatitis (PROPATRIA): design and rationale of a double‐blind, placebo‐controlled randomised multicenter trial (ISRCTN38327949). BMC Surgery 2004;4:12. [PUBMED: 15456517] [DOI] [PMC free article] [PubMed] [Google Scholar]
Cravo 1989 {published data only}
- Cravo M, Camilo ME, Marques A, Pinto Correia J. Early tube feeding in acute pancreatitis: a prospective study. Clinical Nutrition 1989;8(Suppl):4. [Google Scholar]
Hallay 2001 {published data only}
- Hallay J, Kovacs G, Szatmari K, Bako A, Szentkereszty ZS, Lakos G, et al. Early jejunal nutrition and changes in the immunological parameters of patients with acute pancreatitis. Hepatogastroenterology 2001;48(41):1488‐92. [PUBMED: 11677993] [PubMed] [Google Scholar]
Huang 2008 {published data only}
- Huang X, Wang X, Ma J, Jing D, Wang P, Wu K. Effects of enteral nutrition supplemented with glutamine and arginine on gut barrier in patients with severe acute pancreatitis: a prospective randomized controlled trial. Zhonghua Yi Xue Za Zhi 2008;88(34):2407‐9. [PUBMED: 19087716] [PubMed] [Google Scholar]
Lasztity 2005 {published data only}
- Lasztity N, Hamvas J, Biro L, Nemeth E, Marosvolgyi T, Decsi T, et al. Effect of enterally administered n‐3 polyunsaturated fatty acids in acute pancreatitis ‐ a prospective randomized clinical trial. Clinical Nutrition 2005;24(2):198‐205. [15784478] [DOI] [PubMed] [Google Scholar]
Lata 2010 {published data only}
- Lata J, Jurankova J, Stiburek O, Pribramska V, Senkyrik M, Vanasek T. Probiotics in acute pancreatitis ‐ a randomised, placebo‐controlled, double‐blind study [Probiotika u akutní pankreatitidy randomizovana, kontrolovaná, dvojité slepá studie]. Vnitr̆ní Lékar̆ství 2010;56(2):111‐4. [PubMed] [Google Scholar]
Lu 2008 {published data only}
- Lu H, Shi Y, Zhao L, Bai C, Wang X. Role of enteral ebselen and ethylhydroxyethyl cellulose in pancreatitis‐associated multiple‐organ dysfunction in humans. Journal of Organ Dysfunction 2008;4:43‐50. [Google Scholar]
Olah 2002 {published data only}
- Kecskes G, Belagyi T, Olah A. Early jejunal nutrition with combined pre‐ and probiotics in acute pancreatitis ‐ prospective, randomized, double‐blind investigations [Korai jejunális táplálás pre‐ és probiotikummal történő kombinálása akut pancreatitisben ‐ Prospektív, randomizált, kettős‐vak vizsgálatsorozat]. Magyar Sebészet 2003;56(1):3‐8. [PubMed] [Google Scholar]
- Olah A, Belagyi T, Issekutz A, Gamal ME, Bengmark S. Randomized clinical trial of specific lactobacillus and fibre supplement to early enteral nutrition in patients with acute pancreatitis. British Journal of Surgery 2002;89(9):1103‐7. [DOI] [PubMed] [Google Scholar]
Olah 2007 {published data only}
- Olah A, Belagyi T, Issekutz A, Olgyai G. Combination of early nasojejunal feeding with modern synbiotic therapy in the treatment of severe acute pancreatitis (prospective, randomized, double‐blind study) [Jejunális táplálás és korszerű synbiotikum kombinációja súlyos acut pancreatitisben]. Magyar Sebészet 2005;58(3):173‐8. [PubMed] [Google Scholar]
- Olah A, Belagyi T, Poto L, Romics L Jr, Bengmark S. Synbiotic control of inflammation and infection in severe acute pancreatitis: a prospective, randomized, double blind study. Hepato‐Gastroenterology 2007;54(74):590‐4. [PubMed] [Google Scholar]
Pearce 2006 {published data only}
- Pearce CB, Sadek SA, Walter AM, Goggin PM, Somers SS, Toh SK, et al. A double‐blind, randomised, controlled trial to study the effects of an enteral feed supplemented with glutamine, arginine, and omega‐3 fatty acids in predicted acute severe pancreatitis. JOP: Journal of the Pancreas 2006;7(4):361‐71. [PubMed] [Google Scholar]
Petrov 2013 {published data only}
- Petrov M, Phillips A, Windsor JA. Early nasogastric tube feeding versus nil‐by‐mouth in patients with mild to moderate acute pancreatitis: a randomized controlled trial. Gastroenterology 2012;142(Suppl 1):S‐94. [DOI] [PubMed] [Google Scholar]
- Petrov MS, McIlroy K, Grayson L, Phillips ARJ. Early nasogastric tube feeding versus nil per os in mild to moderate acute pancreatitis: a randomized controlled trial. Clinical Nutrition 2013;32(5):697‐703. [DOI] [PubMed] [Google Scholar]
Plaudis 2012 {published data only}
- Plaudis H, Pupelis G, Zeiza K, Boka V. Early low volume oral synbiotic/prebiotic supplemented enteral stimulation of the gut in patients with severe acute pancreatitis: a prospective feasibility study. Acta Chirurgica Belgica 2012;112(2):131‐8. [DOI] [PubMed] [Google Scholar]
Poropat 2012 {published and unpublished data}
- Poropat G, Franjic N, Stimac D. Enteral nutrition for patients with acute pancreatitis. Gut 2012;61(Suppl 3):A61. [Google Scholar]
- Poropat G, Franjic N, Stimac D. Enteral nutrition in the treatment of moderate to severe acute pancreatitis. Pancreatology 2012;12(6):558. [DOI: ] [Google Scholar]
Wang 2007 {published data only}
- Wang YZ, Ding YB, Wu J, Deng B, Xiao WM. Treatment of 64 cases severe acute pancreatitis with early enteral nutrition and intestinal barrier protective agents [早期肠内营养联合肠屏障保护剂治疗急性重症胰腺炎64例]. World Chinese Journal of Digestology 2007;15(33):3545‐8. [Google Scholar]
Wang 2013 {published data only}
- Wang G, Wen J, Xu L, Zhou S, Gong M, Wen P, Xiao X. Effect of enteral nutrition and ecoimmunonutrition on bacterial translocation and cytokine production in patients with severe acute pancreatitis. Journal of Surgical Research 2013;183(2):592‐7. [DOI] [PubMed] [Google Scholar]
References to studies excluded from this review
Bai 2010 {published data only}
- Bai LZ, Kang LM, Lu XG, Kang X, Fan ZW, Ji CY. Enteral ecoimmunonutrition support alleviates hepatic injury in patients with severe acute pancreatitis [肠内免疫微生态营养对重症急性胰腺炎肝损害的影响]. Shijie Huaren Xiaohua Zazhi 2010;18(6):616‐20. [Google Scholar]
Cui 2009 {published data only}
- Cui L, Wang S, Wang X, Pu J, Liu C, Fu S, et al. Early enteral application of probiotics improved the changes of inflammatory mediators and its relationship with the prognosis in the patients with severe acute pancreatitis [早期应用微生态制剂对急性重症胰腺炎患者血清炎性介质水平的影响]. Chinese Journal of New Drugs 2009;18(19):1854‐7. [Google Scholar]
Karakan 2007 {published data only}
- Karakan T, Ergun M, Dogan I, Cindoruk M, Unal S. Comparison of early enteral nutrition in severe acute pancreatitis with prebiotic fiber supplementation versus standard enteral nutrition: a prospective randomized double‐blind study. World Journal of Gastroenterology 2007;13(19):2733‐7. [DOI] [PMC free article] [PubMed] [Google Scholar]
Lu 2011 {published data only}
- Lu J, Li B, Peng Z, Liang X, He H, Chen G, Li G. Early enteral nutrition combined with enteral infusion of traditional Chinese medicine improves intestinal paralysis in patients with severe acute pancreatitis [早期空肠内营养联合中药肠内滴注对重症急性胰腺炎患者肠麻痹的改善作用]. World Journal of Gastroenterology 2011;19(12):1257‐62. [Google Scholar]
Pandey 2004 {published data only}
- Pandey SK, Ahuja V, Joshi YK, Sharma MP. A randomized trial of oral refeeding compared with jejunal tube refeeding in acute pancreatitis. Indian Journal of Gastroenterology 2004;23(2):53‐5. [PubMed] [Google Scholar]
Powell 2000 {published data only}
- Powell JJ, Murchison JT, Fearon KCH, Ross A, Siriwardena AK. Randomized controlled trial of the effect of early enteral nutrition on markers of the inflammatory response in predicted severe acute pancreatitis. British Journal of Surgery 2000;87(10):1375‐81. [DOI] [PubMed] [Google Scholar]
Sharma 2011 {published data only}
- Sharma B, Srivastava S, Singh N, Sachdev V, Kapur S, Saraya A. Role of probiotics on gut permeability and endotoxemia in patients with acute pancreatitis: a double‐blind randomized controlled trial. Journal of Clinical Gastroenterology 2011;45(5):442‐8. [DOI] [PubMed] [Google Scholar]
Tiengou 2006 {published data only}
- Tiengou L, Gloro R, Pouzoulet J, Bouhier K, Read M, Arnaud‐Battandier F, et al. Semi‐elemental formula or polymeric formula: is there a better choice for enteral nutrition in acute pancreatitis? Randomized comparative study. Journal of Parenteral and Enteral Nutrition 2006;30(1):1‐5. [DOI] [PubMed] [Google Scholar]
References to ongoing studies
ChiCTR‐TRC‐13003762 {published data only}
- Sequential treatment of rhubarb combined with early enteral nutrition for bowel dysfunction of severe acute pancreatitis. Ongoing study November 2013.
NCT01249963 {published data only}
- Evaluation of oral enteral nutrition supplement in patients with mild acute pancreatitis. Ongoing study February 2011.
NCT01798511 {published data only}
- Oral Refeeding IntOlerance After Nasogastric Tube Feeding (ORION). Ongoing study April 2013.
Additional references
Al‐Omran 2010
- Al‐Omran M, Albalawi ZH, Tashkandi MF, Al‐Ansary LA. Enteral versus parenteral nutrition for acute pancreatitis. Cochrane Database of Systematic Reviews 2010, Issue 1. [DOI: 10.1002/14651858.CD002837] [DOI] [PMC free article] [PubMed] [Google Scholar]
Banks 2006
- Banks PA, Freeman ML. Practice guidelines in acute pancreatitis. American Journal of Gastroenterology 2006;101(10):2379‐400. [DOI] [PubMed] [Google Scholar]
Banks 2012
- Banks PA, Bollen TL, Dervenis C, Gooszen HG, Johnson CD, Sarr MG, et al. Classification of acute pancreatitis ‐ 2012: revision of the Atlanta classification and definitions by international consensus. Gut 2013;62(1):102‐11. [DOI] [PubMed] [Google Scholar]
Beger 1986
- Beger HG, Bittner R, Block S, Büchler M. Bacterial contamination of pancreatic necrosis. A prospective clinical study. Gastroenterology 1986;91(2):433‐8. [DOI] [PubMed] [Google Scholar]
Bradley 1993
- Bradley EL 3rd. A clinically based classification system for acute pancreatitis. Summary of the International Symposium on Acute Pancreatitis, Atlanta, Ga, September 11 through 13, 1992. Archives of Surgery 1993;128(5):586‐90. [DOI] [PubMed] [Google Scholar]
Buchman 1995
- Buchman AL, Moukarzel AA, Bhuta S, Belle M, Ament ME, Eckhert CD. Parenteral nutrition is associated with intestinal morphologic and functional changes in humans. Journal of Parenteral and Enteral Nutrition 1995;19(6):453‐60. [DOI] [PubMed] [Google Scholar]
Buter 2002
- Buter A, Imrie CW, Carter CR, Evans S, McKay CJ. Dynamic nature of early organ dysfunction determines outcome in acute pancreatitis. British Journal of Surgery 2002;89(3):298‐302. [DOI] [PubMed] [Google Scholar]
Büchler 2000
- Büchler MW, Gloor B, Müller CA, Friess H, Seiler CA, Uhl W. Acute necrotizing pancreatitis: treatment strategy according to the status of infection. Annals of Surgery 2000;232(5):619‐26. [DOI] [PMC free article] [PubMed] [Google Scholar]
CMA 2004
- Chinese Medical Association. Gastroenterology Pancreatic Disease Group. Chinese acute pancreatitis treatment guidelines (draft). Chinese Journal of Internal Medicine 2004;43(3):236‐8. [Google Scholar]
Demets 1987
- Demets DL. Methods for combining randomized clinical trials: strengths and limitations. Statistics in Medicine 1987;6(3):341‐50. [DOI] [PubMed] [Google Scholar]
DerSimonian 1986
- DerSimonian R, Laird N. Meta‐analysis in clinical trials. Controlled Clinical Trials 1986;7(3):177‐88. [DOI] [PubMed] [Google Scholar]
Eatock 2005
- Eatock FC, Chong P, Menezes N, McKay CJ, Carter CR, Imrie CW. A randomized study of early nasogastric versus nasojejunal feeding in severe acute pancreatitis. American Journal of Gastroenterology 2005;100(2):432‐9. [DOI] [PubMed] [Google Scholar]
Egger 1997
- Egger M, Davey Smith G, Schneider M, Minder C. Bias in meta‐analysis detected by a simple, graphical test. BMJ 1997;315(7109):629‐34. [DOI] [PMC free article] [PubMed] [Google Scholar]
Forsmark 2007
- Forsmark CE, Baillie J. AGA Institute technical review on acute pancreatitis. Gastroenterology 2007;132(5):2022‐44. [DOI] [PubMed] [Google Scholar]
Frey 2006
- Frey CF, Zhou H, Harvey DJ, White RH. The incidence and case‐fatality rates of acute biliary, alcoholic, and idiopathic pancreatitis in California, 1994‐2001. Pancreas 2006;33(4):336‐44. [DOI] [PubMed] [Google Scholar]
Frossard 2008
- Frossard JL, Steer ML, Pastor CM. Acute pancreatitis. Lancet 2008;371(9607):143‐52. [DOI] [PubMed] [Google Scholar]
Gianotti 2006
- Gianotti L. Nutrition in infections. Surgical Infections 2006;7(Suppl 2):S29‐32. [DOI] [PubMed] [Google Scholar]
Gianotti 2009
- Gianotti L, Meier R, Lobo DN, Bassi C, Dejong CH, Ockenga J, et al. ESPEN guidelines on parenteral nutrition: pancreas. Clinical Nutrition 2009;28(4):428‐35. [DOI] [PubMed] [Google Scholar]
Gluud 2006
- Gluud LL. Bias in clinical intervention research. American Journal of Epidemiology 2006;163(6):493‐501. [DOI] [PubMed] [Google Scholar]
Goldacre 2004
- Goldacre MJ, Roberts SE. Hospital admission for acute pancreatitis in an English population, 1963‐98: database study of incidence and mortality. BMJ 2004;328(7454):1466‐9. [DOI] [PMC free article] [PubMed] [Google Scholar]
GRADE 2004
- The GRADE Working Group. Grading quality of evidence and strength of recommendations. British Medical Journal 2004;328:1490‐4. [DOI] [PMC free article] [PubMed] [Google Scholar]
GRADEpro [Computer program]
- McMaster University. GRADEprofiler. Version 3.6. McMaster University, 2014.
Haney 2007
- Haney JC, Pappas TN. Necrotizing pancreatitis: diagnosis and management. The Surgical Clinics of North America 2007;87(6):1431‐46, ix. [DOI] [PubMed] [Google Scholar]
Higgins 2003
- Higgins JP, Thompson SG, Deeks JJ, Altman DG. Measuring inconsistency in meta‐analyses. BMJ 2003;327(7414):557‐60. [DOI] [PMC free article] [PubMed] [Google Scholar]
Higgins 2011
- Higgins JPT, Green S (editors). Cochrane Handbook for Systematic Reviews of Interventions Version 5.1.0 [updated March 2011]. The Cochrane Collaboration, 2011. www.cochrane‐handbook.org.
Hollis 1999
- Hollis S, Campbell F. What is meant by intention to treat analysis? Survey of published randomised controlled trials. BMJ 1999;319(7211):670‐4. [DOI] [PMC free article] [PubMed] [Google Scholar]
Imamura 2004
- Imamura M. Epidemiology of acute pancreatitis ‐ incidence by etiology, relapse rate, cause of death and long‐term prognosis. Nihon Rinsho (Japanese Journal of Clinical Medicine) 2004;62(11):1993‐7. [PubMed] [Google Scholar]
Isaji 2006
- Isaji S, Takada T, Kawarada Y, Hirata K, Mayumi T, Yoshida M, et al. JPN guidelines for the management of acute pancreatitis:surgical management. Journal of Hepato‐Biliary‐Pancreatic Surgery 2006;13(1):48‐55. [DOI] [PMC free article] [PubMed] [Google Scholar]
Kilciler 2008
- Kilciler G, Musabak U, Bagci S, Yesilova Z, Tuzun A, Uygun A, et al. Do the changes in the serum levels of IL‐2, IL‐4, TNFalpha, and IL‐6 reflect the inflammatory activity in the patients with post‐ERCP pancreatitis?. Clinical & Developmental Immunology 2008;2008:481560. [DOI] [PMC free article] [PubMed] [Google Scholar]
Kjaergard 2001
- Kjaergard LL, Villumsen J, Gluud C. Reported methodologic quality and discrepancies between large and small randomized trials in meta‐analyses. Annals of Internal Medicine 2001;135(11):982‐9. [DOI] [PubMed] [Google Scholar]
Kumar 2006
- Kumar A, Singh N, Prakash S, Saraya A, Joshi YK. Early enteral nutrition in severe acute pancreatitis: a prospective randomized controlled trial comparing nasojejunal and nasogastric routes. Journal of Clinical Gastroenterology 2006;40(5):431‐4. [DOI] [PubMed] [Google Scholar]
Langendam 2013
- Langendam MW, Akl EA, Dahm P, Glasziou P, Guyatt G, Schünemann HJ. Assessing and presenting summaries of evidence in Cochrane Reviews. Systematic Reviews 2013;2:81. [DOI] [PMC free article] [PubMed] [Google Scholar]
Lindkvist 2004
- Lindkvist B, Appelros S, Manjer J, Borgstrom A. Trends in incidence of acute pancreatitis in a Swedish population: is there really an increase?. Clinical Gastroenterology and Hepatology 2004;2(9):831‐7. [DOI] [PubMed] [Google Scholar]
MacFie 1999
- MacFie J, O'Boyle C, Mitchell CJ, Buckley PM, Johnstone D, Sudworth P. Gut origin of sepsis: a prospective study investigating associations between bacterial translocation, gastric microflora, and septic morbidity. Gut 1999;45(2):223‐8. [DOI] [PMC free article] [PubMed] [Google Scholar]
Makola 2006
- Makola D, Krenitsky J, Parrish C, Dunston E, Shaffer HA, Yeaton P, et al. Efficacy of enteral nutrition for the treatment of pancreatitis using standard enteral formula. American Journal of Gastroenterology 2006;101(10):2347‐55. [DOI] [PubMed] [Google Scholar]
McClave 2009
- McClave SA, Heyland DK. The physiologic response and associated clinical benefits from provision of early enteral nutrition. Nutrition in Clinical Practice 2009;24(3):305‐15. [DOI] [PubMed] [Google Scholar]
Meier 2006
- Meier R, Ockenga J, Pertkiewicz M, Pap A, Milinic N, Macfie J, et al. ESPEN guidelines on enteral nutrition: pancreas. Clinical Nutrition 2006;25(2):275‐84. [DOI] [PubMed] [Google Scholar]
Moher 1998
- Moher D, Pham B, Jones A, Cook DJ, Jadad AR, Moher M, et al. Does quality of reports of randomised trials affect estimates of intervention efficacy reported in meta‐analyses?. Lancet 1998;352(9128):609‐13. [DOI] [PubMed] [Google Scholar]
Munsell 2010
- Munsell MA, Buscaglia JM. Acute pancreatitis. Journal of Hospital Medicine 2010;5(4):241‐50. [DOI] [PubMed] [Google Scholar]
NIS 2012
- Healthcare Cost and Utilization Project (HCUP). The National Inpatient Sample (NIS). http://www.hcup‐us.ahrq.gov/db/nation/nis/ (accessed 28 October 2014).
Petrov 2009
- Petrov MS, Loveday BP, Pylypchuk RD, Phillips AR, Windsor JA. Systematic review and meta‐analysis of enteral nutrition formulations in acute pancreatitis. The British Journal of Surgery 2009;96(11):1243‐52. [DOI] [PubMed] [Google Scholar]
Review Manager 2013 [Computer program]
- The Nordic Cochrane Centre, The Cochrane Collaboration. Review Manager (RevMan). Version 5.2. Copenhagen: The Nordic Cochrane Centre, The Cochrane Collaboration, 2013.
Royle 2003
- Royle P, Milne R. Literature searching for randomized controlled trials used in Cochrane reviews: rapid versus exhaustive searches. International Journal of Technology Assessment in Health Care 2003;19(4):591‐603. [DOI] [PubMed] [Google Scholar]
Sakorafas 2010
- Sakorafas GH, Lappas C, Mastoraki A, Delis SG, Safioleas M. Current trends in the management of infected necrotizing pancreatitis. Infectious Disorders Drug Targets 2010;10(1):9‐14. [DOI] [PubMed] [Google Scholar]
Santora 2010
- Santora R, Kozar RA. Molecular mechanisms of pharmaconutrients. Journal of Surgical Research 2010;161(2):288‐94. [DOI] [PMC free article] [PubMed] [Google Scholar]
Schulz 1995
- Schulz KF, Chalmers I, Hayes RJ, Altman DG. Empirical evidence of bias. Dimensions of methodological quality associated with estimates of treatment effects in controlled trials. JAMA 1995;273(5):408‐12. [DOI] [PubMed] [Google Scholar]
Thomson 2008
- Thomson A. Nutrition support in acute pancreatitis. Current Opinion in Clinical Nutrition and Metabolic Care 2008;11(3):261‐6. [DOI] [PubMed] [Google Scholar]
Tonsi 2009
- Tonsi AF, Bacchion M, Crippa S, Malleo G, Bassi C. Acute pancreatitis at the beginning of the 21st century: the state of the art. World Journal of Gastroenterology 2009;15(24):1945‐59. [DOI] [PMC free article] [PubMed] [Google Scholar]
Toouli 2002
- Toouli J, Brooke‐Smith M, Bassi C, Carr‐Locke D, Telford J, Freeny P, et al. Guidelines for the management of acute pancreatitis. Journal of Gastroenterology and Hepatology 2002;17 Suppl:S15‐39. [DOI] [PubMed] [Google Scholar]
Tse 2012
- Tse F, Yuan Y. Early routine endoscopic retrograde cholangiopancreatography strategy versus early conservative management strategy in acute gallstone pancreatitis. Cochrane Database of Systematic Reviews 2012, Issue 5. [DOI: 10.1002/14651858.CD009779.pub2] [DOI] [PMC free article] [PubMed] [Google Scholar]
Uhl 2002
- Uhl W, Warshaw A, Imrie C, Bassi C, McKay CJ, Lankisch PG, et al. IAP guidelines for the surgical management of acute pancreatitis. Pancreatology 2002;2(6):565‐73. [DOI] [PubMed] [Google Scholar]
UK Working Party on Acute Pancreatitis 2005
- UK Working Party on Acute Pancreatitis. UK guidelines for the management of acute pancreatitis. Gut 2005;54(Suppl 3):iii1‐9. [DOI] [PMC free article] [PubMed] [Google Scholar]
van Ginneken 2013
- Ginneken N, Tharyan P, Lewin S, Rao GN, Meera SM, Pian J, et al. Non‐specialist health worker interventions for the care of mental, neurological and substance‐abuse disorders in low‐ and middle‐income countries. Cochrane Database of Systematic Reviews 2013, Issue 11. [DOI: 10.1002/14651858.CD009149.pub2] [DOI] [PubMed] [Google Scholar]
Villatoro 2010
- Villatoro E, Mulla M, Larvin M. Antibiotic therapy for prophylaxis against infection of pancreatic necrosis in acute pancreatitis. Cochrane Database of Systematic Reviews 2010, Issue 5. [DOI: 10.1002/14651858.CD002941.pub3] [DOI] [PMC free article] [PubMed] [Google Scholar]
Werner 2005
- Werner J, Feuerbach S, Uhl W, Büchler MW. Management of acute pancreatitis: from surgery to interventional intensive care. Gut 2005;54(3):426‐36. [DOI] [PMC free article] [PubMed] [Google Scholar]
Windsor 1998
- Windsor AC, Kanwar S, Li AG, Barnes E, Guthrie JA, Spark JI, et al. Compared with parenteral nutrition, enteral feeding attenuates the acute phase response and improves disease severity in acute pancreatitis. Gut 1998;42(3):431‐5. [DOI] [PMC free article] [PubMed] [Google Scholar]
Wood 2008
- Wood L, Egger M, Gluud LL, Schulz KF, Jüni P, Altman DG, et al. Empirical evidence of bias in treatment effect estimates in controlled trials with different interventions and outcomes: meta‐epidemiological study. BMJ 2008;336(7644):601‐5. [DOI] [PMC free article] [PubMed] [Google Scholar]
Xu 2006
- Xu GF, Lu Z, Gao J, Li ZS, Gong YF. Effect of ecoimmunonutrition supports on maintenance of integrity of intestinal mucosal barrier in severe acute pancreatitis in dogs. Chinese Medical Journal 2006;119(8):656‐61. [PubMed] [Google Scholar]
Yadav 2006
- Yadav D, Lownfels AB. Trends in the epidemiology of the first attack of acute pancreatitis: a systematic review. Pancreas 2006;33(4):323‐30. [DOI] [PubMed] [Google Scholar]
Yi 2012
- Yi F, Ge L, Zhao J, Lei Y, Zhou F, Chen Z, et al. Meta‐analysis: total parenteral nutrition versus total enteral nutrition in predicted severe acute pancreatitis. Internal Medicine 2012;51(6):523‐30. [DOI] [PubMed] [Google Scholar]