

Abstract
Adult T‐cell leukemia/lymphoma (ATLL) is a lymphoproliferative disorder caused by human T lymphotropic virus type 1 (HTLV‐I). Although ATLL cells display an activated helper/inducer T‐cell phenotype, CD4+ and CD25+, they are known to exhibit strong immunosuppressive activity. As regulatory T cells (Treg cells) express CD4+ and CD25+ molecules and possess potent immune response suppressive activity, we investigated a possible link between ATLL cells and Treg cells. In primary ATLL cells, the expression levels of the Treg cell marker molecules Foxp3 and glucocorticoid‐induced tumor necrosis factor receptor family related protein (GITR) were significantly higher than in those from healthy adults. Furthermore, ATLL cells are unresponsive in vitro to concanavalin A stimulation and suppress the proliferation of normal T cells. GITR mRNA expression was induced by the HTLV‐I transactivator Tax, and GITR promoter analyses revealed that this induction depends on the κB site from −431 bp to −444 bp upstream of the putative transcription site. Taken together, ATLL cells may originate from HTLV‐I‐infected Treg cells, and GITR seems to be involved in the progression to ATLL. (Cancer Sci 2005; 96: 527–533)
Adult T‐cell leukemia/lymphoma (ATLL) is a lymphoproliferative disorder, caused by the retrovirus human T lymphotrophic virus type 1 (HTLV‐I).( 1 , 2 ) ATLL patients present with a variety of clinical features, and this disease is subclassified into four subtypes: smoldering, chronic, acute and lymphoma.( 3 ) Acute ATLL progresses rapidly and is usually resistant to conventional chemotherapy. In contrast, chronic ATLL has a less aggressive clinical course and allows long‐term survival, even without chemotherapy. Irrespective of the subtypes, however, all ATLL patients are in a severely immune‐suppressed condition and will easily catch opportunistic infections, such as Pneumocystis carinii pneumonitis.( 4 ) Impaired cell‐mediated immunity in this disease has been well documented, even in HTLV‐1 carriers.( 5 , 6 ) Although ATLL cells display an activated helper/inducer T‐cell phenotype, CD4+ and CD25+, they are not regarded as having a helper function. Instead, ATLL cells demonstrate strong immunosuppressive activity in vitro.( 7 )
Recently, the concept of T‐cell‐mediated suppression has been reconsidered. Regulatory T cells (Treg cells) possess potent immune response‐suppressive activity and prevent autoimmune diseases. Treg cells represent, at most, 10% of the mature CD4+ T cells in human peripheral blood, and they express CD4+ and CD25+.( 8 , 9 , 10 , 11 ) In a mouse system, it has been shown that the forkhead/winged helix transcription factor (Foxp3) is a master regulatory gene for the development and function of Treg cells.( 12 , 13 , 14 ) Although CD4+CD25+ T cells express Foxp3, CD4+CD25− T cells do not, and Foxp3 expression in CD4+ T cells correlates well with their suppressive ability.( 15 ) Besides Foxp3, Treg cells express glucocorticoid‐induced tumor necrosis factor receptor (TNFR) family related protein (GITR), CTLA‐4, galectin‐1, Ly6, OX‐40, 4‐1BB and Neuropilin‐1.( 11 , 16 , 17 )
Because ATLL cells express CD4+ and CD25+, we evaluated ATLL cells from the viewpoint of Treg cells. In the present study, we show that Foxp3 and/or GITR mRNA were detected in almost all of the primary ATLL cells analyzed. Furthermore, the presence of GITR mRNA seemed to be specific to HTLV‐1‐infected T cells, because we could not detect GITR mRNA expression in HTLV‐I‐negative T cells. Conditionally expressed HTLV‐I Tax increased GITR mRNA expression consistently. Finally, an analysis of the GITR promoter revealed that this gene is activated by Tax, via the activation of nuclear factor (NF)‐κB.
Materials and Methods
Patients
Peripheral blood mononuclear cells (PBMC) were obtained from blood samples of 16 patients with chronic ATLL, 36 patients with acute ATLL and seven normal subjects by density gradient centrifugation using Lymphoprep (Axis‐Shield, Oslo, Norway). The proportion of ATLL cells in these samples always exceeded 80% of the PBMC. The subclassification of ATLL was based on the criteria of Shimoyama et al. ( 3 ) Informed consent was obtained from all patients prior to blood sample collection, and the Ethical Committee of Nagasaki University (Nagasaki, Japan) approved this study.
Cell lines
The cell lines used in this study included two interleukin (IL)‐2‐dependent ATLL cell lines, ST1 and KK1,( 18 ) three HTLV‐1‐infected T‐cell lines, MT2, MT4 and HUT102, and two HTLV‐1‐negative T‐cell lines, Jurkat and MOLT4. JPX‐9 and JPX/M are Jurkat sublines that carry wild‐type Tax and a non‐functional Tax mutant under the control of the metallothionein gene promoter, respectively.( 19 ) Cells were cultured in RPMI 1640 medium with 10% fetal bovine serum. For the culture of ST1 and KK1 cells, the medium was supplemented with 1 U/mL of IL‐2 (a gift from Takeda Pharmaceutical, Tokyo, Japan).
Reverse transcription–polymerase chain reaction analysis
The preparation of total RNA and synthesis of the first strand of cDNA were described previously.( 20 ) The primers used were: 5′‐CCCACTTACAGGCACTCCTC‐3′ and 5′‐CTTCTCCTTCTCAGCACCA‐ 3′ for Foxp3; 5′‐AACTGGCTGTGGGCTCTTGAA‐3′ and 5′‐ACAGTGAGAAACCCGAACTGG‐5′ for GITR; 5′‐CTTTGCTCCTTCAGTTGGCT‐3′ and 5′‐ATCAAGTCTATGGTGTCCCC‐3′ for GITRL; 5′‐ATCCCCTGGAGACTCCTCAA‐3′ and 5′‐AACACGTAGACTGGGTATCC‐3′ for Tax; and 5′‐AAGAGAGGCATCCTCACCCT‐3′ and 5′‐TACATCGCTGGGGTGTTGAA‐3′ for β‐actin. Cycling conditions were as follows: denaturing at 95°C for 30 s, annealing at 58°C for 30 s, and extension at 72°C for 30 s for 35 cycles for Foxp3; denaturing at 95°C for 30 s, annealing at 55°C for 30 s, and extension at 72°C for 30 s for 40 cycles for GITR and for 35 cycles for GITR ligand (GITR‐L); and denaturing at 94°C for 60 s, annealing at 62°C for 60 s, and extension at 72°C for 60 s for 25 cycles for Tax and for 22 cycles for β‐actin. The polymerase chain reaction (PCR) products were resolved on a 1.5% agarose gel, visualized by ethidium bromide staining and quantitiated by a FluorChem 8800 imaging system (Alpha Innotech, San Leandro, CA, USA).
Real‐time polymerase chain reaction for Foxp3 and GITR
The preparation of total RNA and synthesis of the first strand of cDNA were described above. PCR primer pairs were as follows: Foxp3, 5′‐TCCCAGAGTTCCTCCACAAC‐3′ and 5′‐ATTGAGTGTCCGCTGCTTCT‐3′; GITR, 5′‐GAGTGGGACTGCATGTGTGT‐3′ and 5′‐ACTGAATTTCCCCTGGGACT‐3′; CD3ζ, 5′‐ATGAGCTGTGCACAAAGTGG‐3′ and 5′‐ATTCGCTGAAAGCGTGAAGT‐3′. PCR was carried out using QuantiTect SYBR Green (Qiagen, Hilden, Germany) with the LightCycler QuickSystem 330 system (Roche Molecular Biochemicals, Mannheim, Germany). All data were normalized to a CD3ζ gene measured in the same samples.
Transfection and luciferase assay
Cells were transfected with the GITR promoter‐driven luciferase reporter Tax, its mutant (Tax M22),( 21 ) I‐κBαSuperrepressor (I‐κBαS), and dominant‐negative forms of IKK1 (IKK1.DN), IKK2 (IKK2.DN) and NEMO (NEMO.DN).( 22 ) Transient transfections were carried out using the TransFast reagent (Invitrogen, San Diego, CA, USA). When necessary, additional DNA (pcDNA3) was added to equalize the amount (2 µg) of transfected DNA in each sample. At 48 h post transfection, the GITR promoter‐driven expression of firefly luciferase was determined using luciferase assay reagents from Promega (Madison, WI, USA), and the luciferase activities were measured with a BioOrbit 1254 luminometer (Turku, Finland). The relative transfection efficiency in each sample was determined by measuring the Renilla luciferase activity. The data were normalized per transfection efficiency.
Electrophoretic mobility shift assays
The JPX‐9 and JPX‐M cells were cultured in 100‐mm cell culture dishes. Preparation of nuclear extracts for electrophoretic mobility shift assays (EMSA) was carried out as described previously.( 23 ) Nuclear extracts were prepared within 24 h of ZnCl2 addition. The κB element 5′‐CCCGGGGAACTTCCCCAGGTT‐3′ and the mutant 5′‐CCCGGCGAACTTCCCCAGGTT‐3′ oligonucleotides were converted to the double‐stranded forms and end labeled with [γ‐32P]ATP, using T4 polynucleotide kinase (TaKaRa, Kyoto, Japan). The reaction was conducted in a total volume of 10 µL, using 10 µg nuclear extract, 1 µg poly(dI‐dC), 20 mM HEPES‐NaOH (pH 7.6), 100 mM NaCl, 1 mM dithiothreitiol, 1 mM phenylmethylsulfonylfluoride and 2% glycerol. The binding reaction mixture was incubated with 10 000 cpm of radiolabeled probe for 30 min. For the competition and supershift assays, a 20‐fold excess of cold or mutant oligonucleotide, respectively, were added to the reactions, along with the antibodies against p65, p50, and cRel (Santa Cruz Biotechnology), were added to the reactions. The samples were loaded onto a 5% non‐denaturing polyacrylamide gel and run in 0.5x TBE buffer. After electrophoresis, the gel was dried and processed for autoradiography.
Cell proliferation assays
Peripheral blood mononuclear cells (1 × 10⁴) from normal subjects and ATLL patients in 96‐well plates were cultured with 5 µg of concanavalin A (ConA) for 72 h. In co‐culture experiments, 1 × 10⁴ PBMC from normal subjects were stimulated with 5 µg ConA and co‐cultured for 72 h with the indicated numbers of PBMC from normal subjects or ATLL patients. Incorporation of [3H]thymidine (1 µCi/well) during the final 6 h of culture was measured by scintillation counting.
Statistical analysis
Statistical comparisons were made using the Student's t‐test. Differences were considered to be statistically significant at P < 0.05.
Results
Expression of Foxp3 and GITR in primary adult T‐cell leukemia/lymphoma cells
Figure 1 shows the results of a quantitative analysis of the expression of each gene in normal, chronic and acute ATLL patients. The clinical features of the patients are summarized in Table 1. There were no statistically significant differences between the acute and chronic patients in terms of the percentage of abnormal lymphocytes in white blood cells (WBC). The primary ATLL cells showed significantly higher expression levels of both Foxp3 and GITR mRNA than the normal control cells. However, there were no differences between the clinical subtypes in terms of the expression of Foxp3 and GITR. Furthermore, there was no other correlation between the expression status of these genes and the clinical parameters, such as WBC count and proportion of ATLL cells, lactate dehydrogenase (LDH) level and survival time (data not shown). During the completion of our study, other groups reported that ATLL cells express Foxp3( 24 , 25 ) and OX40,( 26 ) which are also expressed in Treg cells.( 8 , 9 , 10 , 11 ) Furthermore, we found that two other markers for Treg cells, CCR4 and CCR8,( 27 ) were also expressed in almost all of the primary ATLL cells (data not shown). Thus, ATLL cells bear some resemblance to Treg cells.
Figure 1.

The expression of Foxp3 and glucocorticoid‐induced tumor necrosis factor receptor family related protein (GITR) in peripheral blood mononuclear cells from normal healthy donors and adult T‐cell leukemia/lymphoma (ATLL) patients. Quantitative analyses of Foxp3 and GITR were undertaken using real‐time reverse transcription–polymerase chain reaction. The ratios normalized by CD3ζ expression are shown. Significant difference was determined using the Student's t‐test. *P < 0.05; **P < 0.01.
Table 1.
Clinical features of adult T‐cell leukemia/lymphoma (ATLL) patients
| Chronic type | Acute type | |||||||||||||
|---|---|---|---|---|---|---|---|---|---|---|---|---|---|---|
| Case no. | WBC (/µL) | Neutro † (%) | Ab‐Ly ‡ (%) | LDH (U/L) | Case no. | WBC (/µL) | Neutro † (%) | Ab‐Ly ‡ (%) | LDH (U/L) | Case no. | WBC (/µL) | Neutro † (%) | Ab‐Ly ‡ (%) | LDH (U/L) |
| 1 | 25 600 | 13 | 71 | 453 | 1 | 12 600 | 50 | 33 | 5950 | 19 | 117 900 | 8 | 84 | 896 |
| 2 | 14 400 | 38 | 18 | 659 | 2 | 149 600 | 12 | 79 | 1669 | 20 | 84 900 | 39 | 55 | 3219 |
| 3 | 33 700 | 25.5 | 61 | 515 | 3 | 36 400 | 39 | 45 | 1970 | 21 | 26 300 | 15 | 81 | 440 |
| 4 | 11 500 | 32 | 27.5 | 291 | 4 | 152 750 | 22 | 77 | 2992 | 22 | 109 300 | 3 | 95 | 803 |
| 5 | 17 200 | 15 | 82 | 794 | 5 | 14 500 | 22 | 78 | 1627 | 23 | 215 400 | 5 | 53 | 1365 |
| 6 | 92 700 | 5 | 90 | 729 | 6 | 30 700 | 25 | 73 | 1767 | 24 | 21 700 | 73 | 18 | 4031 |
| 7 | 12 300 | 44 | 13 | 503 | 7 | 79 400 | 11 | 82 | 1357 | 25 | 18 200 | 14 | 77 | 444 |
| 8 | 20 300 | 29 | 48 | 466 | 8 | 18 100 | – | – | 487 | 26 | 95 120 | 8 | 64 | 3453 |
| 9 | 17 700 | 26 | 30 | 584 | 9 | 140 500 | 10 | 79 | 4300 | 27 | 100 000 | 4 | 95 | 1486 |
| 10 | 21 000 | 8 | 90 | 797 | 10 | 152 500 | 3 | 94 | 2047 | 28 | 7 500 | 48 | 32 | 722 |
| 11 | 14 200 | 33 | 44 | 530 | 11 | 43 200 | 71 | 26 | 1169 | 29 | 31 700 | 5 | 94 | 478 |
| 12 | 8 200 | 38 | 34 | 596 | 12 | 24 700 | 17 | 76 | 2266 | 30 | 25 800 | 9 | 73 | 3017 |
| 13 | 30 500 | 19 | 77 | 349 | 13 | 27 800 | 24 | 59 | 2537 | 31 | 8 800 | 32 | 60 | 1471 |
| 14 | 11 200 | 29 | 33 | 322 | 14 | 21 800 | 31 | 60 | 2197 | 32 | 32 600 | 27 | 62 | 605 |
| 15 | 32 450 | 27 | 69 | 834 | 15 | 46 500 | 28 | 64.5 | 3389 | 33 | 18 300 | 41 | 42 | 12 105 |
| 16 | 23 200 | 34 | 46 | 421 | 16 | 32 400 | 14 | 82 | 1712 | 34 | 39 600 | 67 | 30 | 3263 |
| 17 | 13 600 | 44 | 42 | 1098 | 35 | 20 800 | 33 | 51 | 700 | |||||
| 18 | 41 500 | 12 | 83 | 2374 | 36 | 41 600 | 7 | 81 | 729 | |||||
Percentage of neutrophils (neutro) in white blood cells (WBC);
‡ Percentage of abnormal lymphocytes (Ab‐Ly) in WBC. LDH, lactate dehydrogenase.
Expression of GITR in HTLV‐1‐related T‐cell lines
As recent studies revealed that GITR is involved in T‐cell activation and apoptosis, we further examined the expression of GITR and its ligand GITR‐L in T‐cell lines (Fig. 2a). GITR mRNA was detected in HTLV‐1‐infected T‐cell lines and all of the ATLL cell lines, but not in HTLV‐1‐negative cell lines. In addition, GITR‐L was detected in HUT102 and MT2 cells. However, it was not expressed on primary ATLL samples, thus negating the possibility of autocrine stimulation (data not shown). Because the GITR expression was limited to the HTLV‐1‐related cell lines, we examined whether GITR could be induced by the HTLV‐1 transactivator Tax. We used the Tax‐inducible cell line JPX‐9, in which the Tax gene is under the control of the metallothionein promoter. The addition of ZnCl2 induced GITR expression in this cell line in a time‐dependent manner, which was correlated with Tax expression (Fig. 2b). In contrast, Tax did not induce Foxp3 expression. GITR expression is reportedly upregulated in T cells by several signals for the activated cells.( 28 )
Figure 2.

The expression of glucocorticoid‐induced tumor necrosis factor receptor family related protein (GITR) mRNA in T‐cell lines. (a) Reverse transcription–polymerase chain reaction (RT‐PCR) was carried out for GITR, GITR ligand and β‐actin. (b) The expression of GITR and Tax mRNA in JPX9 cells. Total RNA was prepared from Jurkat cells and JPX‐9 cells treated with 120 µM ZnCl2 for 0 h, 3 h, 8 h and 24 h.
Transactivation of the GITR promoter by Tax through nuclear factor‐kB activation
We next investigated whether Tax‐mediated upregulation of GITR expression is induced by the enhancement of its promoter. The Tax signal is mediated through interactions with transcription factors, such as cAMP‐responsive element binding protein and NF‐κB.( 29 , 30 ) The GITR promoter contains an NF‐κB binding site from −431 bp to −444 bp upstream of the putative transcription start site (Fig. 3a). We speculate that this NF‐κB binding site is a target for Tax to induce GITR mRNA expression. Jurkat cells were transiently transfected with a GITR promoter‐driven reporter construct containing −630 nucleotides upstream of the putative transcription start site. Coexpression of Tax caused an approximate seven‐fold elevation in the activity of this construct, suggesting that Tax activates the GITR gene. Next, using the Tax mutant that selectively retains the ability to activate the cAMP‐responsive element within the HTLV‐1 long terminal repeat (M22), we investigated whether Tax‐mediated activation of NF‐κB was required for induction of the GITR promoter. No significant activation of the GITR promoter‐driven reporter was observed with the M22 mutant (Fig. 3b). These results indicate that NF‐κB activation contributes to the activation of the GITR promoter by Tax. To determine whether the Tax‐induced NF‐κB activation requires I‐κB phosphorylation, the super repressor of I‐κB (I‐κBSR), lacking the inducible phosphorylation sites S32 and S36, was coexpressed with Tax in Jurkat cells. I‐κB SR decreased the Tax‐induced NF‐κB activation, indicating that the phosphorylation of IκB at S32 and S36 is necessary for Tax‐induced NF‐κB activation. An important regulator of phosphorylation in the IκB pathway is the IκB kinase (IKK) complex, which comprises multiple kinases, including IKK1 (IKKα), IKK2 (IKKβ) and NEMO (IKKγ). We therefore examined whether IKK1, IKK2 and/or NEMO were involved in Tax‐induced NF‐κB activation. The dominant‐negative forms of IKK1 (IKK1.DN), IKK2 (IKK2.DN) and NEMO (NEMO.DN) were each coexpressed with Tax in Jurkat cells. IKK1.DN, IKK2.DN and NEMO.DN were each able to reduce the Tax‐induced GITR promoter activation in Jurkat cells (Fig. 3c). These mutants had no effect on the basal activity of the GITR promoter (Fig. 3c).
Figure 3.

Tax transactivation of the glucocorticoid‐induced tumor necrosis factor receptor family related protein (GITR) promoter through nuclear factor (NF)‐κB activation in T cells. (a) Schema of the NF‐κB site at −630 bp upstream of the putative transcription start site of the GITR promoter, showing the sequences of the wild‐type and mutant‐type oligonucleotides in the GITR promoter NF‐κB site. (b) Tax‐induced GITR promoter activity. Jurkat cells were transiently transfected with 1.0 µg of the GITR promoter‐driven reporter and the wild‐type Tax or mutant Tax (M22) construct (1.0 µg), and then additional DNA was added to take the total amount of DNA to 2 µg/well. Data shown are the mean ± SD from three independent experiments. (c) Functional effects of IκB, IKK1, IKK2 and NEMO in Tax‐induced NF‐κB activation of the GITR promoter. Jurkat cells were cotransfected with 1.0 µg of the GITR promoter‐driven luciferase reporter, 0.5 µg I‐κBαS, IKK1.DN, IKK2.DN or NEMO.DN, without (control) or with 0.5 µg of the wild‐type Tax construct. Data shown are the mean ± SD from three independent experiments. (d) NF‐κB binding activity was analyzed by electrophoretic mobility shift assay. Nuclear proteins from untreated (lanes 1, 5) or ZnCl2 treated for 24 h (lanes 2–4, 6–12) JPX/M cells or JPX‐9 cells were isolated, and binding reactions were carried out with GITR promoter NF‐κB‐site oligonucleotides labeled with [γ‐32P]ATP, in the presence of competitors or antibodies. The unlabeled wild‐type NF‐κB oligonucleotide (lanes 3, 7) or the mutant NF‐κB oligonucleotide (lanes 4, 8) were added to the binding reactions as competitors at a 20‐fold molar excess. Antibodies against p65 (lane 9), p50 (lane 10), cRel (lane 11) and control IgG (lane 12) were added to the reaction for supershift assays. The arrow indicates the NF‐κB‐containing complex.
To confirm the dependence of Tax expression on the NF‐κB activity in JPX‐9 cells, we carried out EMSA analyses. Figure 3d shows a complex formed with this oligonucleotide probe in JPX‐9 cells, which were cultured with ZnCl2 for 24 h. This binding activity was reduced by the addition of an unlabeled probe, but not by a mutant oligonucleotide probe. Moreover, this complex was supershifted by the addition of anti‐p65 or anti‐p50 antibodies, suggesting that the Tax‐induced GITR NF‐κB binding activity is composed of p65 and p50. In contrast, the complex formation was not induced in JPX/M cells.
Suppressive function of adult T‐cell leukemia/lymphoma cells
Regulatory T cells are unresponsive in vitro to TCR stimulation and suppress the proliferation of stimulated T cells.( 12 , 13 , 14 ) Therefore, we first examined the primary ATLL cell response to a T‐cell mitogen, ConA. With 5 µg/mL ConA, a condition under which the PBMC of normal individuals showed highly proliferative activity, primary ATLL cells showed almost no response (Fig. 4a). Furthermore, the proliferative activity of PBMC from normal subjects was suppressed when co‐cultured with various ratios of primary ATLL cells in a dose‐dependent manner, but not when co‐cultured with the control PBMC (Fig. 4b). These data clearly indicate that ATLL cells are unresponsive in vitro to TCR stimulation and suppress the proliferation of stimulated T cells.
Figure 4.
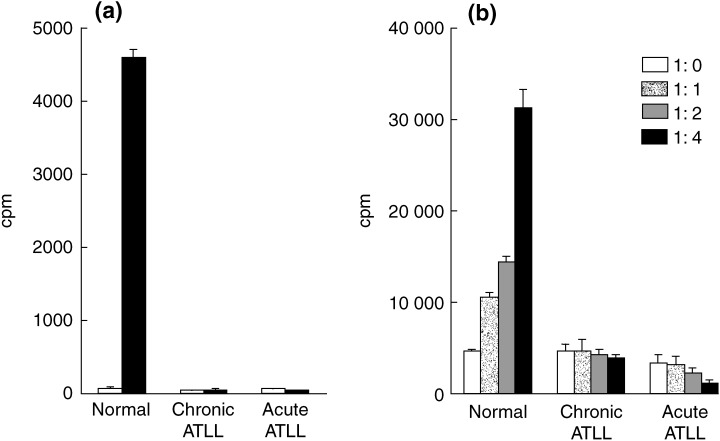
Suppressive activity of adult T‐cell leukemia/lymphoma (ATLL) cells. (a) Proliferative responses of peripheral blood mononuclear cells from normal subjects or ATLL patients. Cells were cultured with 5 µg concanavalin A (ConA) for 72 h. (b) Co‐cultures were set up at ratios of 1:0, 1:1, 1:2 and 1:4 (normal sample : normal sample/ATLL sample) in the presence of 5 µg ConA. After 72 h of culture, [3H]thymidine was added for the final 6 h. Results are expressed as the mean ± SD from triplicate cultures.
Discussion
In the present study, we demonstrated that Foxp3 and/or GITR mRNA were expressed in almost all of the primary ATLL samples. Foxp3 is a functional marker of Treg cells and plays a central role in their generation,( 12 , 13 , 14 ) and GITR is one of the surface molecules expressed on Treg cells.( 16 ) Two other markers for Treg cells, CCR4 and CCR8,( 27 ) were also expressed by almost all of the primary ATLL cells (data not shown). There was no correlation between the expression status of these markers and the clinical parameters, such as WBC count, proportion of ATLL cells, LDH level and survival time (data not shown). In models of Pneumocystis carinii and Leishmania major infections, the absence of Treg cells could lead to a more robust immune response, resulting in the clearance of infection rather than the establishment of chronic disease.( 31 , 32 ) Thus, the presence of Treg cells may lead to suppressed immune responses to pathogens. If ATLL cells maintain the characteristics of Treg cells, then it is reasonable that ATLL cells suppress the immune responses on normal lymphocytes. In fact, the suppression of cell‐mediated immunity has been well documented in HTLV‐1 carriers and patients with ATLL.( 4 , 5 , 6 , 7 ) In our study, primary ATLL cells were unresponsive to ConA stimulation and suppressed the proliferation of stimulated lymphocytes. The latter is consistent with recent reports that ATLL cells suppress activated T cells.( 33 , 34 ) These data suggest that ATLL cells originate from Treg cells. Alternatively, HTLV‐I‐infected Treg cells may have some growth advantages over other types of infected cells.
Because GITR mRNA expression seemed to be limited to the HTLV‐I‐infected cells, we evaluated the involvement of Tax in its expression. Indeed, Tax upregulated GITR expression in JPX‐9 cells. We verified that the transactivation by Tax is mediated through interactions with the transcription factor NF‐κB by both reporter assays and EMSA.
GITR expression is induced in T cells upon activation by anti‐CD3 monoclonal antibody, ConA or phorbol 12‐myristate 13‐acetate plus Ca‐ionophore treatment.( 28 ) In a study of GITR gene‐deficient mice, the T cells were hyperproliferative to TCR stimulation, suggesting that GITR might be a negative regulator for T‐cell activation in general.( 35 ) On the other hand, Treg cell and conventional T‐cell proliferation was triggered by the GITR costimulation.( 36 , 37 ) GITR‐L costimulation induces the proliferation of Treg cells as well as conventional T cells.( 38 , 39 ) Although the HTLV‐1‐infected T‐cell lines MT2 and HIT102 express GITR‐L, primary ATLL samples do not express it (data not shown). Human GITR‐L is expressed in endothelial cells,( 40 ) and possibly in dendritic cells, macrophages and B cells, as in the mouse.( 38 , 41 ) The primary ATLL cells may be stimulated with GITR‐L supplied from the above sources in vivo, and GITR expression may be involved in the development of ATLL. Because HTLV‐I has been shown to infect many types of cells,( 42 , 43 ) it is interesting to speculate that GITR‐L endows preferential growth on HTLV‐I‐infected Treg cells. In this regard, the expression of Treg markers on ATLL cells simply reflects the growth advantage of Treg cells over other types of infected cells. A study to clarify the dependence of ATLL cells on GITR‐L is currently underway in our laboratory.
Acknowledgments
We thank Drs H. Ichinose and A. Koda for encouragement. This work was supported by a Grant‐in‐Aid from the Ministry of Education, Culture, Sports, Science, and Technology, and by the 21st Century Center of Excellence Program of Nagasaki University (Nagasaki, Japan).
References
- 1. Uchiyama T, Yodoi J, Sagawa K, Takatsuki K, Uchino H. Adult T‐cell leukemia: clinical and hematologic features of 16 cases. Blood 1977; 50: 481–92. [PubMed] [Google Scholar]
- 2. Hinuma Y, Nagata K, Hanaoka M et al. Adult T‐cell leukemia: antigen in an ATL cell line and detection of antibodies to the antigen in human sera. Proc Natl Acad Sci USA 1981; 78: 6476–80. [DOI] [PMC free article] [PubMed] [Google Scholar]
- 3. Shimoyama M, Members of the Lymphoma Study Group ( 1984– 87). Diagnostic criteria and classification of clinical subtypes of adult T‐cell leukemia‐lymphoma. Br J Haematol 1991; 79: 428–37. [DOI] [PubMed] [Google Scholar]
- 4. Moriyama K, Muranishi H, Nishimura J, Tanaka K, Asayama R, Takita A. Immunodeficiency in preclinical smoldering adult T‐cell leukemia. Jpn J Clin Oncol 1988; 4: 363–9. [PubMed] [Google Scholar]
- 5. Katsuki T, Katsuki K, Imai J, Hinuma Y. Immune suppression in healthy carriers of adult T‐cell leukemia retrovirus (HTLV‐1): impairment of T‐cell control of Epstein–Barr virus‐infected B‐cells. Jpn J Cancer Res 1987; 78: 639–42. [PubMed] [Google Scholar]
- 6. Tachibana N, Okayama A, Ishizaki J. Suppression of tuberculin skin reaction in healthy HTLV‐1 carriers from Japan. Int J Cancer 1988; 42: 829–31. [DOI] [PubMed] [Google Scholar]
- 7. Yamada Y. Phenotypic and functional analysis of leukemic cells from 16 patients with adult T‐cell leukemia/lymphoma. Blood 1983; 61: 192–9. [PubMed] [Google Scholar]
- 8. Sakaguchi S, Sakaguchi N, Asano M, Itoh M, Toda M. Immunologic self‐tolerance maintained by activated T cells expressing IL‐2 receptor alpha‐chains (CD25). Breakdown of a signal mechanism of self‐tolerance causes various autoimmune diseases. J Immunol 1995; 155: 1151–64. [PubMed] [Google Scholar]
- 9. Sakaguchi S. Regulatory T cells: key controllers of immunologic self‐tolerance. Cell 2000; 101: 455–8. [DOI] [PubMed] [Google Scholar]
- 10. Shevach EM. CD4+CD25+ suppressor T cells: more questions than answers. Nature Rev 2002; 2: 389–400. [DOI] [PubMed] [Google Scholar]
- 11. Piccirillo CA, Thornton AM. Cornerstone of peripheral tolerance: naturally occurring CD4+CD25+ regulatory T cells. Trends Immunol 2004; 25: 374–80. [DOI] [PubMed] [Google Scholar]
- 12. Hori S, Nomura T, Sakaguchi S. Control of regulatory T cell development by the transcription factor Foxp3. Science 2003; 288: 1057–61. [DOI] [PubMed] [Google Scholar]
- 13. Fontenot JD, Gavin MA, Rudensky AY. Foxp3 programs the development and function of CD4+CD25+ regulatory T cells. Nat Immunol 2003; 4: 330–6. [DOI] [PubMed] [Google Scholar]
- 14. Khattri R, Cox T, Yasayko S, Ramsdell F. An essential role for Scurfin in CD4+CD25+ T regulatory cells. Nature Immunol 2003; 4: 337–42. [DOI] [PubMed] [Google Scholar]
- 15. Walker MR, Kasprowicz DJ, Gersuk VH et al. Induction of Foxp3 and acquisition of T regulatory activity by stimulated human CD4+CD25−T cells. J Clin Invest 2003; 112: 1437–43. [DOI] [PMC free article] [PubMed] [Google Scholar]
- 16. McHugh RS, Whitters MJ, Piccirillo CA et al. CD4+CD25+ immunoregulatory T cells: gene expression analysis reveals a functional role for the glucocorticoid‐induced TNF receptor. Immunity 2003; 16: 311–23. [DOI] [PubMed] [Google Scholar]
- 17. Bruder D, Probst‐Kepper M, Westendorf AM et al. Neuropilin‐1: a surface marker of regulatory T cells. Eur J Immunol 2004; 34: 623–30. [DOI] [PubMed] [Google Scholar]
- 18. Yamada Y. Features of the cytokines secreted by adult T‐cell leukemia (ATL) cells. Leuk Lymphoma 1996; 21: 443–7. [DOI] [PubMed] [Google Scholar]
- 19. Nagata K, Ohtani K, Nakamura M, Sugamura K. Activation of endogenous c‐fos proto‐oncogene expression by human T‐cell leukemia virus type 1‐encoded p40tax protein in the human T‐cell line, Jurkat. J Virol 1989; 63: 3220–6. [DOI] [PMC free article] [PubMed] [Google Scholar]
- 20. Moshe O, Fujisawa R, Nakayama T et al. Frequent expression of CCR4 in adult T‐cell leukemia and human T‐cell leukemia virus type 1‐transformed T cells. Blood 2002; 99: 1505–11. [DOI] [PubMed] [Google Scholar]
- 21. Matsumoto K, Shibata H, Fujisawa J et al. Human T‐cell leukemia virus type I Tax protein transforms rat fibroblasts via two distinct pathways. J Virol 1997; 71: 4445–51. [DOI] [PMC free article] [PubMed] [Google Scholar]
- 22. Hironaka N, Mochida K, Mori N, Maeda M, Yamamoto N, Yamaoka S. Tax‐independent constitutive IκB kinase activation in adult T‐cell leukemia cells. Neoplasia 2004; 6: 266–74. [DOI] [PMC free article] [PubMed] [Google Scholar]
- 23. Sugita S, Kohno T, Yamamoto K et al. Induction of macrophage‐inflammatory protein‐3α gene expression by TNF‐dependent NF‐κB activation. J Immunol 2002; 168: 5621–8. [DOI] [PubMed] [Google Scholar]
- 24. Karube K, Ohshima K, Tsuchiya T et al. Expression of Foxp3, a key molecule in CD4+CD25+ regulatory T cells in adult T‐cell leukemia/lymphoma cells. Br J Haematol 2004; 126: 81–4. [DOI] [PubMed] [Google Scholar]
- 25. Ishida T, Iida S, Akatsuka Y et al. The CC chemokine receptor 4 as a novel specific molecular target for immunotherapy in adult T‐cell leukemia/lymphoma. Clin Cancer Res 2004; 10: 7529–39. [DOI] [PubMed] [Google Scholar]
- 26. Nakae S, Asano M, Horai R, Sakaguchi N, Iwakura Y. IL‐1 enhances T cell‐dependent antibody production through induction of CD40 ligand and OV40 on T cells. J Immunol 2001; 167: 90–7. [DOI] [PubMed] [Google Scholar]
- 27. Iellem A, Mariani M, Lang RR et al. Unique chemotactic response profile and specific expression of chemokine receptors CCR4 and CCR8 by CD4+CD25+ regulatory T cells. J Exp Med 2001; 194: 847–53. [DOI] [PMC free article] [PubMed] [Google Scholar]
- 28. Nocentini G, Giunchi L, Ronchetti S et al. A new member of the tumor necrosis factor/nerve growth factor receptor family inhibits T cell receptor‐induced apoptosis. Proc Natl Acad Sci USA 1997; 94: 6216–21. [DOI] [PMC free article] [PubMed] [Google Scholar]
- 29. Zhao LJ, Giam CZ. Human T‐cell lymphotropic virus type I (HTLV‐1) transcriptional activator, Tax, enhances CREB binding to HTLV‐1 21‐base‐pair repeats by protein–protein interaction. Proc Natl Acad Sci USA 1992; 89: 7070–4. [DOI] [PMC free article] [PubMed] [Google Scholar]
- 30. Ballard DW, Bohnein E, Lowenthal JW, Wano Y, Franza BR, Greene WC. HTLV‐1 tax induces cellular proteins that activate the κB element in the IL‐2 receptor α gene. Science 1988; 241: 1652–5. [DOI] [PubMed] [Google Scholar]
- 31. Belkaid Y, Piccirillo CA, Mendez S, Shevach EM, Sacks DL. CD4+CD25+ regulatory T cells control Leishmania major persistence and immunity. Nature 2002; 420: 502–7. [DOI] [PubMed] [Google Scholar]
- 32. Hori S, Carvalho TL, Demengeot J. CD25+CD4+ regulatory T cells suppress CD4+ T cell‐mediated pulmonary hyperinflammation driven by Pneumocystis carinii in immunodeficient mice. Eur J Immunol 2002; 32: 1282–91. [DOI] [PubMed] [Google Scholar]
- 33. Yagi H, Nomura T, Nakamura K et al. Crucial role of FOXP3 in the development and function of human CD25+CD4+ regulatory T cells. Int Immunol 2004; 16: 1643–56. [DOI] [PubMed] [Google Scholar]
- 34. Matsubara Y, Hori T, Morita R, Sakaguchi S, Uchiyama T. Phenotypic and functional relationship between adult T‐cell leukemia cells and regulatory T cells. Leukemia 2005; 10: 482–3. [DOI] [PubMed] [Google Scholar]
- 35. Ronchetti S, Nocentini G, Riccardi C, Pandolfi PP. Role of GITR in activation response of T lymphocytes. Blood 2002; 100: 350–2. [DOI] [PubMed] [Google Scholar]
- 36. Ronchetti S, Zollo O, Bruscoli S et al. GITR, a member of the TNF receptor superfamily, is costimulatory to mouse T lymphocyte subpopulations. Eur J Immunol 2004; 34: 613–22. [DOI] [PubMed] [Google Scholar]
- 37. Kanamaru F, Youngnak P, Hashiguchi M et al. Costimulation via glucocorticoid‐induced TNF receptor in both conventional and CD25+ regulatory CD4+ T cells. J Immunol 2004; 172: 7306–14. [DOI] [PubMed] [Google Scholar]
- 38. Tone M, Tone Y, Adams E, Yates SF et al. Mouse glucocorticoid‐induced tumor necrosis factor receptor ligand is costimulatory for T cells. Proc Natl Acad Sci USA 2003; 100: 15 059–64. [DOI] [PMC free article] [PubMed] [Google Scholar]
- 39. Ji HB, Liao G, Faubin WA et al. The natural ligand for glucocorticoid‐induced TNF receptor‐related protein abrogates regulatory T cell suppression. J Immunol 2004; 172: 5823–7. [DOI] [PubMed] [Google Scholar]
- 40. Kwon B, Yu K, Ni J et al. Identification of a novel activation‐inducible protein of the tumor necrosis factor receptor superfamily and its ligand. J Biol Chem 1999; 274: 6056–61. [DOI] [PubMed] [Google Scholar]
- 41. Yu KY, Kim HS, Song SY, Min SS, Jeong JJ, Youn BS. Identification of a ligand for glucocorticoid‐induced tumor necrosis factor receptor constitutively expressed in dendritic cells. Biochem Biophys Res Commun 2003; 310: 433–8. [DOI] [PubMed] [Google Scholar]
- 42. Koyanagi Y, Itoyama Y, Nakamura N et al. In vivo infection of human T‐cell leukemia virus type I in non‐T cells. Virology 1993; 196: 25–33. [DOI] [PubMed] [Google Scholar]
- 43. Sutton RE, Littman DR. Broad host range of human T‐cell leukemia virus type 1 demonstrated with an improved pseudotyping system. J Virol 1996; 70: 7322–6. [DOI] [PMC free article] [PubMed] [Google Scholar]