
Figure 2: MAIT cell changes in gene expression during thymus differentiation.
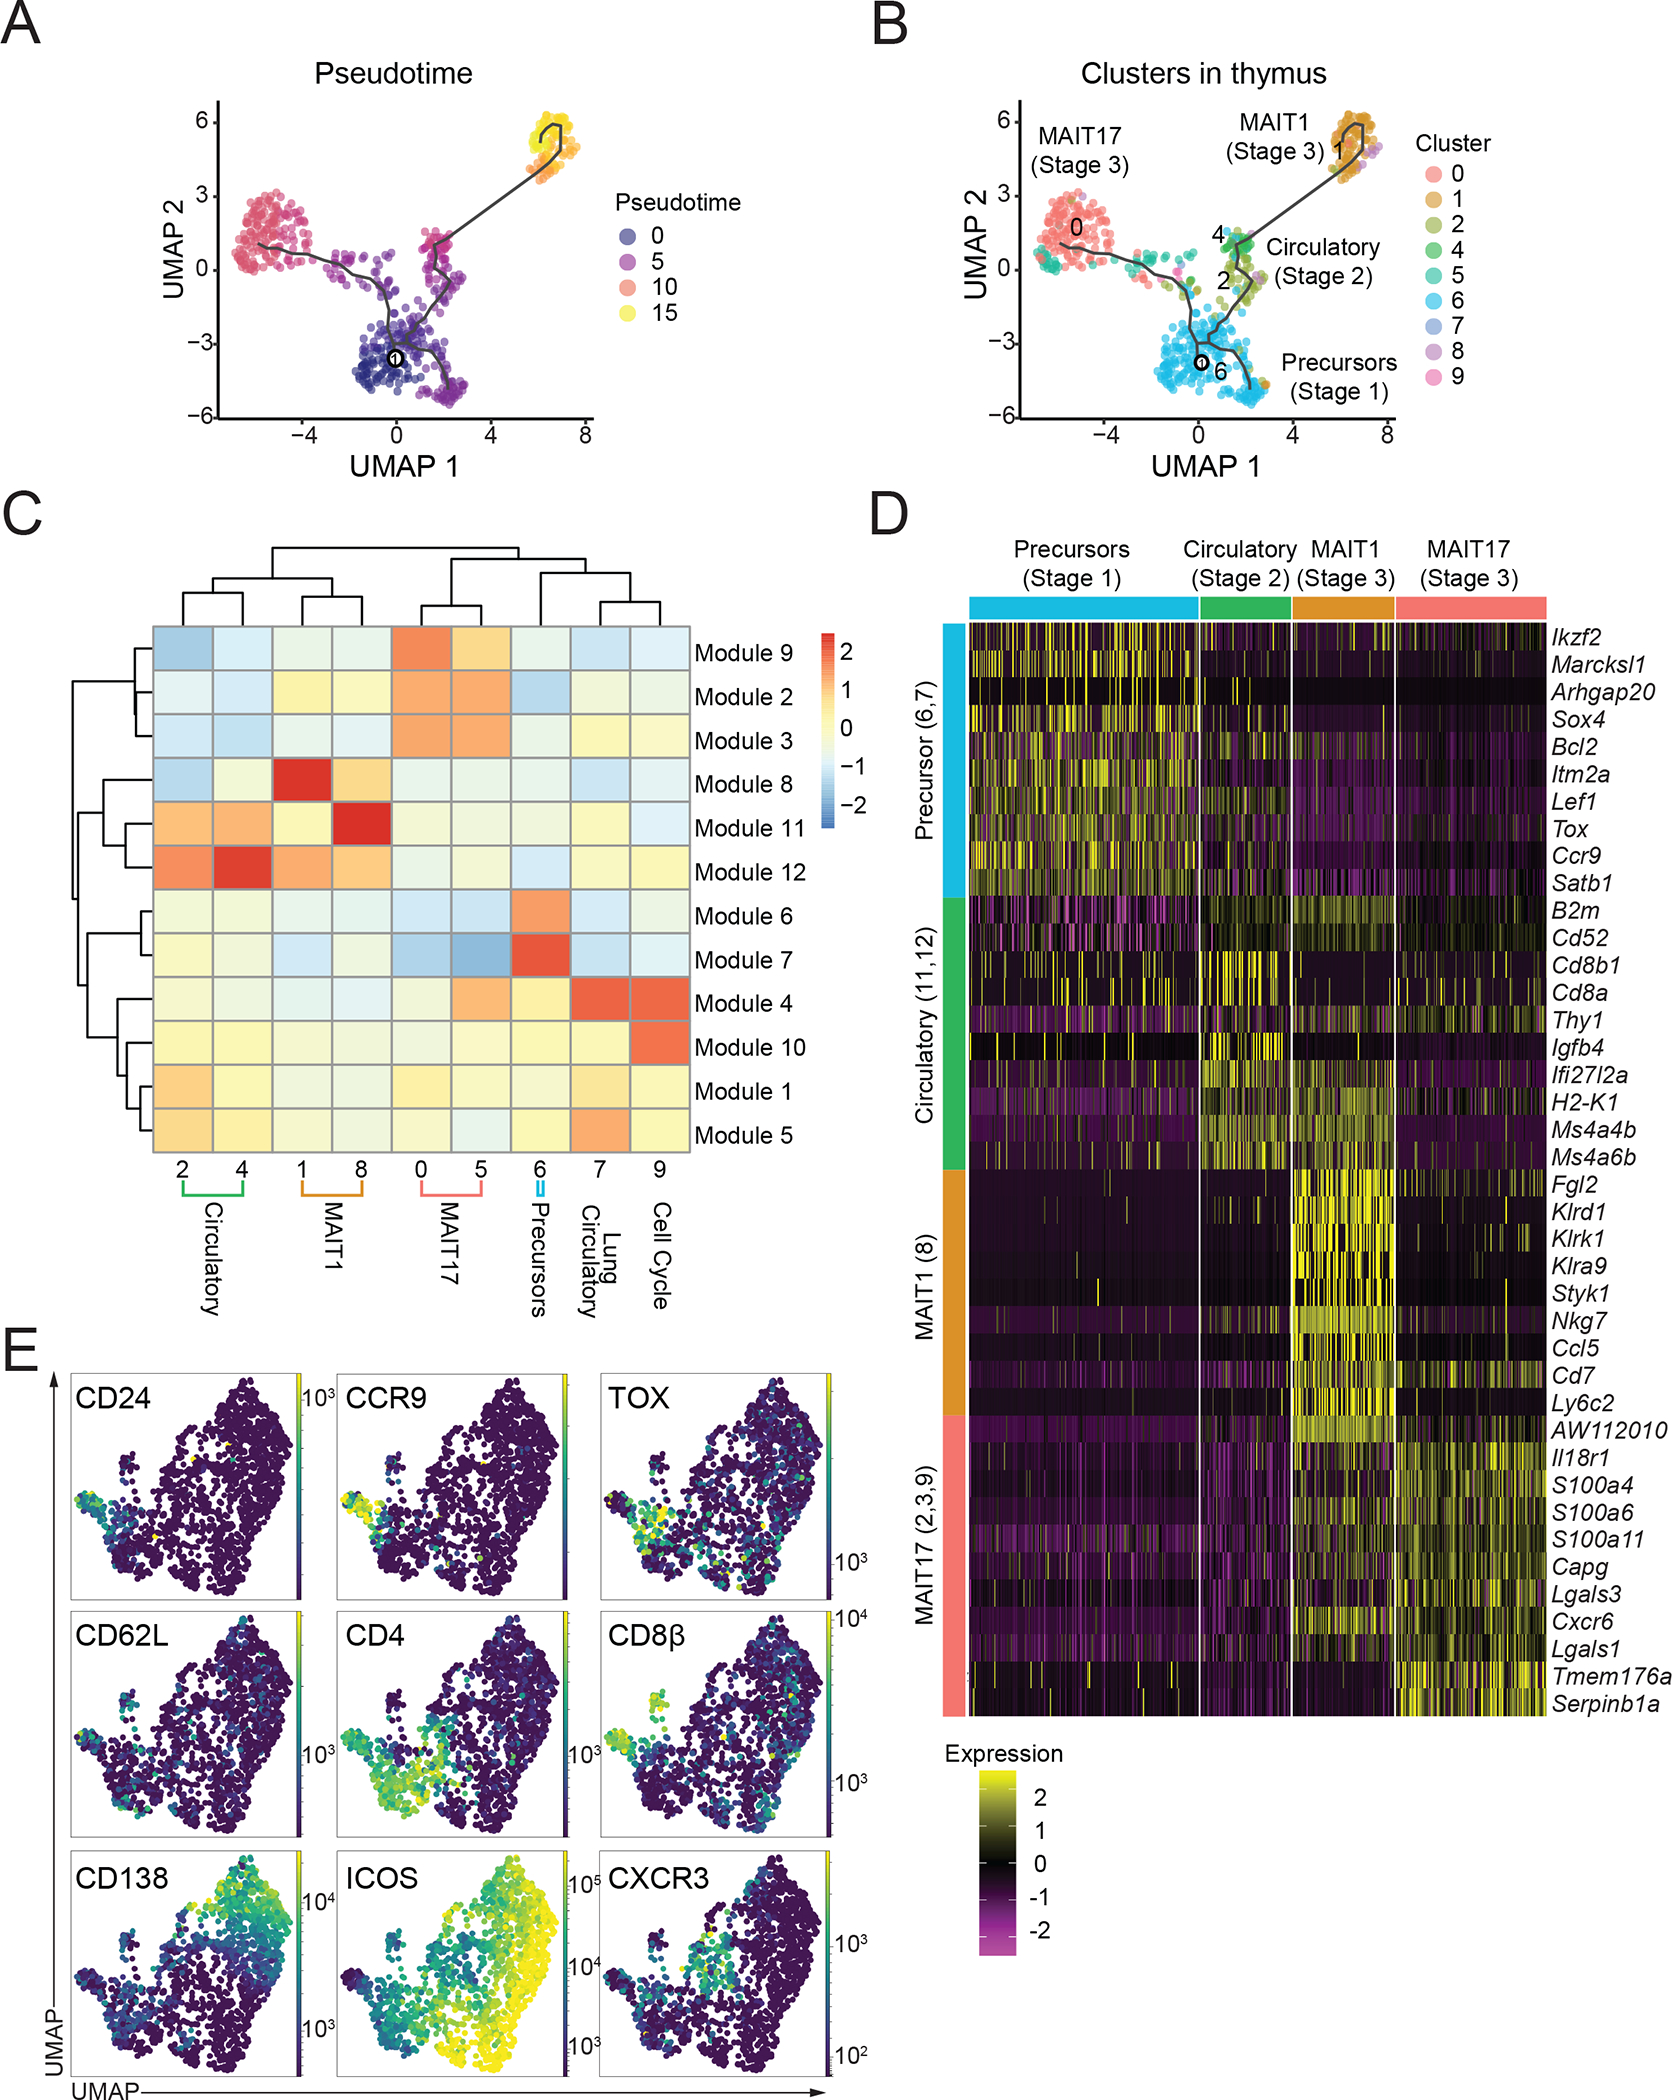
(A) Single-cell trajectories of mouse MAIT thymocytes constructed using Monocle 3. UMAP shows cells colored by pseudotime values along the trajectory. (B) UMAP showing distribution of thymic MAIT cell clusters across branches of single-cell trajectories. Cluster colors and numbers as in Fig 1A. (C) Heatmap showing different stages of thymus MAIT cell differentiation and respective cell clusters on the x-axis and co-regulated gene modules on the y-axis. Modules consist of genes that are differentially expressed along the thymus trajectory path. The legend shows color-coded aggregate scores for each gene module in all the clusters; positive scores indicate higher gene expression. (D) Scaled average expression heatmap of top 10 genes from each thymocyte gene module based on high Morans I value that were expressed in the indicated clusters of MAIT thymocytes. (E) Flow cytometry data were acquired using a panel of 17 different fluorescent parameters. MAIT cell cytometry data from mouse thymus tissue (n=5) were used to perform UMAP dimensional reduction and unsupervised clustering using the FlowSOM algorithm on the OMIQ software. A total of 1,568 MAIT thymocytes from 9-week-old mice were used for the high parameter flow cytometry analysis. All mice were 9-week-old C57BL/6 females.