
Figure 3: CD62L+ MAIT cells are predominantly found in the spleen.
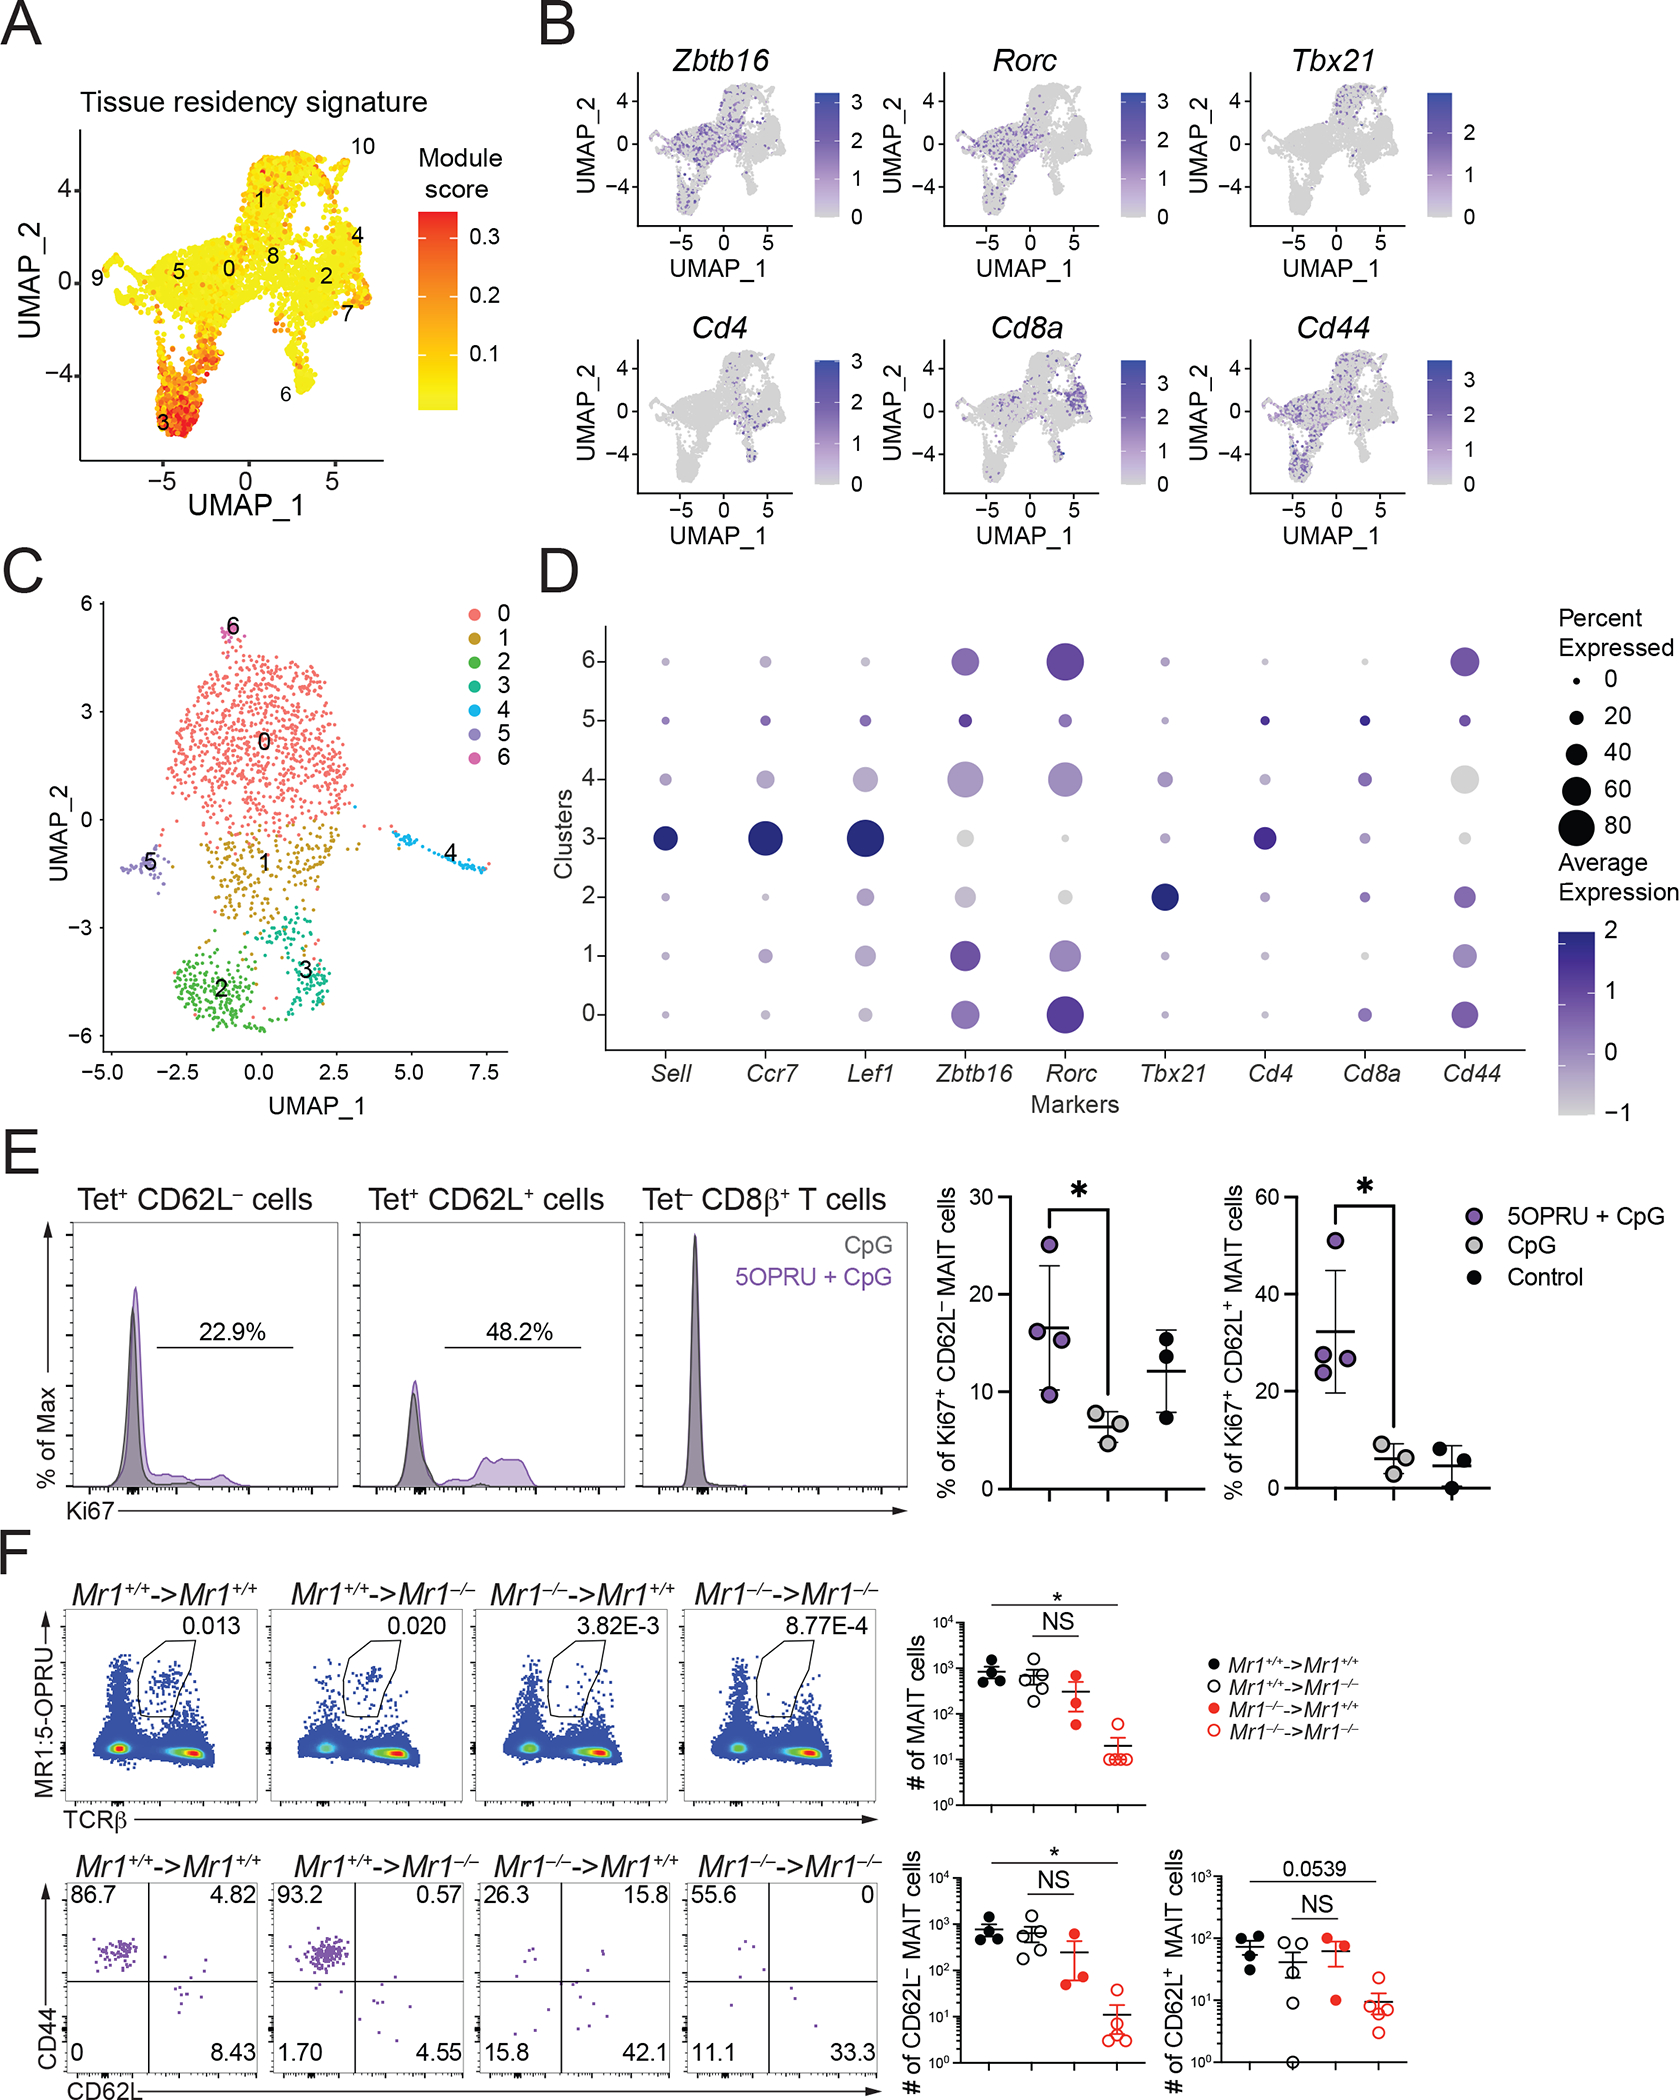
(A) UMAP showing the tissue resident gene expression signature scores from scRNA-seq data from mouse MAIT cells combined from the four liver, lung, spleen and thymus. (B) UMAP feature plots showing expression of key genes in MAIT cells combined from the four organs. (C) UMAP of scRNA-seq dataset of mouse splenic MAIT cells including only cells in which a Trav1 transcript was detected combined from sorted CD62L+ and CD62L− cells. (D) Dot pot of scRNA-seq data from Trav1+ mouse splenic MAIT cells showing expression of key genes in each cluster. (E) C57BL/6 mice were injected at t=0 and t=24h with 5-OP-RU and CpG or CpG alone. Splenic T cells were analyzed for Ki67 expression 48h later. One representative experiment out of two is shown, (F) (top) Number of MAIT cells in the indicated chimeric mice. Donor BM cells were from Mr1+/+ mice (black symbols) or Mr1−/− mice (red symbols); recipients were Mr1+/+ (filled circles) or Mr1−/− mice (open circles). Spleens were harvested after 8 weeks and analyzed by flow cytometry for MR1-tetramer binding cells. (bottom) Expression of CD44 and CD62L on MR1 tetramer-binding spleen cells from chimeric mice. Absolute numbers of CD62L+ and CD62L− tetramer-binding spleen cells are shown. Data analyzed by Kruskal-Wallis with Tukey post-test for multiple comparisons, displayed as mean± SEM, NS: P ≥ 0.05.