
Figure 6: Human MAIT cell metabolic parameters differ from naïve CD8+ T cells.
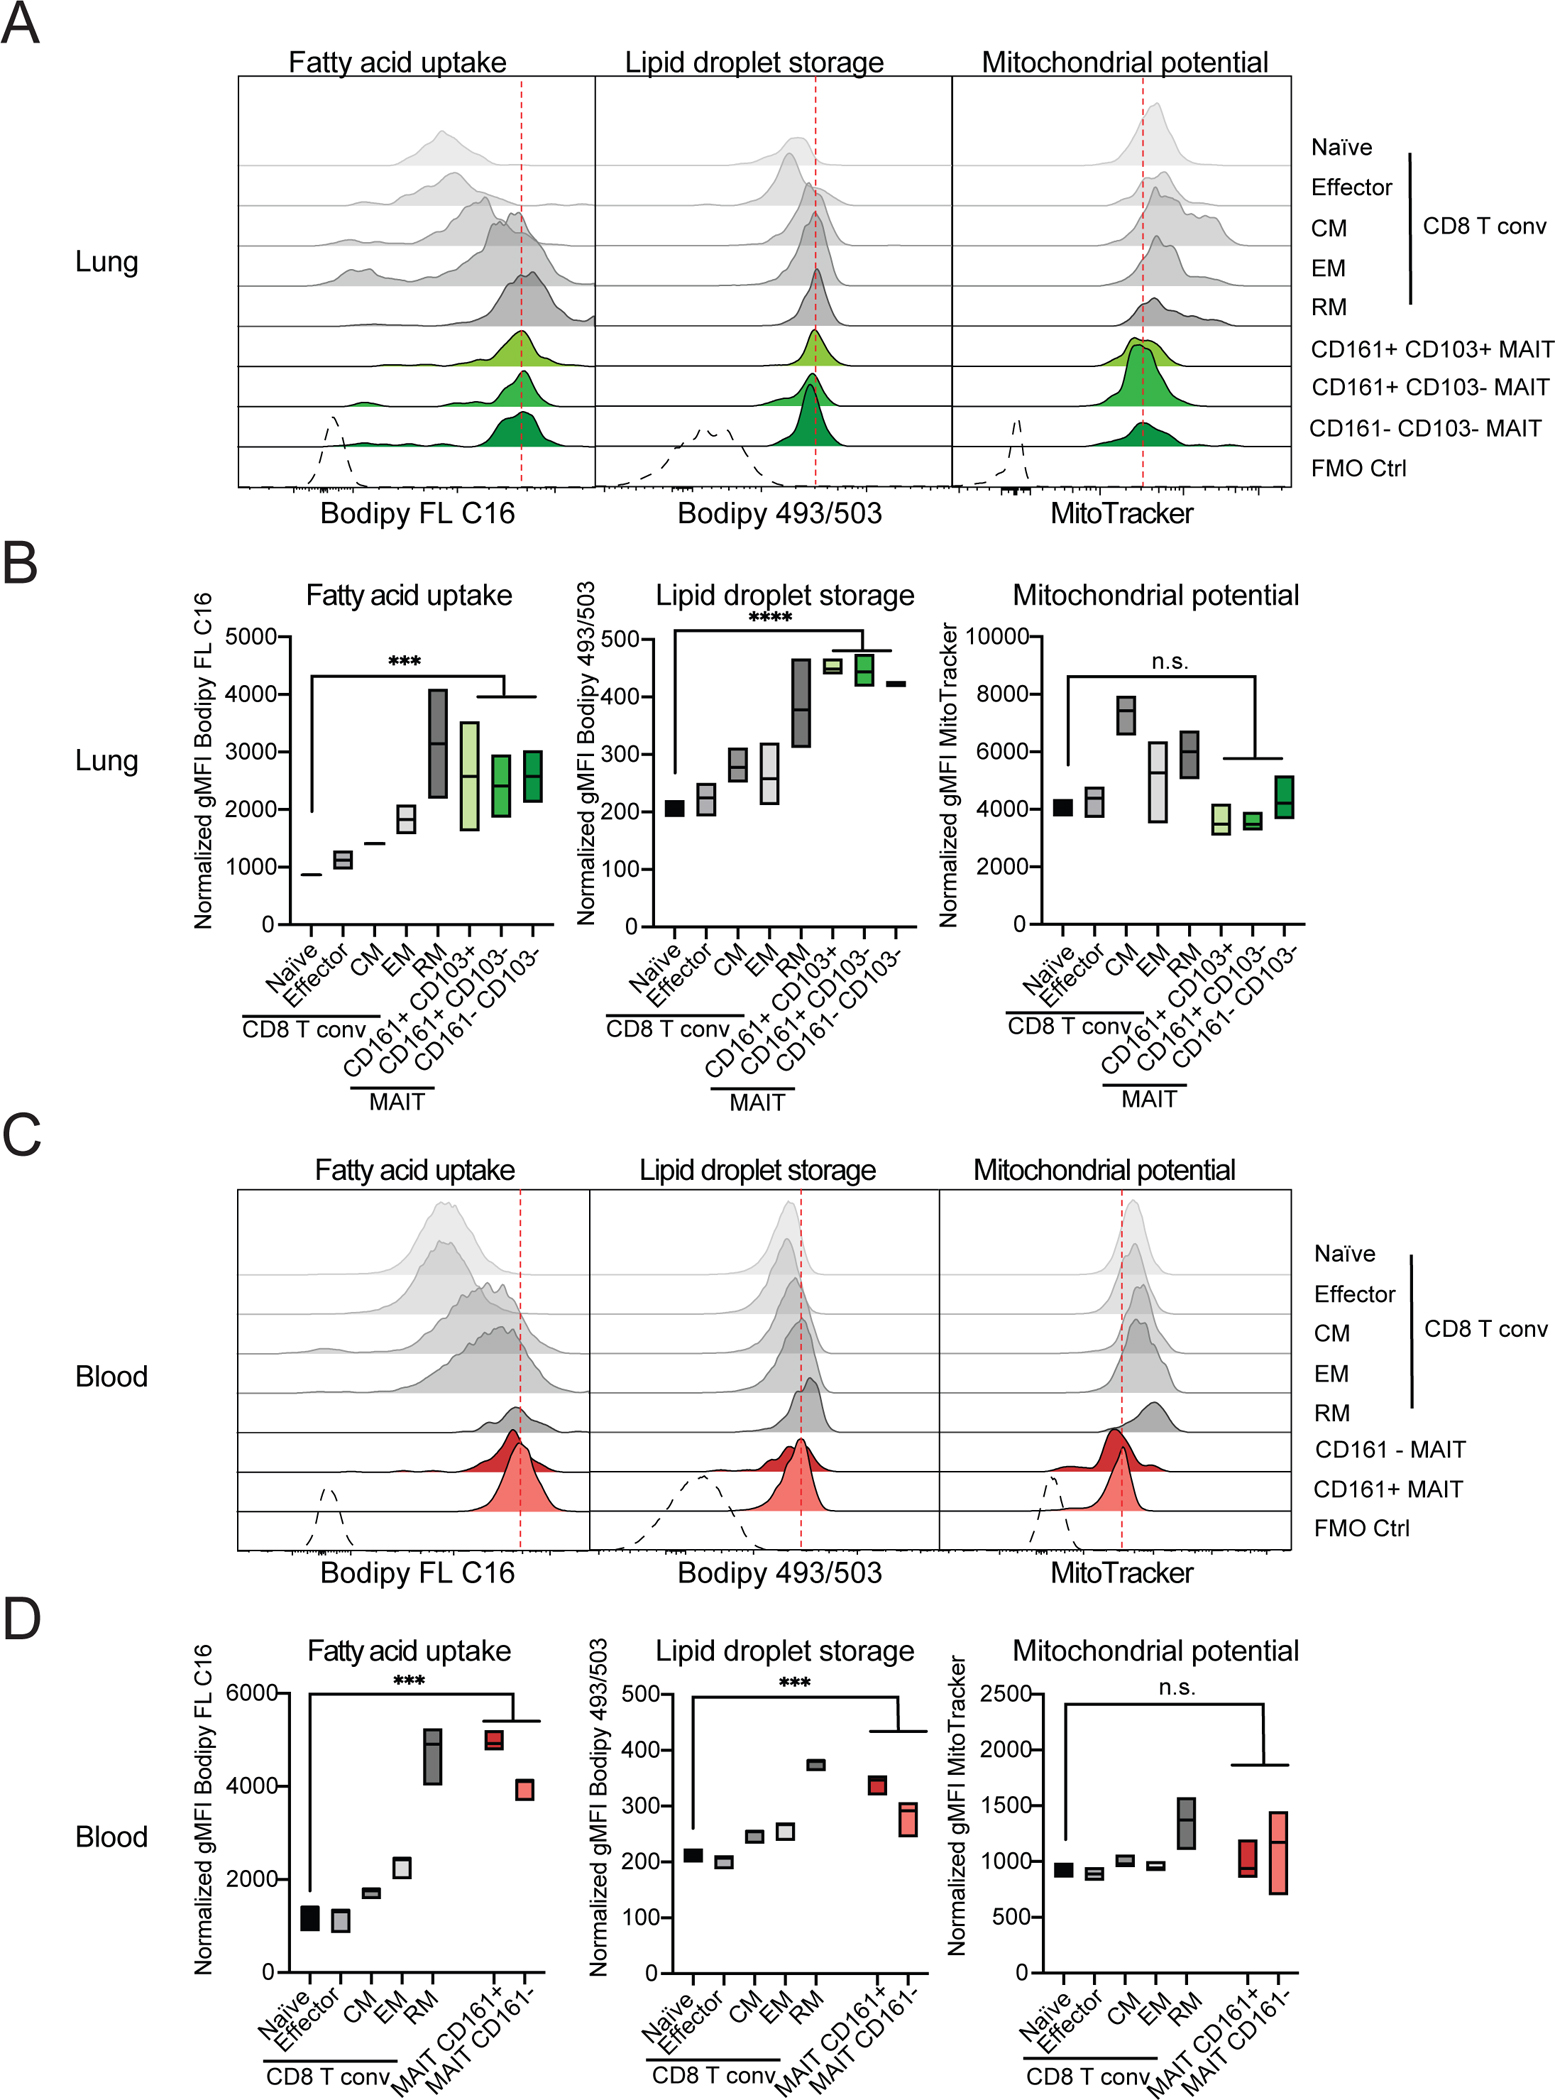
Cells were isolated from paired samples of human lung biopsies (A and B) or blood (C and D) and metabolic parameters were quantified in CD8+ T cell and MAIT cell subsets. TCRβ+ CD8+ T cells excluding MAITs were subdivided into naïve, central memory (CM), effector memory (EM) and resident memory (RM) subsets based on expression of CD45RA, CCR7 and CD103. Representative histograms (A, C) and quantification (B, D) of fatty acid uptake (left) was measured as gMFI of Bodipy FL C16. Neutral lipid droplet content (middle) was measured as gMFI of Bodipy 493/503 fluorescence. Mitochondrial potential is indicated as gMFI of MitoTracker Deep Red FM signal (right). Data combined from 2 experiments and 3 donors (A-B) or from 3 experiments and 3 donors (C-D). Data were analyzed by one-way ANOVA with Dunnett’s post-test for multiple comparisons, displayed as mean ± SEM, *P <0.05, **P <0.01 ***P <0.001 and ****P <0.0001.