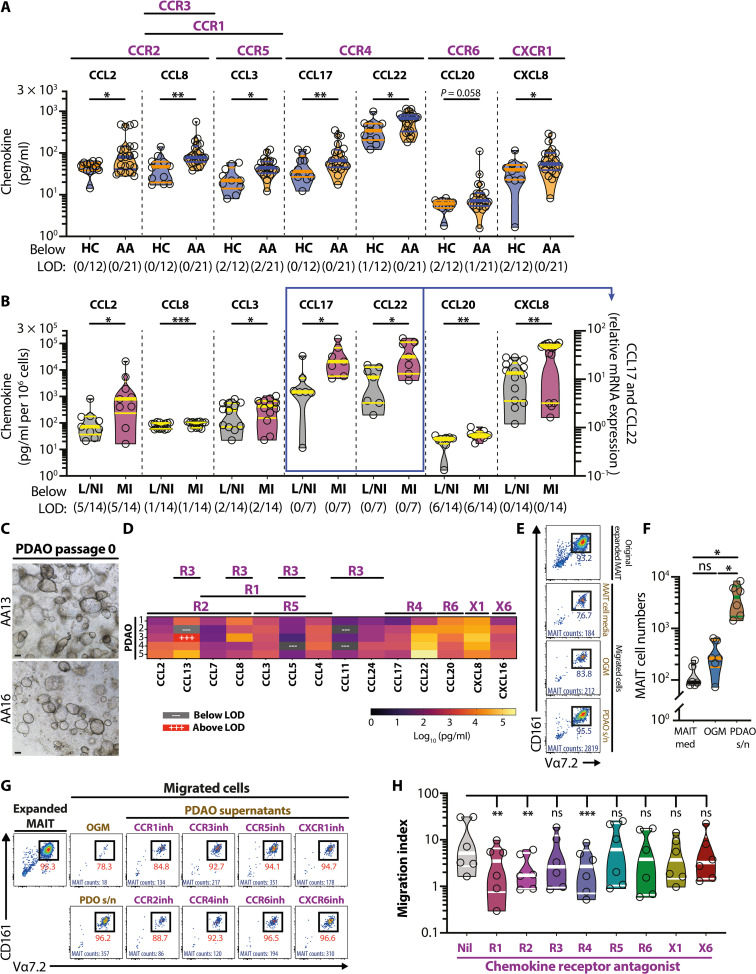
Fig. 6. Elevated appendix-derived chemokines in APA contribute to MAIT cell migration.
(A) The plasma levels of inflammatory chemokines were measured in healthy children (n = 12) and patients with APA (n = 21). (B) The levels of inflammatory chemokines measured in different parts of appendix tissues (n = 7, CCL17 and CCL22; n = 14, all others). (C) Representative bright-field microscopy images of PDAO passage 0 from two patients with APA. (D) Chemokine levels in the supernatants of PDAO passage 0 cultures from five donors. The bead array–based assay was used to determine all chemokine levels, except for CCL17 and CCL22 in (B) where quantitative real-time PCR was used. (E and F) Enumeration of MAIT cell migration toward MAIT cell medium, OGM control, and PDAO culture supernatants. Migrated MAIT cell numbers were enumerated using flow cytometry–based Precision Count Beads. (G and H) Flow cytometry plots (G) and enumeration of MAIT cell transwell migration (H) in the absence or presence of various chemokine receptor antagonists (n = 6). The migration index was defined as the ratio between the number of MAIT cells collected in the bottom chamber in the presence of PDAO supernatants and the number of MAIT cells collected in the bottom chamber in the presence of OGM. Data presented as heatmaps show the mean, whereas truncated violin plots show all data points, median, and quartiles. Statistical significance was determined using Mann-Whitney’s test (A), Wilcoxon’s signed-rank test (B), one-way ANOVA followed by Tukey’s post hoc test (F), or Friedman’s test followed by Dunn’s post hoc test based on the raw, nonnormalized data (H). ***P < 0.001, **P < 0.01, *P < 0.05, L/NI, less/noninflamed; MI, more inflamed; LOD, limit of detection; s/n, supernatant.

