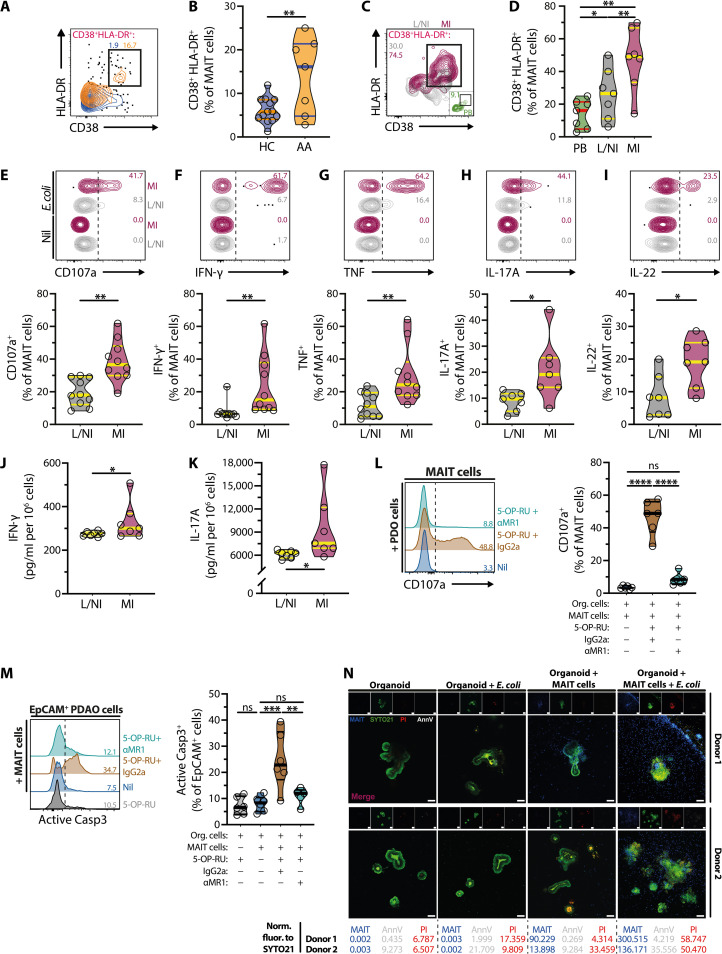
Fig. 7. MAIT cells display proinflammatory and cytotoxic profiles in acute appendicitis and trigger organoid cell death and structural destruction.
(A and B) CD38 and HLA-DR expression in circulating MAIT cells from HC (n = 13) and patients with APA (n = 7). (C and D) CD38 and HLA-DR expression on MAIT cells from circulation (n = 7) and less/noninflamed (n = 7) and more inflamed (n = 7) appendix tissues. (E to I) Levels of CD107a (n = 10) (E), IFN-γ (n = 10) (F), tumor necrosis factor (n = 10) (G), IL-17A (n = 7) (H), and IL-22 (n = 7) (I) in MAIT cells from less/noninflamed and more inflamed appendix tissues following paraformaldehyde-fixed E. coli stimulation. (J and K) IFN-γ and IL-17A levels in supernatants of ex vivo cultures of less/noninflamed and more inflamed appendix tissues (both n = 7). (L and M) CD107a levels on MAIT cells (L) or activated Caspase (Casp) 3 levels on EpCAM+ organoid cells (M) following 3 hours of 2D coculture with untreated (n = 6) or 5-OP-RU–pulsed organoid cells with anti-MR1 mAb (n = 5) or IgG2a isotype control (n = 6). (N) Representative live confocal images from seven independent experiments (n = 4) of CTV-MAIT cells (blue) infiltrating E. coli–pulsed PDAO visualized by SYTO21 (green). Structural destruction of PDAO was observed visually by confocal microscopy, whereas organoid death was assessed by positive annexin V (AnnV, white) and propidium iodide (PI, red) staining. Normalized fluorescence (Norm. fluor.) intensities of CTV (MAIT cells), AnnV, and PI to those of SYTO21 were shown. Data presented as truncated violin plots show all data points, median, and quartiles. Statistical significance was determined using unpaired t test (B), Wilcoxon’s signed-rank test [(E) to (I)], one-way ANOVA followed by Tukey’s post hoc test (D), or mixed-effects analysis followed by Tukey’s post hoc test [(L) and (M)]. ****P < 0.0001, ***P < 0.001, **P < 0.01, *P < 0.05.

