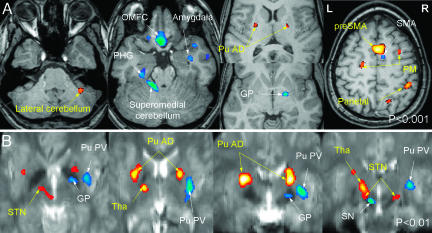
Fig. 2.
Multiple regression analysis between signal variation across all runs of all MR sessions and behavioral variables (errors and reaction times). Activation maps are superimposed to a T1-weighted (Upper) or an EPI (Lower) template. Shown are whole brain (A) (P < 0.001) and basal ganglia (B)[P < 0.01; two axial views (Left) and two coronal views (Right)] analysis showing areas in which signal changes positively correlated with the number of errors (orange scale) and negatively correlated with reaction times (blue scale). Errors were positively correlated with signal changes in areas activated during early learning. Reaction times were negatively correlated with signal changes in areas activated during late learning.

