
Fig. 7.
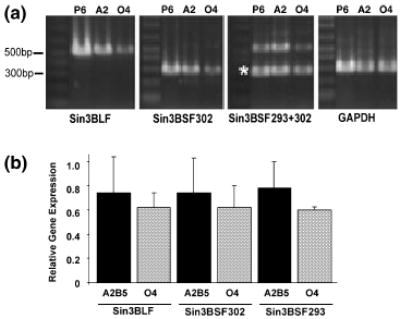
Oligodendrocytes express both the short and long forms of Sin3B. A2B5 + oligodendrocyte progenitors (A2) and O4 + oligo-dendrocytes (O4) were purified using flow cytometry and RNA was extracted for semiquantitative RT–PCR. (a) The linear range of the PCR reaction as determined by the first PCR cycle number detectable by gel electrophoresis is shown. The amplification primer pairs are listed below each gel. The asterisk denotes the Sin3BSF293 band which was amplified when using the Sin3BSF293+302 primers. Whole-brain lysate from postnatal day 6 (P6) mice was used as a positive control. (b) Gel bands were quantified using NIHimage software and the signal was normalized to GAPDH expression. Values are mean ± SEM for two independent experiments.