Abstract
Purpose
To investigate the role of integrin β3 in invasive features of ovarian cancer SKOV3 cells, by comparing different metastatic subclones.
Methods
In the present study, two cell subclones, termed as S1 and S21, which possessed high and low metastatic potential, respectively, were isolated and established from human ovarian cancer parental cell line SKOV3 by the limited dilution method. The expressions of integrin αv, integrin αvβ3, integrin β3, E-cadherin, FAK and ILK in the two cell subclones were compared by means of real-time RT-PCR or flow cytometry. Subsequently, S21 was transfected with siRNA for integrin β3 and the effects of transfection were examined by methyl thiazolyl tetrazolium (MTT) assay, colony formation assay, Matrigel invasion assay and cell migration assay.
Results
The expressions of integrin αvβ3, integrin β3 and E-cadherin were markedly down-regulated in S1; however, there were no significant differences in the expressions of integrin αv, FAK and ILK β. Of note, more than 70% knockdown of integrin β3 expression was obtained by siRNA technique. The integrin β3-siRNA-transfected cells showed significant increases in cell proliferation, cell migration and invasive activity in contrast with the mock-transfected cells. The expressions of integrin αvβ3 and E-cadherin were lower in the integrin β3-siRNA-transfected cells compared to the mock control.
Conclusion
Integrin β3, like E-cadherin, may be also a suppressor gene down-regulating invasive features of ovarian cancer cells in SKOV3 cell subclones.
Keywords: Integrin β3, Cell subclone, Metastasis, Ovarian cancer
Introduction
Integrins are heterodimeric cell surface glycoproteins consisting of α and β subunits (Parise et al. 2000). The 18 α and 8 β subunits combine to form at least 25 different integrins (Tucker 2002). Since their function as key surface adhesion and cell signaling receptors, integrins influence growth factor signaling, cell survival, proliferation and migration, and may play a major role in tumor behavior and metastasis (Arnaout 2002). Because the cytoplasmic tails of β3 integrins are short and lack enzymatic activity, it is necessary for them to associate with cytoplasmic adapter proteins to mediate the transduction of signals (Geiger et al. 2001). The prominent signaling proteins in integrin outside-in signaling are focal adhesion kinase (FAK) and integrin linked kinase (ILK) (Mitra and Schlaepfer 2006; Legate et al. 2006). There are two members in the β3 integrin family, i.e., αIIbβ3 and αvβ3. The former is a receptor expressed mainly on the surface of platelets and their precursors, megakaryocytes (Kasirer-Friede et al. 2007), while the latter is expressed on the surface of endothelial cells, smooth muscle cells, monocytes and platelets (Switala-Jelen et al. 2004). Altered expressions of αIIbβ3 and αvβ3 during tumor growth and progression have been suggested as key determinants in cancer development and progression (Kallio et al. 2006; Bauer et al. 2007; Neto et al. 2007).
E-cadherin, a cell adhesion molecule, is a 97-kDa transmembrane glycoprotein coded by the CDH1/E-cadherin gene located in chromosome 16q22.1. It plays a key role in calcium-dependent cell-to-cell junctional adherence. This adhesion depends on the association with catenins, cytoplasmic proteins that bind the E-cadherins to the cytoskeleton. Loss of function is thought to contribute to progression in cancer by increasing proliferation, invasion and metastasis (Lewis et al. 1994; Knudsen et al. 1995; Kee and Steinert 2001). In ovarian cancer, E-cadherin is identified as a candidate suppressor gene for metastasis (Wu et al. 2008; Voutilainen et al. 2006; Horiuchi and Konishi 2004).
Ovarian cancer is the leading cause of death from gynecological malignancies (Jemal et al. 2007). Recent annual worldwide figures reflect 204,000 new cases of ovarian cancer and 125,000 deaths (Parkin et al. 2005). Most patients with ovarian cancer are diagnosed at advanced stages, so the conventional therapy is less effective and the 5-year survival rate remains approximately 20–30% for advanced-stage disease (Brun et al. 2000). Tumor recurrence and metastasis are still the major reasons for poor clinical outcome. Cell adhesion molecules have been proved to be involved in the metastasis of ovarian cancer. Of these molecules, integrin β3 has generated considerable interest in ovarian cancer researches. Most data have demonstrated that integrin β3 increases ovarian cancer risk (Jakubowska et al. 2007; Bojesen et al. 2005; Hapke et al. 2003; Carreiras et al. 1999; Liapis et al. 1997); however, there are still opposite opinions regarding this subject (Brüning et al. 2001). So, we carried out a study on the possible role of integrin β3 in the invasive ability of ovarian cancer and validated the function of E-cadherin in metastasis, using cell subclones with little heterogeneity and different metastatic potentials.
According to Fidler’s theory of tumor cell heterogeneity (Fidler and Kripke 1977), using the limited dilution method, we isolated and established two cell subclones, with high and low metastatic potentials, respectively, derived from human ovarian cancer parental cell line SKOV3. They had little heterogeneity and were more suitable for comparative researches. The expressions of integrin αv, integrin αvβ3, integrin β3, E-cadherin, FAK and ILK between the two cell subclones were compared by real-time RT-PCR or flow cytometry. We found that the expressions of integrin αvβ3, integrin β3 and E-cadherin were markedly down-regulated in the high metastatic subclone. Using siRNA technique, we concluded that integrin β3, like E-cadherin, might be also a suppressor gene down-regulating invasive features of ovarian cancer cells in SKOV3 cell subclones.
Materials and methods
Materials
Boyden chambers and Matrigel were purchased from BD Biosciences (Bedford, MA). RPMI-1640, Dulbcco’s Modified Eagle Medium (DMEM), fetal bovine serum (FBS), trypsin-EDTA and penicillin streptomycin were purchased from Gibco BRL (Rockville, MD, USA). A total of 24-well and 96-well plates were purchased from TPP (Trasadingen, Switzerland). 3-(4,5-Dimethylthiazol-2-yl)-2,5-diphenyl tetrazolium bromide (MTT) and dimethylsulfoxide (DMSO) were purchased from Sigma (St. Louis, MO). All fluorescein isothiocyanate (FITC)-conjugated monoclonal antibodies (mAbs) including anti-integrinαvβ3, anti-integrin αv, anti-integrin β3 and anti-E-cadherin were all purchased from BD Biosciences Pharmingen (San Jose, CA, USA).
Cell lines and culture
SKOV3 and NIH3T3 cell lines were purchased from Cell Bank of Shanghai Institute for Biological Sciences, Chinese Academy of Sciences. Cells were cultured in RPMI-1640 or DMEM supplemented with 10% FBS and antibiotics (100 U/ml of penicillin and 100 μg/ml of streptomycin) at 37°C in a humidified 5% CO2 incubator.
Isolation of SKOV3 cell subclones
SKOV3 cells at log phase were collected and adjusted to a density of 10/ml with RPMI-1640 and seeded into a 96-well plate (0.1 ml/well). The 96-well plate was observed under a microscope, and then a marker was made on the well containing a single cell. After being cultured for 2 ~ 3 weeks at 37°C and 5% CO2 condition, a good clone was selected and amplified. The electrophoretic migration rates of these subclones were measured with the cell electrophoretic instrument (DY-100, from College of Life Science, Shandong University, China). A total of 15 cells/subclone were measured and the average figured out. All data were expressed as mean ± standard deviation.
Growth curves of SKOV3 cell subclones
SKOV3 cell subclones at log phase were collected and planted into a 24-well plate (1 × 10⁴/well). Each SKOV3 subclone was repeated for 18 parallel wells and cultured at 37°C and 5% CO2 condition. Three wells were taken out every day, the numbers of cells (three wells) were counted and the average figured out for 6 consecutive days. Then, growth curves were drawn out according to the average every day.
MTT assay
MTT assay was carried out in 96-well plate. The cells (2 × 10³) were seeded into each well and incubated at 37°C for 5 days. Three wells were taken out every day. To each well, 20 μl MTT (5 mg/ml MTT in PBS) was added and incubated at 37°C and 5% CO2 condition for 4 h, then the liquid was removed and 200 μl DMSO was added to dissolve the formazan crystals. The optical absorbance at 570 nm was read with a microplate reader (Molecular Devices SpectraMax M2, USA).
Colony formation assay
In a 24-well plate, 500 μl 2 × DMEM supplemented with 20% FBS was mixed with 500 μl 1.2% Sea Plague agar and solidified; 25 μl cells (5 × 10³/ml) were mixed with 500 μl 2 × DMEM and 500 μl 0.7% agar, overlaid on the bottom gel, allowed to set at room temperature and then grown at 37°C, in a 5% CO2 humidified incubator for 8 days. Colony formation was monitored under a microscope, and ten cells or more in a cluster were defined as a colony. For each subclone, the assay was repeated four times. The colony numbers of four wells were counted and the average figured out. All data were expressed as mean ± standard deviation.
Matrigel invasion assay and cell migration assay
Matrigel invasion assay was performed as described by Albini et al. (1987), using modified Boyden chambers. Polyvinylpyrrolidone-free polycarbonate (PVPF) filters of 8.0 μm pore size were coated with 50 μl Matrigel diluted 1:3 by serum-free RPMI-1640 and placed in Transwell chambers. Cells (0.2 × 10⁶) were suspended in RPMI-1640 with 10% FBS and seeded into the upper chambers of Matrigel-coated Transwell plates. Serum-free DMEM used for NIH3T3 culture was filtered and added to the lower chamber as chemotactic factor, then incubated at 37°C for 24 h. Non-invading cells remaining on the upper surface of the filter were removed, and the cells that appeared on the lower surface of the filter were fixed with 75% ethanol for 30 min, stained with hematoxylin and eosin (HE), and counted in five random high-power fields (HPF) under an inverted microscope (Nikon Eclipse). Cell migration assay was also performed using the Transwell chamber as described above. The only difference was that the filters were not Matrigel-coated. For each experimental condition, the assay was performed at least in triplicates. The invading cell numbers of the three Boyden chambers were counted and the average figured out. All data were expressed as mean ± standard deviation.
Tumor xenografts in nude mice
BALB/C-nu/nu nude mice were purchased from National Resource Center for Rodent Laboratory Animal of China. Forty 5-week-old female nude mice were randomly divided into two groups with 20 in each. Ten mice were injected subcutaneously with 5.0 × 10⁶ cells of a different cell subclone and the other ten mice were injected through the tail veins with the same cells once a week for 3 consecutive weeks. The mice were maintained in a sterile animal facility and monitored for tumor growth. After 3 months, the mice were killed and the tumor and lung were dissected and examined histologically. Paraffin sections of the lung tissues (10 mice/subclone) were made, stained with HE and observed under a microscope. The tumor volumes (length × width2 × 0.25, 10 mice/subclone) were measured and the average figured out. The average values were expressed as mean ± standard deviation. This animal experiment was approved by the Institutional Animal Care and Use Committee and was in compliance with all regulatory guidelines.
Flow cytometry analysis
Cell subclones at log phase were collected and adjusted to a density of 1 ~ 5×10⁶/ml with PBS and then stained with 20 μl mAb for 30 min at 25°C. Finally, the stained subclones were analyzed by a flow cytometer (Beckman Coulter, USA) equipped with laser. Approximately, 10,000 cells were acquired per sample. Data analysis was carried out using the program WinMDI. The test was performed in quadruplicates. All data were expressed as mean ± standard deviation.
Real-time RT-PCR analysis
Total RNA was isolated in Trizol (Invitrogen), and template cDNA was synthesized from total RNA using the Revertaid™ first strand cDNA synthesis kit (Fermentas). Quantitative real-time PCR analysis was performed using the ABI PRISM® 7500. The cDNA product was amplified in a 20 μl reaction containing a 10 μl power SYBR® green PCR master mix (ABI) and 1 μl of each primer (5 mM). The following primers were employed:
Integrin αv 5′-GGAGCAATTCGACGAGCACT-3′
5′-TTCATCCCGCAGATACGCTA-3′
E-cadherin 5′-CCTGCCAATCCCGATGAA -3′
5′-TCAGACTAGCAGCTTCGGAACC-3′
integrin β3 5′-TTCAATGCCACCTGCCTCAA-3′
5′-TTGGCCTCAATGCTGAAGCTC-3′
β-actin 5′-CCACGAAACTACCTTCAACTCCA-3′
5′-GTGATCTCCTTCTGCATCCTGTC-3’
FAK 5′-CATGGCTGGCAGCATCTATC-3′
5′-TCCCTCGCAGGTCCAATAC-3′
ILK 5′-CCAATGTCCTGGTCGCATGTA-3′
5′-CGTGTCACCAGTTCCCACAGA-3′
siRNA transfection.
Silence® Validated siRNA ITGB3 (siRNA ID#: 112581), Silencer® beta-actin siRNA control and siPORT™ NeoFX™ transfection agent were all purchased from Ambion. Silencer control siRNA was used to develop and optimize siRNA experiments. The subclone cells were trypsinized and diluted in RPMI-1640, then maintained at 37°C while the transfection complexes were prepared. A volume of 1 μl siPORT NeoFX was diluted into Opti-MEM I reduced serum medium to 25 μl. Next, the small RNA were diluted into Opti-MEM I serum free medium to a final concentration of 10nM and then the diluted siPORT NeoFX and siRNA were combined. The formed transfection complexes were incubated for 10 min at room temperature and then dispensed into the empty wells of a 24-well culture plate. The cells prepared were pipetted into the culture plate wells containing the transfection complexes of 4.5 × 10⁴ cells per well. The cells were incubated under their normal growth conditions and monitored for gene silencing 48 h after transfection by real-time RT-PCR and flow cytometry. Then MTT assay, colony formation assay, Matrigel invasion assay and cell migration assay were performed after transfection.
Statistical analysis
Mean values were compared for statistical significance using a two-tailed unpaired t-test. Statistical significance was defined as a P value of less than 0.05. Statistical analysis was performed by SPSS 13.0 software package.
Results
Establishment of a high-metastatic subclone S1 and a low-metastatic subclone S21
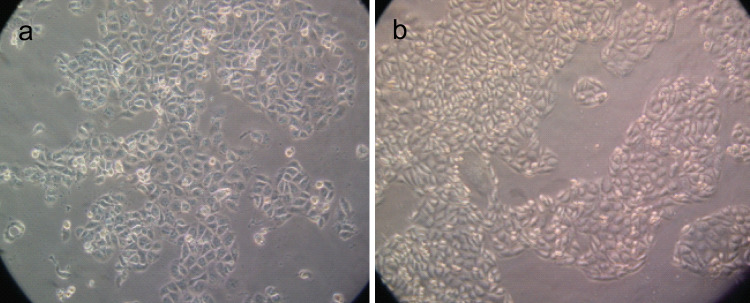
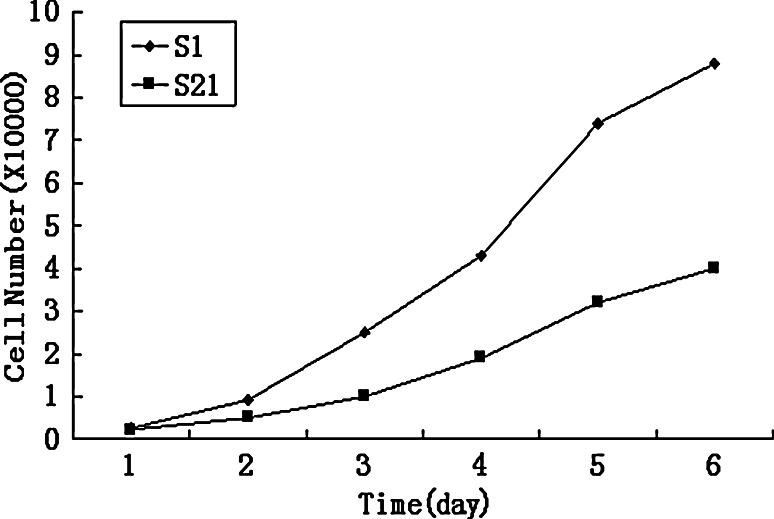
A total of 21 cell subclones were obtained by the limited dilution method and named from SKOV3-S1 to SKOV3-S21. According to the electrophoretic migration rates of the 21 cell subclones, we selected S1 subclone that had the highest migration rate (18.09 ± 1.04 μm/s; mean ± SD; 15 cells/subclone) and S21 subclone that had the lowest migration rate (10.64 ± 0.81 μm/s; mean ± SD; 15 cells/subclone). The morphology of the two subclones is shown in Fig. 1. S21 was largely different from S1, i.e., frequently arrayed regularly like cobbles. S1 showed higher proliferation and invasive activity than S21. The growth ability in vitro of S1 and S21 is shown in Fig. 2. The growth rate of S21 was slower than S1. In colony formation assay, the number of colonies formed on agarose by S1 (33.80 ± 3.96; mean ± SD; quadruplicate determinations) was significantly higher than that formed by S21 (8.00 ± 1.58; mean ± SD; quadruplicate determinations; P < 0.01). In Matrigel invasion assay, the average cell count invading Matrigel-coated membrane in one HPF was 133.80 ± 15.80 (mean ± SD; triplicate determinations)for S1 and 31.20 ± 13.77 (mean ± SD; triplicate determinations) for S21 (P < 0.01). In cell migration assay, the average cell count crossing PVPF filter of 8.0 μm pore size in one HPF was 250.80 ± 27.99 (mean ± SD; triplicate determinations) for S1 and 133.80 ± 15.80 (mean ± SD; triplicate determinations) for S21 (P < 0.01). In transplantation assay, the tumor-forming rate of S1 group was 100% and that of S21 group 20%. The tumor volume of S1 group was 6.42 ± 2.04 cm3, whereas that of S21 group only 0.52 ± 0.13 cm3. S21 group had no lung metastasis; however, the lung metastasis rate of S1 group was 70%. In conclusion, S1 has higher metastatic potential; however, S21 has lower metastatic potential.
Fig. 1.
The morphology of S1 (Fig. 1a) and S21 (Fig. 1b). S1 and S21 were derived from human ovarian cancer parental cell line SKOV3 by limited dilution method and possessed high and low metastatic potential, respectively
Fig. 2.
Growth curves of SKOV3 cell subclones. The growth rate of the lower metastatic subclone S21 was slower than that of the higher metastatic subclone S1
The expressions of integrin αv, integrin αvβ3, integrin β3, E-cadherin, FAK and ILK in subclone S1 and S21
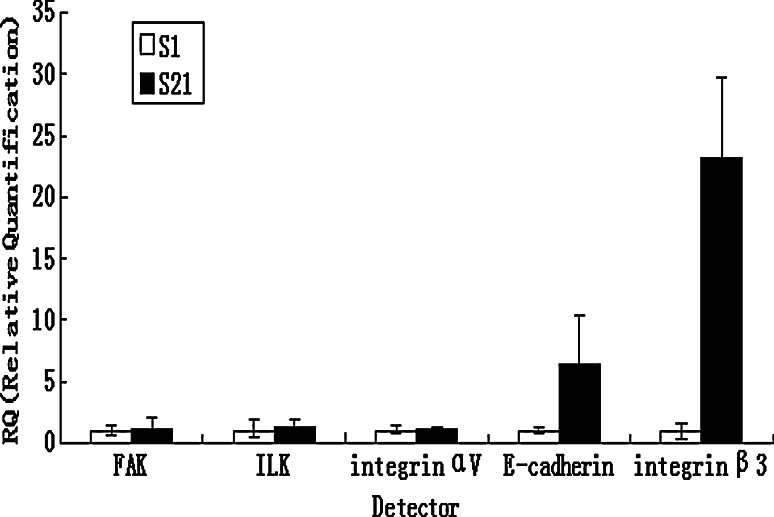
Using flow cytometry, the expressions of integrin αvβ3, integrin β3 and E-cadherin were higher in low-metastatic subclone S21 than in high-metastatic subclone S1 (Table 1). We also examined integrin αv, integrin β3, E-cadherin, FAK and ILK gene expression by real-time RT-PCR. There was no significant difference in the expressions of integrin αv, FAK and ILK between S1 and S21 subclone, and a marked elevation in the mRNA level of integrin β3 and E-cadherin in low-metastatic subclone S21(Fig. 3).
Table 1.
Flow cytometric analysis of subclones
| Group | Percent positive cells (mean ± SD; quadruplicate determinations) | P | |
|---|---|---|---|
| S1 | S21 | ||
| Integrin αv | 98.25 ± 5.31 | 97.31 ± 4.35 | >0.05 |
| Integrin β3 | 1.40 ± 0.09 | 78.51 ± 5.21 | <0.01 |
| Integrin αvβ3 | 24.87 ± 4.85 | 85.21 ± 3.54 | <0.01 |
| E-cadherin | 17.58 ± 6.15 | 83.31 ± 3.47 | <0.01 |
Fig. 3.
Expressions of integrin αv, integrin β3, E-cadherin, FAK and ILK in subclone S1 and S21. The expressions of integrin αv, integrin β3, E-cadherin, FAK and ILK were examined by real-time RT-PCR; there was no significant difference in expressions of integrin αv, FAK and ILK between subclone S1 and S21, and a marked elevation in the mRNA level of integrin β3 and E-cadherin in low-metastatic subclone S21
Effects of the knock-down of integrin β3 on the properties of S21 subclone
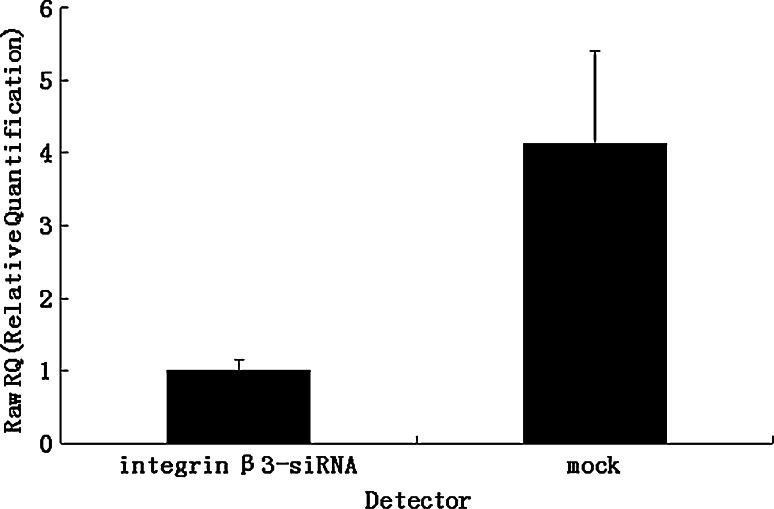
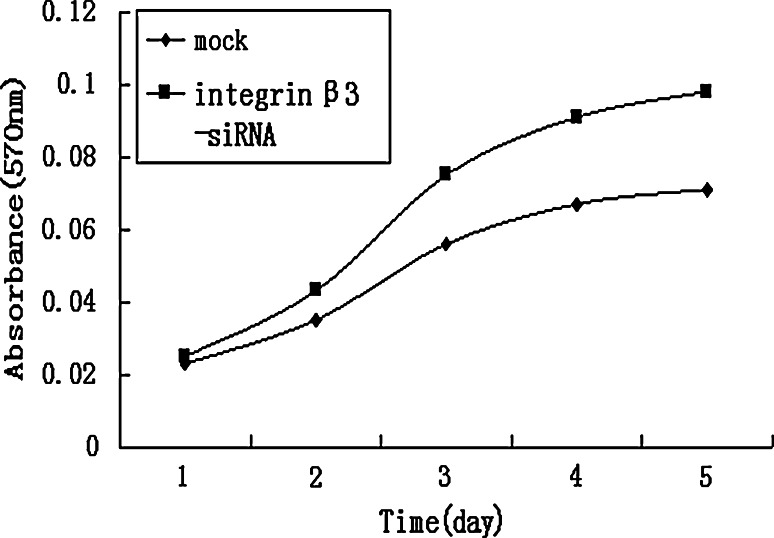
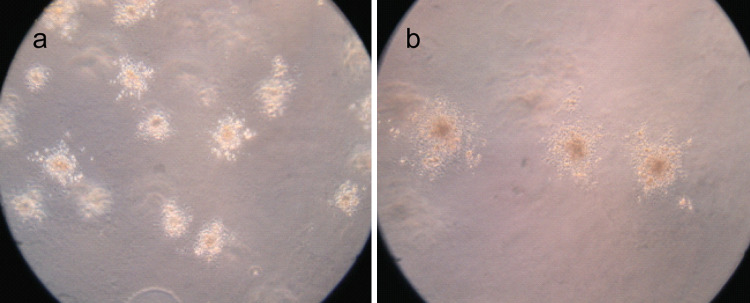
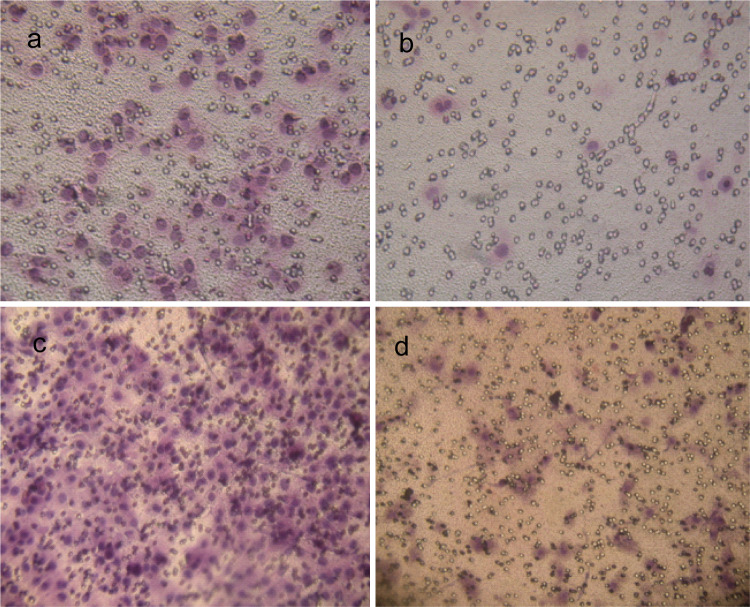
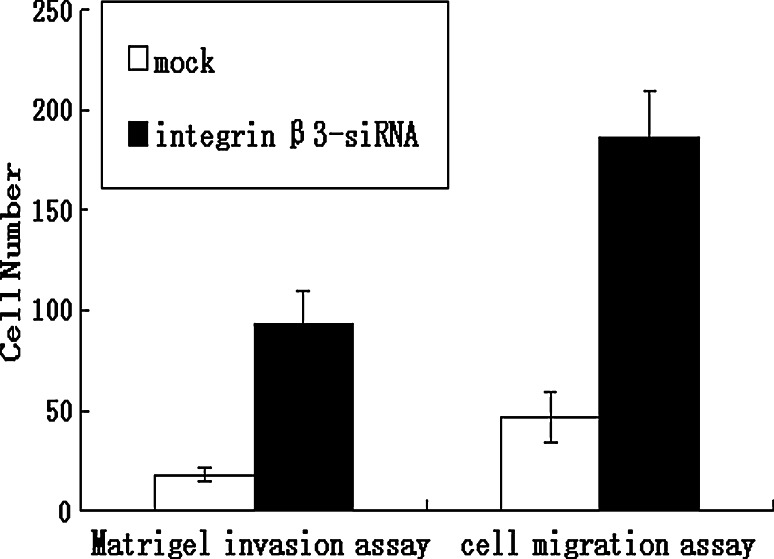
The expression of integrin β3 was suppressed by knock-down with the siRNA technique, as shown in Table 2 and Fig. 4. Using flow cytometry and real-time RT-PCR, we found that mRNA and protein levels of integrin β3 was reduced in the transfected cells (integrin β3-siRNA) to approximately 30% of that in the mock-transfected cells. Using the transient transfected cells with this siRNA, the effects of knock-down of integrin β3 were examined. In MTT assay, integrin β3-siRNA-transfected cells showed significant increases in cell proliferation from day 2 to day 5 after the siRNA transfection (Fig. 5). In colony formation assay (Fig. 6a, b), the number of colonies on agarose formed by integrin β3-siRNA-transfected cells (24.80 ± 4.56; mean ± SD; quadruplicate determinations) was significantly higher than that formed by mock-transfected cells (6.53 ± 1.45; mean ± SD; quadruplicate determinations; P < 0.01). In Matrigel invasion assay (Fig. 7a, b), the average cell counts invading Matrigel-coated membrane in one HPF was 93.21 ± 16.56 (mean ± SD; triplicate determinations) for integrin β3-siRNA-transfected cells and 18.07 ± 3.34 (mean ± SD; triplicate determinations) for mock-transfected cells (P < 0.01). In cell migration assay (Fig. 7c, d), the average cell counts crossing PVPF filter of 8.0 μm pore size in one HPF was 186.75 ± 22.43 (mean ± SD; triplicate determinations) for integrin β3-siRNA-transfected cells and 46.52 ± 12.36 (mean ± SD; triplicate determinations) for mock-transfected cells (P < 0.01). In conclusion, the cell migration and invasive activity of S21 transfected with integrin β3 siRNA was higher than that of mock-transfected cells (Fig. 8).
Table 2.
Flow cytometric analysis of mock control and integrin β3-siRNA-transfected cells
| Group | Percent positive cells (mean ± SD; quadruplicate determinations) | P | |
|---|---|---|---|
| Mock | Integrin β3-siRNA-transfected cells | ||
| Integrin β3 | 73.21 ± 4.12 | 22.54 ± 3.87 | <0.01 |
| Integrin αvβ3 | 87.65 ± 5.71 | 36.47 ± 4.63 | <0.01 |
| E-cadherin | 85.49 ± 6.87 | 28.21 ± 3.51 | <0.01 |
Fig. 4.
Knock-down of integrin β3 expression in S21. The expression of integrin β3 was analyzed by real-time RT-PCR. More than 70% knock-down of integrin β3 expression was obtained by siRNA transfection
Fig. 5.
Effects of the knock-down of integrin β3 on cell proliferation. The proliferation of integrin β3-siRNA cells in vitro was examined by MTT assay. Integrin β3-siRNA-transfected cells showed significant increases in cell proliferation from day 2 to day 5 after the siRNA transfection
Fig. 6.
Colony formation assay. The colonies formed by integrin β3-siRNA-transfected cells are shown in Fig. 6a and the colonies formed by mock-transfected cells are shown in Fig. 6b. For each subclone, the assay was repeated four times
Fig. 7.
Matrigel invasion assay and cell migration assay. The images of cells invading Matrigel-coated membrane in integrin β3-siRNA-transfected group and in mock control are shown in Fig. 7a and b, respectively. The images of cells crossing PVPF filter of 8.0 μm pore size in integrin β3-siRNA-transfected group and in mock control are shown in Fig. 7c and d, respectively. For each experimental condition, the assay was performed at least in triplicate
Fig. 8.
Effects of the knock-down of integrin β3 on cell migration and invasive activity. The cells that appeared on the lower surface of the filter were fixed with 75% ethanol for 30 min, stained with HE and counted in HPF. The data were obtained from at least three independent experiments
Changes of integrin αvβ3 and E-cadherin in integrin β3-siRNA-transfected cells
Changes of integrin αvβ3 and E-cadherin were examined by flow cytometry in integrin β3-siRNA-transfected cells (Table 2). The expressions of integrin αvβ3 and E-cadherin were lower in the integrin β3-siRNA-transfected cells compared to the mock control.
Discussion
Integrins are able to mediate adhesive events during various cancer stages such as malignant transformation, tumor growth and progression, and invasion and metastasis. A cell phenotype that results from malignant transformation may contain several alterations in cell adhesion receptors. Altered expression of various integrins during tumor growth and progression has been described (Robertson et al. 2008; Grzesiak et al. 2007; D’Abaco and Kaye 2007; Le Tourneau et al. 2007).There are two reports that describe quite opposite opinions about integrin β3. In some cases, an overexpression of integrin β3 appears to be correlated with tumorigenicity. For example, Integrin beta3 and VEGF expression could synergistically enhance tumor angiogenesis and might play a crucial role in invasion and metastasis of gastric carcinoma (Li et al.2008). The presence of β3 integrin in MDA-MB-231 breast cancer cells induced an increased MMP-2 expression and activity that might contribute to the enhanced invasive potential observed (Baum et al. 2007). Beta3 integrin expression correlated with progression to advanced melanoma and played a pivotal role in melanoma cell migration and invasion (Watson-Hurst and Becker 2006). Nevertheless, a reduced expression of integrin β3 has also been reported. In primary colorectal cancer, the vascular integrin β3 level in lung metastasis was significantly diminished compared with primary tumors (Sato and Miwa 2002). In gliomas, tumor-specific αvβ3 overexpression had growth-suppressive effects (Kanamori et al. 2004). Accordingly in ovarian cancer, some researchers including Jakubowska et al. (2007), Bojesen et al. (2005), Hapke et al. (2003), Carreiras et al. (1999) and Liapis et al. (1997) thought that high expression of integrinβ3 increased the risk of ovarian cancer, but others believed that loss of integrin αvβ3 was frequently associated with advanced stages (Brüning et al. 2001).
The possible explanation for the discrepancy in correlations of integrin β3 with metastasis may be the biological heterogeneity of neoplasms (Fidler 1990). The naturally occurring tumors are heterogeneous. These cells are multiple subpopulations and not all of them have the invasive ability. Tumors that can invade and disseminate generally attribute to the higher metastatic subclones. Using cell cloning techniques, we can get subclones with different metastatic potentials isolated from heterogeneous parental lines. They have the same hereditary background, so their phenotypic differences in metastatic potential certainly reflect metastasis-associated differences in gene expression. Recently, many metastasis-related genes, such as nm23, G3BP (Ras-GTPase-activating protein SH3 domain-binding protein), TMSG-1 (tumor metastasis suppressor gene-1), caveolin-1 and others, are found by comparing different metastatic subclones (Radinsky et al. 1992; Liu et al. 2001; Bian et al. 2003; Zhang et al. 2006; Nakano et al. 2003). Furthermore, advanced DNA chip techniques, such as gene chip, DNA microchip, oligonucleotide array and cDNA microarray, are applied in comparative researches to trying and clarify the molecular biology mechanism of tumor metastasis (Li et al. 2003; Tanaka et al. 2003; Hata et al. 2004). At present, the cell cloning techniques have become commonly used methods for the researches of tumor metastatic mechanism and finding tumor metastasis-related genes.
. In our study, using limited dilution method (one kind of cell cloning technique), we got S1 and S21 subclones, with high and low metastatic potentials, respectively, derived from human ovarian cancer parental cell line SKOV3. By comparative researches, the expressions of integrin αvβ3, integrin β3 and E-cadherin were markedly down-regulated in high metastatic subclone. Using siRNA technique, more than 70% knock-down of integrin β3 expression was obtained. The integrin β3-siRNA-transfected cells showed significant increases in cell proliferation, cell migration and invasive activity in contrast with the mock-transfected cells. The expressions of integrin αvβ3 and E-cadherin were lower in the integrin β3-siRNA-transfected cells compared to the mock control. Thus, we concluded that integrin β3, like E-cadherin, might be also a suppressor gene down-regulating invasive features of ovarian cancer cells in SKOV3 cell subclones.
Cruet-Hennequart et al. (2003) found that SKOV3 cells expressed integrin αvβ3 and αvβ5, and integrin αv regulated cell proliferation through activation of integrin-linked kinase (ILK). Sood et al. (2004) found that SKOV3 cells overexpressed focal adhesion kinase (FAK) compared to the nontransformed cell line HI0-180 cells, and FAK played a functionally significant role in ovarian cancer migration and invasion. But in our study, we found no significant differences in expressions of integrin αv, FAK and ILK between the different metastatic subclones, by means of real-time RT-PCR. There must be other signaling proteins responsible for integrin β3 to mediate the transduction of signals in SKOV3 cell subclones. So, cDNA microarray will be used to analyze the differential gene expression between high and low metastatic subclones, to further clarify ovarian cancer metastatic mechanism and find new tumor metastasis-related genes. Next, this study will be performed in other ovarian cancer cell lines and tissues to confirm whether the identified integrins have also a measurable impact on this level.
Acknowledgments
This study was supported by a grant-in-aid for scientific research (2007BS03025, Funds for Doctors) from the Department of Science and Technology of Shandong Province.
References
- Albini A, Iwamoto Y, Kleinman HK et al (1987) Arapid in vitro assay for quantitating the invasive potential of tumor cells. Cancer Res 47:3239–3245 [PubMed] [Google Scholar]
- Arnaout MA (2002) Integrin structure: new twists and turns in dynamic cell adhesion. Immunol Rev 186:125–140. doi:10.1034/j.1600-065X.2002.18612.x [DOI] [PubMed] [Google Scholar]
- Bauer K, Mierke C, Behrens J (2007) Expression profiling reveals genes associated with transendothelial migration of tumor cells: a functional role for alphavbeta3 integrin. Int J Cancer 121:1910–1918. doi:10.1002/ijc.22879 [DOI] [PubMed] [Google Scholar]
- Baum O, Hlushchuk R, Forster A, Greiner R, CléZardin P, Zhao Y et al (2007) Increased invasive potential and up-regulation of MMP-2 in MDA-MB-231 breast cancer cells expressing the beta3 integrin subunit. Int J Oncol 30:325–332 [PubMed] [Google Scholar]
- Bian B, Ma C, You J, Ning J, Fang W, Zheng J (2003) The effects of TMSG-1 gene transfection on metastatic phenotype of pg cancer cells. Beijing Da Xue Xue Bao 35:18–22 [PubMed] [Google Scholar]
- Bojesen SE, Kjaer SK, Høgdall EV et al (2005) Increased risk of ovarian cancer in integrin beta3 Leu33Pro homozygotes. Endocr Relat Cancer 12(4):945–952. doi:10.1677/erc.1.01083 [DOI] [PubMed] [Google Scholar]
- Brun JL, Feyler A, Chêne G, Saurel J, Brun G, Hocké C (2000) Long-term results and prognostic factors in patients with epithelial ovarian cancer. Gynecol Oncol 78:21–27. doi:10.1006/gyno.2000.5805 [DOI] [PubMed] [Google Scholar]
- Brüning A, Köhler T, Quist S, Wang-Gohrke S, Moebus VJ, Kreienberg R et al (2001) Adenoviral transduction efficiency of ovarian cancer cells can be limited by loss of integrin beta3 subunit expression and increased by reconstitution of integrin alphavbeta3. Hum Gene Ther 12:391–399. doi:10.1089/10430340150504019 [DOI] [PubMed] [Google Scholar]
- Carreiras F, Rigot Y, Cruet S et al (1999) Migration properties of the human ovarian adenocarcinoma cell line IGROV1: importance of alpha (v) beta3 integrins and vitronectin. Int J Cancer 80:285–294. doi :10.1002/(SICI)1097-0215(19990118)80:2<285::AID-IJC19>3.0.CO;2-L [DOI] [PubMed] [Google Scholar]
- Cruet-Hennequart S, Maubant S, Luis J, Gauduchon P, Staedel C, Dedhar S (2003) Alpha(v) integrins regulate cell proliferation through integrin-linked kinase (ILK) in ovarian cancer cells. Oncogene 22:1688–1702. doi:10.1038/sj.onc.1206347 [DOI] [PubMed] [Google Scholar]
- D’Abaco GM, Kaye AH (2007) Integrins: molecular determinants of glioma invasion. J Clin Neurosci 14:1041–1048. doi:10.1016/j.jocn.2007.06.019 [DOI] [PubMed] [Google Scholar]
- Fidler IJ, Kripke ML (1977) Metastasis results from preexisting variant cells within a malignant tumor. Science 197:893–895. doi:10.1126/science.887927 [DOI] [PubMed] [Google Scholar]
- Fidler IJ (1990) Critical factors in the biology of human cancer metastasis: twenty-eighth G H. A. Clowes Memorial Award Lecture. Cancer Res 50:6130–6138 [PubMed] [Google Scholar]
- Geiger B, Bershadsky A, Pankov R, Yamada KM (2001) Transmembrane crosstalk between the extracellular matrix–cytoskeleton crosstalk. Nat Rev Mol Cell Biol 2:793–805. doi:10.1038/35099066 [DOI] [PubMed] [Google Scholar]
- Grzesiak JJ, Ho JC, Ar Moossa, Bouvet M (2007) The integrin–extracellular matrix axis in pancreatic cancer. Pancreas 35:293–301 [DOI] [PubMed] [Google Scholar]
- Hapke S, Kessler H, Luber B et al (2003) Ovarian cancer cell proliferation and motility is induced by engagement of integrin alpha(v)beta3/Vitronectin interaction. Biol Chem 384:1073–1083. doi:10.1515/BC.2003.120 [DOI] [PubMed] [Google Scholar]
- Horiuchi A, Konishi I (2004) Mechanism of ovarian cancer metastasis: changes in E-cadherin expression. Nippon Rinsho 62:463–466 [PubMed] [Google Scholar]
- Hata F, Nishimori H, Yasoshima T, Tanaka H, Ohno K, Yanai Y et al (2004) Profiling analysis of differential gene expression between hematogenous and peritoneal metastatic sublines of human pancreatic cancer using a DNA chip. J Exp Clin Cancer Res 23:513–520 [PubMed] [Google Scholar]
- Jakubowska A, Gronwald J, Menkiszak J et al (2007) Integrin beta3 Leu33Pro polymorphism increases BRCA1-associated ovarian cancer risk. J Med Genet 44:408–411. doi:10.1136/jmg.2006.047498 [DOI] [PMC free article] [PubMed] [Google Scholar]
- Jemal A, Siegel R, Ward E, Murray T, Xu J, Thun MJ (2007) Cancer statistics, 2007. CA Cancer J Clin 57:43–66 [DOI] [PubMed] [Google Scholar]
- Kallio JP, Mikkelsson J, Tammela TL, Karhunen PJ, Kellokumpu-Lehtinen P (2006) Genetic variation in platelet integrin alphabeta (GPIIb/IIIa) and the metastatic potential of renal cell carcinoma. BJU Int 98:201–204. doi:10.1111/j.1464-410X.2006.06196.x [DOI] [PubMed] [Google Scholar]
- Kanamori M, Vanden Berg SR, Bergers G, Berger MS, Pieper RO (2004) Integrin beta3 overexpression suppresses tumor growth in a human model of gliomagenesis: implications for the role of beta3 overexpression in glioblastoma multiforme. Cancer Res 64:2751–2758. doi:10.1158/0008-5472.CAN-03-3354 [DOI] [PubMed] [Google Scholar]
- Kasirer-Friede A, Kahn ML, Shattil SJ (2007) Platelet integrins and immunoreceptors. Immunol Rev 218:247–264. doi:10.1111/j.1600-065X.2007.00532.x [DOI] [PubMed] [Google Scholar]
- Kee SH, Steinert PM (2001) Microtubule disruption in keratinocytes induces cell–cell adhesion through activation of endogenous E-cadherin. Mol Biol Cell 12:1983–1993 [DOI] [PMC free article] [PubMed] [Google Scholar]
- Knudsen KA, Soler AP, Johnson KR, Wheelock MJ (1995) Interaction of alpha-actinin with the cadherin/catenin cell–cell adhesion complex via alpha-catenin. J Cell Biol 130:67–77. doi:10.1083/jcb.130.1.67 [DOI] [PMC free article] [PubMed] [Google Scholar]
- Le Tourneau C, Faivre S, Raymond E (2007) The role of integrins in colorectal cancer. Oncology 21:21–24 Williston Park [PubMed] [Google Scholar]
- Legate KR, Montañez E, Kudlacek O, Fässler R (2006) ILK, PINCH and parvin: the tIPP of integrin signalling. Nat Rev Mol Cell Biol 7:20–31. doi:10.1038/nrm1789 [DOI] [PubMed] [Google Scholar]
- Lewis JE, Jensen PJ, Johnson KR, Wheelock MJ (1994) E-cadherin mediates adherens junction organization through protein kinase C. J Cell Sci 107:3615–3621 [DOI] [PubMed] [Google Scholar]
- Li Y, Tang Y, Ye L, Liu B, Liu K, Chen J et al (2003) Establishment of a hepatocellular carcinoma cell line with unique metastatic characteristics through in vivo selection and screening for metastasis-related genes through cDNA microarray. J Cancer Res Clin Oncol 129:43–51. doi:10.1007/s00432-003-0493-z [DOI] [PMC free article] [PubMed] [Google Scholar]
- Li SG, Ye ZY, Zhao ZS, Tao HQ, Wang YY, Niu CY (2008) Correlation of integrin beta3 mRNA and vascular endothelial growth factor protein expression profiles with the clinicopathological features and prognosis of gastric carcinoma. World J Gastroenterol 14:421–427. doi:10.3748/wjg.14.421 [DOI] [PMC free article] [PubMed] [Google Scholar]
- Liapis H, Adler LM, Wick MR, Rader JS (1997) Expression of alpha(v)beta3 integrin is less frequent in ovarian epithelial tumors of low malignant potential in contrast to ovarian carcinomas. Hum Pathol 28:443–449. doi:10.1016/S0046-8177(97)90033-2 [DOI] [PubMed] [Google Scholar]
- Liu Y, Zheng J, Fang W, You J, Wang J, Cui X et al (2001) Identification of metastasis-associated gene G3BP by differential display in human cancer cell sublines with different metastatic potentials G3BP as highly expressed in non-metastatic. Chin Med J 114:35–38 [PubMed] [Google Scholar]
- Mitra SK, Schlaepfer DD (2006) Integrin-regulated FAK-Src signaling in normal and cancer cells. Curr Opin Cell Biol 18:516–523. doi:10.1016/j.ceb.2006.08.011 [DOI] [PubMed] [Google Scholar]
- Nakano T, Tani M, Ishibashi Y, Kimura K, Park YB et al (2003) Biological properties and gene expression associated with metastatic potential of human osteosarcoma. Clin Exp Metastasis 20:665–674. doi:10.1023/A:1027355610603 [DOI] [PubMed] [Google Scholar]
- Neto DS, Pantaleão L, de Sá BC, Landmam G (2007) Alpha-v-beta3 integrin expression in melanocytic nevi and cutaneous melanoma. J Cutan Pathol 34:851–856. doi:10.1111/j.1600-0560.2007.00730.x [DOI] [PubMed] [Google Scholar]
- Parise LV, Lee J, Juliano RL (2000) New aspects of integrin signaling in cancer. Semin Cancer Biol 10:407–414. doi:10.1006/scbi.2000.0337 [DOI] [PubMed] [Google Scholar]
- Parkin DM, Bray F, Ferlay J, Pisani P (2005) Global cancer statistics, 2002. CA Cancer J Clin 55:74–108 [DOI] [PubMed] [Google Scholar]
- Radinsky R, Weisberg HZ, Staroselsky AN, Fidler IJ (1992) Expression level of the nm23 gene in clonal populations of metastatic murine and human neoplasms. Cancer Res 52:5808–5814 [PubMed] [Google Scholar]
- Robertson JH, Am Iga, Sales KM, Winslet MC, Seifalian AM (2008) Integrins: a method of early intervention in the treatment of colorectal liver metastases. Curr Pharm Des 14:296–305. doi:10.2174/138161208783413284 [DOI] [PubMed] [Google Scholar]
- Sato T, Miwa A (2002) Ets-1 and integrin beta3 for lung metastasis from colorectal cancer. APMIS 110:347–353. doi:10.1034/j.1600-0463.2002.100410.x [DOI] [PubMed] [Google Scholar]
- Sood AK, Coffin JE, Schneider GB, Fletcher MS, DeYoung BR et al (2004) Biological significance of focal adhesion kinase in ovarian cancer: role in migration and invasion. Am J Pathol 165:1087–1095 [DOI] [PMC free article] [PubMed] [Google Scholar]
- Switala-Jelen K, Dabrowska K, Opolski A, Lipinska L, Nowaczyk M, Gorski A (2004) The biological functions of beta3 integrins. Folia Biol (Praha) 50:143–152 [PubMed] [Google Scholar]
- Tanaka H, Hata F, Nishimori H, Honmou O, Yasoshima T, Nomura H et al (2003) Differential gene expression screening between parental and highly metastatic pancreatic cancer variants using a DNA microarray. J Exp Clin Cancer Res 22:307–313 [PubMed] [Google Scholar]
- Tucker GC (2002) Inhibitors of integrins. Curr Opin Pharmacol 2:394–402. doi:10.1016/S1471-4892(02)00175-3 [DOI] [PubMed] [Google Scholar]
- Voutilainen KA, Anttila MA, Sillanpää SM, Ropponen KM, Saarikoski SV, Juhola MT et al (2006) Prognostic significance of E-cadherin-catenin complex in epithelial ovarian cancer. J Clin Pathol 59:460–467. doi:10.1136/jcp.2005.029876 [DOI] [PMC free article] [PubMed] [Google Scholar]
- Watson-Hurst K, Becker D (2006) The role of N-cadherin, MCAM and beta3 integrin in melanoma progression, proliferation, migration and invasion. Cancer Biol Ther 5:1375–1382 [DOI] [PubMed] [Google Scholar]
- Wu C, Cipollone J, Maines-Bandiera S, Tan C, Karsan A, Auersperg N et al (2008) The morphogenic function of E-cadherin-mediated adherens junctions in epithelial ovarian carcinoma formation and progression. Differentiation 76:193–205. doi:10.1111/j.1432-0436.2007.00193.x [DOI] [PubMed] [Google Scholar]
- Zhang Q, Furukawa K, Chen HH, Fujinawa R, Kozutsumi Y et al (2006) Down-regulation of caveolin-1 in mouse Lewis lung cancer P29 is a causal factor for the malignant properties in a high-metastatic subline. Oncol Rep 16:289–294 [PubMed] [Google Scholar]


