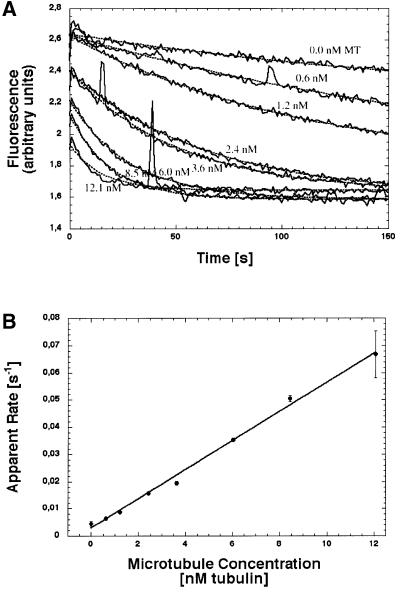
Fig. 2. Second-order rate constant of microtubule-activated mantADP release, kbiADP, from NcKin378cys. This example shows the apparent mantADP release rates upon mixing 100 nM mantADP–kinesin complex with variable amounts of microtubules (A). The time traces were fit to single exponentials (dotted lines). The resulting apparent rates depend linearly on the microtubule concentration, with the slope of the curve signifying kbiADP (B). Since the substoichiometric amount of microtubules limits the reaction, the kbiADP value reflects the rate of kinesin–microtubule binding. The full set of kbiADP values for all NcKin constructs is listed in Table II.

An official website of the United States government
Here's how you know
Official websites use .gov
A
.gov website belongs to an official
government organization in the United States.
Secure .gov websites use HTTPS
A lock (
) or https:// means you've safely
connected to the .gov website. Share sensitive
information only on official, secure websites.
