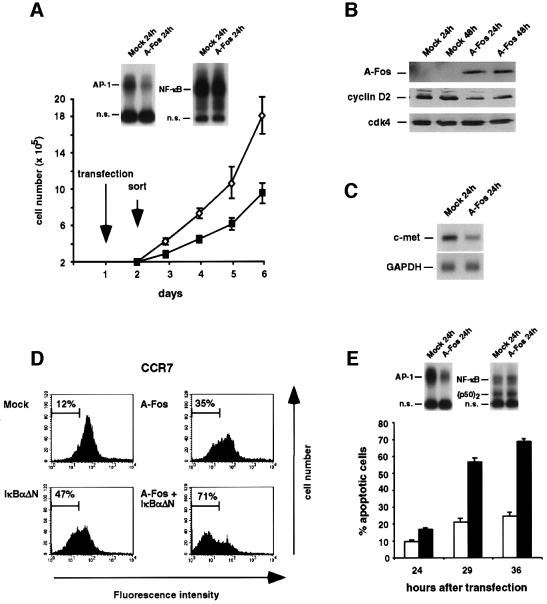
Fig. 6. Functional analysis of AP-1 activity in Hodgkin and ALCL cell lines. (A) Down-regulation of constitutive AP-1 activity by the c-Jun/AP-1 repressor A-Fos reduces proliferation in L428 HRS cells. Whole-cell lysates of FACS-sorted cells were analyzed by EMSA for AP-1 and NF-κB DNA-binding activity. Mock- (open diamonds) or A-Fos- (filled squares) transfected cells (2 × 10⁵) were seeded after sorting and cell numbers were determined in the following 4 days. Results are the means of triplicate measurements. Error bars denote SDs. (B) Western blot analysis for A-Fos protein expression with an anti-FLAG tag antibody and for cyclin D2 and, as a control, cdk4 expression with specific antibodies. (C) Forty hours after transfection, L428 cells were sorted and mRNA expression of c-met was analyzed by northern blot analysis. Thereafter, the blot was reprobed with GAPDH. (D) NF-κB and AP-1 co-stimulate expression of CCR7 in HRS cells. L428 cells were transfected with control plasmid (Mock), A-Fos, IκBαΔN or A-Fos and IκBαΔN expression plasmids along with a GFP expression construct. GFP-positive cells were analyzed by flow cytometric analysis for expression of CCR7. The percentage of cells with weak or absent CCR7 expression is shown. (E) AP-1 suppression induces apoptosis in K299 ALCL cells. Transfection, cell sorting and EMSA analysis was as in (A). The fraction of apoptotic cells determined at the indicated times is shown as means of triplicate measurements for mock- (open bars) and A-Fos- (filled bars) transfected cells, respectively. Error bars denote SDs.

An official website of the United States government
Here's how you know
Official websites use .gov
A
.gov website belongs to an official
government organization in the United States.
Secure .gov websites use HTTPS
A lock (
) or https:// means you've safely
connected to the .gov website. Share sensitive
information only on official, secure websites.
