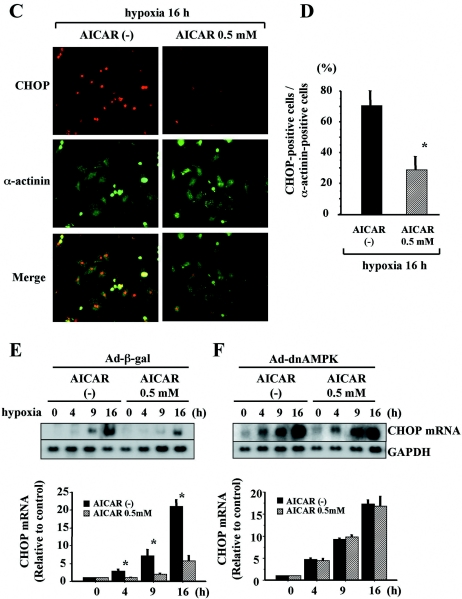
FIG. 7.
AMPK delayed and attenuated ER-dependent death pathways during hypoxia. (A to D) Cardiomyocytes were treated or not (−) with 0.5 mM of AICAR and 1 h later exposed to hypoxia for the indicated time periods. Total RNA was isolated and subjected to Northern blot analysis with CHOP cDNA probes. Equal loading and transfer conditions were confirmed by GAPDH hybridization. (B) Whole-cell extracts of cells were examined by Western blot analysis. The membranes were probed with antibodies specific for CHOP and caspase 12. α-Tubulin was used as a control. (C) Cells were fixed and immunostained with anti-CHOP and anti-sarcomeric α-actinin antibodies and examined microscopically (original magnification of ×200). (D) Bars represent the percentages of CHOP-positive cells among α-actinin-positive cells. The intensity of CHOP staining in each cardiomyocyte was measured using MetaMorpho microscope image analysis software. CHOP-positive cells were defined as those with intensities greater than the mean + SD of the control group under normoxic conditions. More than 100 sarcomeric α-actinin-positive cells were examined for each experiment. (E to I) Cardiomyocytes were infected with Ad-β-gal (E and G) or Ad-dnAMPK (F and H) for 8 h. At 24 h after infection, the cells were treated or not with 0.5 mM of AICAR and 1 h later exposed to hypoxia for the indicated time periods. (E and F) Total RNA was isolated and subjected to Northern blot analysis using CHOP cDNA probe. Equal loading and transfer conditions were confirmed by GAPDH hybridization. (G and H) Whole-cell extracts of cells were examined by Western blot analysis. The membranes were probed with antibodies specific for CHOP and caspase 12. α-Tubulin was used as a control. (I) Whole-cell extracts were examined by Western blot analysis. The membranes were probed with antibody specific for cleaved PARP, a marker of apoptosis. Densitometry was used to determine the ratios of band intensities for CHOP to band intensities for GAPDH (A, E, and F) and the ratios of band intensities for CHOP, activated fragments of caspase 12 (B, G, and H), or PARP (I) to band intensities for α-tubulin. Images are representative findings from, and values are means ± SDs from, three independent experiments with similar results. *, P of <0.05 versus AICAR (0.5 mM) (A, B, and E to I) or versus without AICAR (C and D).


