

Abstract
Quantitative structures of the fully hydrated fluid phases of dimyristoylphosphatidylcholine (DMPC) and dilauroylphosphatidylcholine (DLPC) were obtained at 30°C. Data for the relative form factors F(qz) for DMPC were obtained using a combination of four methods. 1), Volumetric data provided F(0). 2), Diffuse x-ray scattering from oriented stacks of bilayers provided relative form factors |F(qz)| for high qz, 0.22 < qz < 0.8 Å−1. 3), X-ray scattering from extruded unilamellar vesicles with diameter 600 Å provided |F(qz)| for low qz, 0.1 < qz < 0.3 Å−1. 4), Previous measurements using a liquid crystallographic x-ray method provided |F(2πh/D)| for h = 1 and 2 for a range of nearly fully hydrated D-spacings. The data from method 4 overlap and validate the new unilamellar vesicles data for DMPC, so method 4 is not required for DLPC or future studies. We used hybrid electron density models to obtain structural results from these form factors. Comparison of the model electron density profiles with that of gel phase DMPC provides areas per lipid A, 60.6 ± 0.5 Å2 for DMPC and 63.2 ± 0.5 Å2 for DLPC. Constraints on the model provided by volume measurements and component volumes obtained from simulations put the electron density profiles ρ(z) and the corresponding form factors F(qz) on absolute scales. Various thicknesses, such as the hydrophobic thickness and the steric thickness, are obtained and compared to literature values.
INTRODUCTION
The phospholipid bilayer is the structural foundation of biomembranes and structural information about lipid bilayers is widely used as basic information to help model biomembrane structure and the functions that take place therein. Structural information is not easy to obtain, however, for the most biologically relevant states of lipid bilayers, namely fully hydrated, fluid (liquid-disordered Lα or even liquid-ordered) phases. The fluidity precludes an atomic level structure within single bilayers. Additionally, traditional arrays of bilayers that provide strong diffraction signals form liquid crystals, not crystals. Therefore, conventional crystallographic analysis breaks down when ample water enters between the bilayers, as occurs for fully hydrated phosphatidylcholine (PC) lipids (Nagle and Tristram-Nagle, 2000) and charged lipids (Petrache et al., 2004). Partially dehydrating fluid samples introduces interbilayer forces that distort the structure in ways that become unpredictably nonlinear when the equivalent osmotic pressure exceeds 100 atm (93% relative humidity (RH)). It is therefore preferable to obtain bilayer structure for the fully hydrated state in which the bilayers are far enough apart that interbilayer interactions only negligibly modify the structure compared to isolated bilayers. The ability to obtain structure from fully hydrated samples leads to the possibility that peptides and other additives can be studied with less concern that there is insufficient water to allow an aqueous alternative for parts or all of the additives.
An alternative approach to the structural problem, pioneered by Wilkins et al. (1971), uses unilamellar vesicles (ULV) instead of liquid crystalline arrays. Then the primary x-ray scattering data straightforwardly provide the continuous form factor F(qz), which is the Fourier transform of the electron density profile ρ(z), provided that the vesicles are sufficiently dilute that the interference factor, often called the structure factor, S(q), is a constant as a function of the scattering vector q. This requires that the concentration of lipid be <2% by weight when the ULV diameter is ∼600 Å (Kiselev et al., 2003), which predicates that the scattering is relatively weak compared to diffraction from bilayer arrays. However, ample scattering above background can be obtained for small values of qz (Kučerka et al., 2004b). In this article we have, for the first time, combined ULV x-ray data with our primary x-ray data from oriented liquid crystalline arrays of bilayers in a unified analysis.
In our earlier modified Caillé theory (MCT) method for obtaining fully hydrated structure, the samples were multilamellar vesicles (MLV), which are essentially unoriented stacks of bilayers, and the previous results have been reviewed (Nagle and Tristram-Nagle, 2000). The MCT method fit the line shapes of the diffraction peaks using liquid crystal scattering theory (Caillé, 1972) to extrapolate the total intensity in each diffraction order. These intensities were then analyzed, essentially using a crystallographic approach. These earlier MCT results obtained for DMPC (Petrache et al., 1998b) confirm our new results from ULV, so only data from ULV were obtained for DLPC.
Our newer method uses oriented stacks of fully hydrated bilayer arrays. This method defocuses from the peaks, their shapes, and their overall integrated intensity, and instead focuses on the diffuse scattering away from the diffraction peaks. Because diffuse scattering is relatively weak, this requires greater x-ray flux which, in practice, limits instrumental resolution and therefore peak shapes are not resolved. Instead of discrete form factors F(2πh/D) for integral orders h, this method obtains continuous form factors F(qz). Diffuse scattering was previously used for unoriented MLV samples and applied to POPC by Pabst et al. (2000); form factors were obtained for qz up to 0.5 Å−1. Our laboratory has developed the use of diffuse scattering for oriented samples, and we have obtained continuous form factors for fully hydrated DOPC at 30°C for qz up to 0.8 Å−1. This development provides better spatial resolution of bilayer structure than all previous methods (Lyatskaya et al., 2001; Liu and Nagle, 2004). However, in contrast to the usual crystallographic measurement of peak intensities or diffuse scattering from MLV, our method does not give complete results for low qz. This article therefore begins our use of a combined global analysis that also takes data on ULV, for which the results are very good at low qz but poor at high qz.
The results for F(qz) from the combined methods are relatively model free and therefore these are primary data that, for example, may be used directly for comparison to simulations (Sachs et al., 2003). If the F(qz) calculated from a simulation successfully fits the experimental F(qz), then all the other detailed structural information from the simulation, that cannot be obtained experimentally, could be considered to be validated; this could be the best strategy to obtain very detailed and complete bilayer structure. However, because it is sometimes difficult to obtain the correct area A per lipid from simulations performed at constant surface pressure (nominally zero) and a variable area, another strategy is to use our primary F(qz) data to obtain area A, which can then be used in simulations performed at constant A. We also obtain other structural quantities that can be compared to simulations. We carry out this second strategy by fitting the Fourier transform of hybrid models of the electron density ρ(z) to our measured F(qz). By including outside information, such as the lipid volume (Nagle and Wilkinson, 1978) and by comparing to our recent structure of gel phase DMPC (Tristram-Nagle et al., 2002), F(qz) and ρ(z) are put on absolute scales and other structural information about the membrane thicknesses are obtained. This article applies this combination of methods to the fully saturated DMPC lipid and to its shorter chain analog DLPC. One motivation for studying these two lipids with fully saturated hydrocarbon chains is to compare and contrast the efficacy of the method with its application to di-monounsaturated DOPC (Liu and Nagle, 2004), which has a considerably larger value of A.
MATERIALS AND METHODS
Synthetic DMPC (1,2-dimyristoyl-sn-glycero-phosphatidylcholine) and DLPC (1,2-dilauroyl-sn-glycero-phosphatidylcholine) were purchased from Avanti Polar Lipids (Alabaster, AL) and used without further purification. Organic solvents were high-performance liquid chromatography grade from Aldrich (Milwaukee, WI).
Oriented samples
Oriented samples were prepared using the rock-and-roll method (Tristram-Nagle et al., 1993); 10 mg of lipid in a chloroform/trifluoroethanol mixture (1:1, v/v) was deposited onto a flat 15 × 30 × 1 mm acid cleaned Si wafer and subjected to shear during evaporation of the organic solvent. Similar samples of DMPC have been previously characterized and shown to be ∼10-μm thick and to have >80% orientation (Tristram-Nagle et al., 2002). The samples were trimmed to a strip that occupied only the central 5 mm of the 15-mm width of the substrate. Translating along the long length of the sample (x direction), which is perpendicular to the y direction of the beam, provides many fresh spots for taking x-ray data and avoiding radiation damage.
The sample chamber is crucial for studying fully hydrated oriented samples with x rays. A schematic of our chamber is shown in Fig. 1. First, we note that our chamber was designed to replace air with helium to decrease the background due to air scattering. Second, we note that it is desirable to minimize absorption of the x rays by nonlipid material; this can be done by having one surface of the sample free of contact with any solid or liquid material. However, this presents the formidable challenge of fully hydrating the sample from water vapor. There are a number of possible causes for not obtaining full hydration. One obvious possibility is that water vapor leaks through windows or He exchange valves, but this is negligible for our chamber because the decay time for helium retention was ∼17 h and helium is generally more difficult to retain than water vapor. Care was taken to use pure water in the chamber because most contaminants tend to lower the water vapor pressure. We also used an idea from N. L. Fuller and R. P. Rand (unpublished data) to increase the evaporation rate relative to the rate of water loss, by increasing the effective surface area for evaporation. Our implementation of this idea places one end of a strip of filter paper in the water at the bottom of the chamber, which then wicks water into the end of the paper in contact with the vapor. The rough surface of the filter paper, located above the sample, substantially increases the surface area for evaporation.
FIGURE 1.

Projection views of the hydration chamber showing removable top (A), body (B), motorized rotation (C), sample holder and heat sink (D), Peltier device and sample substrate (E), water reservoir (F), double entrance windows (G1 and G2), and exit windows (H1 and H2). Small circles show location of the helium ports, two for the inner chamber and one flow-through for each of the volumes between window pairs.
We believe the most important cause of a humidity deficit is the condensation of the water vapor on cool spots inside the chamber or on the windows as the humidity approaches saturation (RH = 1). A difference in temperature of only 0.008°C lowers the relative humidity to RH = 0.9995; this corresponds (Rand and Parsegian, 1989) to an osmotic pressure Posm = −(kT/VW)ln(RH) of 0.7 atm. Even this small osmotic pressure brings about a decrease in D from the fully hydrated value of 62.7 Å for DMPC at T = 30°C to D = 58 Å (Petrache et al., 1998b), as is emphasized in Fig. 2. It is therefore quite difficult to build a chamber that must have thin windows for x-ray transmission and also hold 100% relative humidity. Our chamber has a pair of entrance windows and a pair of exit windows, each made of 6-μm-thick mylar, as indicated in Fig. 1. The space between each pair of windows is a nonhydrated thermal buffer zone between the room and the interior sample chamber. Resistive heating wire is installed at the lateral edges of this buffer zone to prevent visible condensation on the inner windows in contact with the water vapor. Ambient thermal fluctuations, due to air conditioners and other equipment, hinder thermal equilibration. Such effects are greater in a small synchrotron hutch than in our lab at Carnegie Mellon University, where we also have an extra outer thermal shield and where full hydration is sometimes achieved even without resort to the following hydration aid. We routinely overcome hydration shortfalls by mounting our flat sample on a Peltier element that cools the sample relative to the temperature of the chamber and the water vapor (Tristram-Nagle et al., 2002). Because the vapor pressure at saturation decreases with decreasing temperature, using the Peltier element to cool the lipid sample relative to the chamber raises the relative humidity at the sample even though the water vapor is not saturated at the higher temperature of the chamber. In our last Cornell High Energy Synchrotron Source (CHESS) run, D = 58 Å was achieved for DMPC without the use of the Peltier cooler. As noted above, this required a temperature difference between sample and chamber of only 0.008°C to bring DMPC to full hydration. Equilibration times employed for hydration of the samples reported in this article were ∼90 min.
FIGURE 2.

Relative humidity (RH) required to obtain repeat spacing D in DMPC (adapted from data in Petrache et al., 1998a).
Unilamellar vesicles
Lipid (10 mg) was mixed with 500 μl water (Barnstead nanopure) in a sealed plastic tube. Multilamellar vesicles were prepared using repetitive cycles of heating (above the main phase transition) and cooling (to ∼10°C), until a uniform dispersion was obtained. Extruded unilamellar vesicles were prepared from this dispersion using the Avanti mini-extruder following the procedure of MacDonald et al. (1991). The multilamellar vesicles were extruded through two polycarbonate filters with pores of diameter 500 Å mounted in the extruder fitted with two gas-tight Hamilton syringes. The sample was subjected to 25 passes through the filters above the main phase transition temperature. An odd number of passes was performed to minimize contamination of the sample by multilamellar vesicles, which might not have passed through the filters, and the sample was also centrifuged for 10 min to remove MLV that had passed through the filters. The sample was filled into a circular lumen 1.5-mm thick in the beam direction. The lumen was defined by two sheets of mylar with thickness 6 μm held apart by a Teflon spacer within a rigid frame (Luzzati cell). The time between sample preparation and measurement was ∼10 h. Absence of any oligolamellar distortions to the resulting form factor indicated that the vesicles were unilamellar. Neutron scattering from similarly prepared samples that extended to small enough angle to resolve the vesicular form factor obtained an average unilamellar diameter of 600 Å (Balgavý et al., 2001a, b; Kučerka et al., 2004a).
X-ray scattering
X-ray data were taken at the D-1 station of CHESS. X-rays of wavelength λ = 1.172 Å were selected using the WB4/C multilayer monochromator (Osmic, Detroit, MI), which has 1.2% full-width half-maximum energy dispersion. The beam for oriented samples was narrow (0.28 mm) to provide small angular divergence (1.4 × 10⁻⁴ radian) in the horizontal direction. The beam was 1.2-mm tall to ensure that all of the sample (5 mm along the beam) was in the footprint of the beam for all rotation angles θ that extended up to 5° (qz = 0.93 Å−1). The beam for the ULV samples was 0.28 × 0.28 mm square. Data were collected using a Medoptics (Tucson, AZ) charge-coupled device (CCD) with a 1024 × 1024 pixel array, each pixel having average linear dimension 47.19 μm. The CCD to sample distance was s = 248.2 mm for oriented samples and s = 347.8 mm for ULV samples, calibrated using a silver behenate standard. Collected images were dezingered and processed for CCD distortion and intensity corrections (Barna et al., 1999), using calibrated files supplied by CHESS, and dark CCD levels were subtracted. Successively longer exposures of the same sample showed that pixels on the CCD were linear up to an intensity of 14,000.
Background subtraction employed images of the scattering from the bare substrate for oriented samples and images of the scattering from water in the Luzzati cell for ULV. These images were normalized to the data images using the transmitted beam intensity, which was recorded on all CCD images after attenuation by a factor of 5 × 10⁶ by a 200-μm-thick molybdenum semitransparent beam stop.
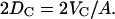
PRIMARY X-RAY DATA
Fig. 3 shows a background subtracted CCD image from an oriented DMPC sample. Orders h = 1 and h = 2 were attenuated by a factor of 2400 by a 100-μm-thick vertical molybdenum finger on the beam stop to prevent overexposure of the CCD. The repeat spacing D was determined from the locations of the direct beam and the h = 1, 2 orders, corrected for refraction using index of refraction n = 0.9999979 calculated from the atomic composition of the sample and atomic scattering properties (http://www.cxro.lbl.gov). On the meridian (qr = 0), there are sharp minima in the intensity near qz = 0.29, 0.45, and 0.68 Å−1. These minima mark the boundaries between broad regions of diffuse scatter that are defined as lobes in Fig. 3.
FIGURE 3.

Grayscale plot of the log intensity from an oriented sample of DMPC (D = 62.6 Å) at 30°C. The displayed image was cropped from the original, which extended from qz = −0.05 Å−1 to qz = 0.95 Å−1 and qr = ±0.5 Å−1. The two boxes within the lobes labeled 2 and 3 contain the data used to obtain the structure factor S(q).
Fig. 4 compares the data from the middle of the second lobe for the image in Fig. 3 to its corresponding background. Most of the background is gas scattering of the beam. The background intensity also has a small peak at qr = 0, which comes from specular reflectivity from the substrate. This peak is well localized to within qr = ±0.01 Å−1. Because specular reflectivity from the sample will be modified compared to the bare substrate, subtraction of this peak, although a good first-order correction, will not be quantitatively accurate, so no data from this small qr region near the meridian are used in the analysis. Fig. 4 emphasizes that much of the scattering intensity from the lipid (data-bkgd) is larger than the background. Furthermore, outside the narrow specular peak the background is nearly constant and featureless, although a shadow, barely discernable in Fig. 4, is cast by the finger used to attenuate the low orders; this shadow should be identical in both data and background and is therefore correctly subtracted. Importantly, the background intensity matches the intensity of the data image for large qr where diffuse scattering is expected to be negligible, so background subtraction validly extends the qr range to ≈0.2 Å−1 beyond which the diffuse scattering is negligible.
FIGURE 4.

Intensity from oriented sample of DMPC versus qr for qz = 0.35 Å−1 (halfway between the h = 3 and h = 4 orders in Fig. 3). The solid squares show the raw data, the open circles show the background, and the open triangles show the data minus the background (data-bkgd). The light gray line beginning at qr = 0.01 Å−1 shows the smectic theory fit to the data minus background.
Fig. 5 shows the qz dependence of the scattering intensity for three values of qr. For the smallest qr value the very strong h = 2 peak is quite apparent at qz = 0.2 Å−1 in the first lobe and the h = 4 peak is noticeable at qz = 0.4 Å−1. Furthermore, this curve shows the sharpest minima at qz = 0.29 Å−1 between the first and second lobes and at qz = 0.45 Å−1 between the second and third lobes. The blurring of these minima as qr increased, apparent in Fig. 5, did not occur for DOPC (Liu and Nagle, 2004), nor did it occur for DLPC. It is not clear what causes this unexpected feature in DMPC. It is nevertheless clear that strong minima occur and this, together with the shapes of the lobes, implies a different sign for F(qz) in lobe 2 than in lobes 1 and 3.
FIGURE 5.

Log intensity (background subtracted) versus qz for DMPC for three qr values with data binned over a width Δqr = 0.01 Å−1. Scaling factors 2.4 and 5.5 were applied to the qr = 0.05 Å−1 and qr = 0.07 Å−1 curves, respectively. The light gray line shows the fit to the data for qr = 0.03 Å−1.
Fig. 6 shows a background subtracted CCD image of a ULV sample of DMPC. The beam stop was obtrusive for small values of q. Although the setup could be modified to observe smaller angle scattering, this setup sufficed for this study. Fig. 7 compares the background and the data from ULV samples as a function of qz, which is the only scattering vector (in the sample frame of reference) that can be obtained from unoriented samples. Compared to the background the scattering intensity from the lipid only (data-bkgd) is very strong and robust in the first lobe up to qz = 0.20 Å−1, but it is much weaker than the intensity from the background for larger qz. Even though the signal/noise ratio is too low to obtain third lobe scattering, the subtraction of the background gives a well-defined second lobe of lipid bilayer scattering, as is also visually apparent in Fig. 6.
FIGURE 6.

Grayscale plot of the log of background-subtracted intensity from a ULV sample of DMPC at 30°C. The shadow of the rectangular beam stop is seen to the lower left.
FIGURE 7.

Log of intensity versus qz for ULV samples of DMPC integrated around constant qz arcs. The solid squares show the intensity from the lipid sample including background, the open circles show the background, and the open triangles show the sample data with the background subtracted (data-bkgd).
ANALYSIS OF DATA TO OBTAIN F(qZ)
Oriented samples
The scattering intensities I(q) are first corrected for differential absorption at different scattering angles due to different pathlengths in the sample (Tristram-Nagle et al., 2002). Then, the scattering intensity for a stack of oriented bilayers is the product
 |
(1) |
where q = (qz,  ), S(q) is the structure factor, F(qz) is the bilayer form factor whose Fourier transform is the electron density profile ρ(z), and
  is the usual Lorentz factor for oriented samples. To obtain |F(qz)|2 from the measured I(q) we first obtain S(q) and then essentially divide S(q)/qz into I(q).
Our method for obtaining S(q) has been previously developed and applied to DOPC (Lyatskaya et al., 2001; Liu, 2003; Liu and Nagle, 2004) and DMPC (Chu et al., 2005). This is accomplished by fitting the theory to the qr dependence of the diffuse scattering data, limited to the q regions shown in Fig. 3 where the diffuse scattering is strong but not contaminated by specular reflectivity from the substrate (qr < 0.01 Å−1) or from mosaic spread from the very strong first two orders of diffraction. The primary results from this fitting are the values of the bilayer bending modulus KC and the compression modulus B that are shown in Table 1. The quality of the fits to DMPC data is indicated in Figs. 4 and 5. Although the fits are not as good for DMPC as they were for DOPC, due primarily to the smearing of the minima for the larger qr values shown in Fig. 5, the overall quality of the fits for the many (75,000) data points suggests that KC and B have been obtained to adequate precision. From the values of KC and B, S(q) was obtained for values of 0.2 < qz < 0.8 Å−1 and 0.03 < qr < 0.08 Å−1. For each value of qz, S(qr) was fit to I(qr) using a linear scaling parameter that becomes |F(qz)|2/qz after correcting for different absorption by the sample of the x-ray beam at different scattering angle. An offset parameter c(qz) was also used for each qz to accommodate background that was not perfectly subtracted.
TABLE 1.
Material properties
| DMPC | DLPC | |
|---|---|---|
| D [Å] | 62.6 | 61.1 |
| Kc [10−13 erg] | 6.9 | 5.5 |
| B [1012 erg/cm4] | 15 | 5.7 |
There is, however, an important undulation correction. Because undulations tilt the local orientation of the bilayers with respect to the z axis, the average thickness of each bilayer along the z direction is larger than if the bilayer were perfectly flat (see section 7.1 in Nagle and Tristram-Nagle, 2000). Previously, this undulation correction was made after obtaining an electron density profile by reducing the width of the bilayer by a geometric factor that depends on the measured KC (Liu and Nagle, 2004). In this article we perform the equivalent undulation correction before fitting to an electron density profile by expanding the qz scale for the F(qz) data by the same correction factor, which was 1.014 for DMPC and 1.019 for DLPC.
As would be expected, the thinner DLPC bilayer has a smaller bending modulus than DMPC. This increases its undulation fluctuations, which increases its water spacing, as will be seen subsequently. The B modulus is a harmonic surrogate for the interbilayer interactions, which are weaker when the bilayers are further apart. The smaller value of B in Table 1 obtained for DLPC is therefore expected.
Unilamellar vesicles
The Debye approximation of the interparticle structure factor S(q) for large spherical vesicles (Glatter and Kratky, 1982; Feigin and Svergun, 1987), which assumes nonspecific association of vesicles, predicts that S(q) is very nearly unity for q > 0.01 Å−1. This prediction was confirmed experimentally for aqueous dispersions of uncharged unilamellar vesicles with total phospholipid concentrations <2 wt% (Nawroth et al., 1989; Kiselev et al., 2003). The scattering intensity I(q) is then a product of only the square of the bilayer form factor |F(qz)|2 and the Lorentz factor  for unoriented samples. To improve the ratio of signal/noise, intensities were summed over arcs of constant q and averaged for the available angular range. It may also be noted that, unlike the oriented data, there are no final fluctuation corrections to be made to qz for the ULV data because long wavelength undulations are suppressed by the vesicle size; undulations would only affect the vesicle form factor that appears at smaller scattering angles than for the data we obtained.
Results for F(qz)
The values of F(0) were obtained using the formula (Nagle and Wiener, 1989)
 |
(2) |
where the number of electrons nL is 374 for DMPC and 342 for DLPC, the electron density of water is ρW = 0.333 e/Å3, the volume of the lipid VL is 1101 Å3 for DMPC (Nagle and Wilkinson, 1978) and we have measured 991 Å3 for DLPC using the same neutral flotation method. The area A is obtained from the model fit in the next section.
The absolute values of the continuous form factors |F(qz)| are plotted in Fig. 8 for DMPC at T = 30°C. Reliable results from oriented stacks are obtained for qz > 0.22 Å−1 for DMPC; this is slightly greater than qz = 4π/D = 0.20 Å−1 of the second order of the fully hydrated sample. Note the appearance of some unphysical negative values for |F(qz)| in Figs. 8 and 9 near qz values where |F(qz)| approaches zero. Because the amplitude of the scattering is small near such values of qz, statistical noise requires a distribution of the fitted amplitudes that necessarily includes some negative values. Ignoring such negative values of |F(qz)| would unduly bias the fitting toward models with F(qz) that do not cross zero in such regions.
FIGURE 8.

Form factors |F(qz ≠ 0)| for DMPC at T = 30°C from oriented samples (blue inverted triangles), ULV samples (open red triangles for data used in fitting and orange dots for data not used due to large background subtraction) and MLV samples (black X) (Petrache et al., 1998b) and F(0) (magenta square) from volume measurements. Negative values of |F(qz)| indicate statistical fluctuations where scattering intensity is weak. The green line is the fit obtained by modeling, which provides the relative scale factors for the different data sets.
FIGURE 9.

Form factors |F(qz ≠ 0)| for DLPC at T = 30°C from both oriented samples and ULV samples and F(0) from volume measurements. Negative values of |F(qz)| indicate statistical fluctuations where scattering intensity is weak. The gray line is the fit obtained by modeling.
The continuous form factors |F(qz)| obtained from ULV, also plotted in Fig. 8, begin at qz = 0.1 Å−1 and end in the second lobe. Placing both sets of data on the same scale in Fig. 8 was accomplished by modeling in the next section. An important question is whether the two kinds of sample have bilayers with the same quantitative structure. A test is that the two sets of data can be matched in the overlapping qz region using only one scaling factor ratio, kori/kulv. The overlap of the two sets of data in the first lobe and the location of the first two minima are very good. It might be noted that this overlap is not as good when the undulation correction to the qz scaling of the oriented data is not made. However, the values of |F(qz)| appear to be slightly lower in the second lobe for ULV than for oriented samples. As indicated in Fig. 7, the amplitude of the second lobe depends delicately upon the subtraction of the background, which is more than an order of magnitude greater than the scattering from the sample. We have therefore only used ULV data for qz < 0.27 Å−1 in our subsequent structural analysis.
Another important test whether data from ULV samples are compatible with data from samples consisting of arrays of bilayers comes from comparing to results obtained in our previous work on DMPC multilamellar vesicles (Petrache et al., 1998b). Some of the data obtained in that study employed an osmotic pressure up to 27 atm (D ≈ 51.5 Å), and that begins to change the structure of the bilayer. Therefore, we consider only data taken with osmotic pressures <2 atm (D > 56 Å), which corresponds to a decrease in the lipid area by <0.2 Å2. These data consist of eight samples with different D-spacings. The first two orders were measurable for seven of the samples and the first three orders were measurable for one sample. Fig. 8 shows that these data agree very well with the ULV data in the first lobe. We conclude that, even if there is a difference in bilayer structure between ULV on the one hand, and MLV and oriented samples on the other, such a difference has negligible effect on |F(qz)| in the first lobe.
Fig. 9 shows the corresponding |F(qz)| plot for DLPC, except that no MCT data have been collected. Comparison of the form factors for DMPC in Fig.8 and DLPC in Fig.9 shows that all features of the DLPC form factor occur at larger values of qz than the same features for DMPC, consistent with the DLPC bilayer being thinner than the DMPC bilayer. Together with our effective experimental cutoff near qz = 0.8 Å−1, this means that no measurable data were obtained in lobe 4 for DLPC.
STRUCTURAL MODELING
We employ an electron density model devised in this lab (Wiener et al., 1989) that is built as shown on the left-hand side of Fig. 10. The known electron density of water ρW = 0.333 e/Å3 provides a constant baseline outside the bilayer and a constant baseline  is assigned to represent the methylenes in the hydrocarbon chain region. A smooth bridge, with a width wb and located at a position zb that are parameters in the model, joins the two constant regions and the three regions together are called the baseline function ρb(z). There are three regions that have electron densities significantly different from ρb(z) as shown in Fig. 10: the phosphatidylcholine (PC) region, the (CG) region of the carbonyls and glycerol, and the (Methyl) region of the terminal methyls on the hydrocarbon chains. Each of their excess (deficit) electron density distributions are represented by Gaussians. Although deviations from Gaussian distribution functions are allowed and observed in simulations (Feller et al., 1997), Gaussians are the best pauci-parameter approximations to distribution functions for localized component groups of lipids. However, the delocalized methylene groups and water are better represented by the constant plateau in the baseline function. Because it combines two kinds of functions this is called a hybrid model. The sum of these Gaussians and the baseline function ρb(z) gives the total model electron density as shown in Fig. 10. There are eleven fitting parameters in this model; the heights, CPC, CCG, and CM, and widths, σPC, σCG, and σM of each of the Gaussians; the locations zPC and zCG of the two headgroup Gaussians; the constant methylene electron density
  ; and the width wb and location zb of the bridge in the baseline function.
FIGURE 10.

The solid line shows the electron density profile for DMPC obtained by fitting the electron density model to the form factor data in Fig. 8. The individual contributions to the total electron density of the phosphatidylcholine PC group, the carbonyl-glycerol CG groups, the terminal methyl M groups, and the baseline function ρb are shown by broken lines on the left side of the figure.
For any trial electron density model used in the fitting of F(qz) as well as for the final fit, the area per lipid A is obtained using the measured lipid volume VL in the fluid phase and the distance between the maxima in the electron density profile, called the head-head thickness DHH and by using the gel phase as a well-determined reference. The quantities that were obtained from the fully hydrated gel phase of DMPC (obtained using the same electron density model) are: the volume of the headgroup,  half the thickness of the hydrocarbon chain region
  and the head-head spacing
  (Tristram-Nagle et al., 2002). The area in the fluid Lα phase is then calculated using
 |
(3) |
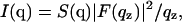
Use of this equation assumes that the volumes of the fully hydrated headgroup and the differences 2DH1 = DHH − 2DC are the same in the gel and fluid phases.
The first constraint in fitting the parameters in the model is given by Eq. 2. Because F(0) is significantly different from zero for DMPC and DLPC (in contrast to DOPC), this constraint already helps determine the absolute scales for the electron density and F(q). Second, the full width of the bridge in the baseline function was constrained to 8 Å; this is approximately the width of that part of the headgroup region within which simulations find that methylenes are gradually replaced by water (Feller et al., 1997). The third constraint is on the (negative) integrated size SM of the electron deficit of the terminal methyl trough; this was obtained using the ratio r = 1.9 of methyl volume to methylene volume (Armen et al., 1998; Nagle and Wiener, 1988). The detailed calculation (Nagle and Wiener, 1989; Liu, 2003) takes into account that the terminal methyl Gaussian represents only the deficit number of electrons compared to the baseline represented by ρb(z). Fourth, the headgroup volume VH is constrained to be the same as in the gel phase. One consequence of this constraint is that the hydrocarbon chain volume
 |
(4) |
is determined because VL is measured. This also constrains the hydrocarbon thickness, defined as 2DC, by the simple relation
 |
(5) |
Furthermore, the volume of the hydrocarbon region is also given by
 |
(6) |
where the number of electrons per methylene is  Therefore, the model parameter
  is also determined from these four constraints.
There are also constraints for the headgroup Gaussians. The number of electrons in the PC headgroup is eH = 164 e. These electrons contribute to the product of A times the sum (SH = SPC + SCG) of the headgroup Gaussians, but they also contribute to the underlying baseline function that was devised assuming that the nonheadgroup components filled the volume. Because the headgroups displace a volume VH, the total number of electrons in the headgroup that contribute to the baseline function is VHρb(zH), where ρb(zH) is the average electron density of the baseline function at the zH level of the headgroup. Summing these two contributions yields
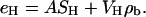 |
(7) |
In first approximation ρb(zH) is just the water electron density ρW. However, the Gibbs dividing surface between the hydrocarbon region and the interfacial headgroup region is blurred by the inequivalence of the two hydrocarbon chains on each lipid such that the upper end of the sn-2 hydrocarbon chain overlaps with the glycerol group, which is counted as part of the headgroup. Simulations (Feller et al., 1997) indicate that about f = 2/3 of the volume displaced by the headgroup is water and the remaining 1 − f = 1/3 is hydrocarbon, which gives  Constraining f = 2/3 therefore effectively applies a constraint on SH via Eq. 7. In practice, this f constraint also helps locate the center zb of the bridge in the baseline function. Another headgroup constraint that is imposed regards the ratio R of the sizes of the two headgroup Gaussians. From simulations that give the volumes of component groups (Petrache et al., 1997; Armen et al., 1998) and that also obtain the z location of the component group, we estimate that the values of the underlying baseline function are ρb(zPC) ≈ 0.32 e/Å3 for the PC group and ρb(zCG) ≈ 0.30 e/Å3 for the CG groups. Then a formula similar to Eq. 7 is applied to the PC Gaussian and the CG Gaussian separately. We do not use each of these separately because together they are redundant with the constraints in Eq. 2 and the terminal methyl constraint on r. However, the ratio R = SPC/SCG = 1.76 of the sizes of the two headgroup Gaussians is not redundant with other constraints, and this value of R is constrained in the fit.
Nonlinear least-squares fitting of the multiply constrained electron density model was applied to the |F(qz)| form factor data. Because the experimental form factors are only obtained on a relative scale, a single linear scaling factor kori was applied to the oriented data (≈600 points) and a similar factor kulv was applied to the ULV data (≈250 points). The least-squares minimization was applied to the sum, over both oriented and ULV data, of the weighted square of the residuals,  where the uncertainties
  of each data point were estimated for local qz regions by the scatter in the data.
Results of fitting the Fourier transform of the electron density model to the scaled experimental form factors are shown by the gray lines in Figs. 8 and 9. The corresponding electron density profiles are shown in Figs. 10 and 11. Table 2 compiles numerical values of structural parameters obtained from these fits.
FIGURE 11.

The solid line shows the electron density profile for DLPC obtained by fitting the electron density model to the form factor data in Fig. 9. The individual contributions to the total electron density of the phosphatidylcholine PC group, the carbonyl-glycerol CG groups, the terminal methyl M groups, and the baseline function ρb(z) are shown by broken lines on the left side of the figure.
TABLE 2.
Values of structural and model parameters
| DMPC | DLPC | |
|---|---|---|
| D [Å] | 62.6 | 61.1 |
| VL [Å3] | 1101 | 991 |
| A [Å2] | 60.6 | 63.2 |
| 2DC [Å] | 25.4 | 20.9 |
| DHH [Å] | 35.3 | 30.8 |
| D′B [Å] | 43.4 | 38.9 |
| D′W [Å] | 19.2 | 22.2 |
| DB [Å] | 36.3 | 31.4 |
| nW | 26.6 | 31.3 |
| n′W | 7.2 | 7.9 |
| 2zPC [Å] | 35.5 | 31.0 |
| CPC [e/Å3] | 0.279 | 0.272 |
| σPC [Å] | 2.21 | 2.18 |
| 2zCG [Å] | 26.3 | 21.8 |
| CCG [e/Å3] | 0.184 | 0.195 |
| σCG [Å] | 1.90 | 1.73 |
| CM [e/Å3] | −0.183 | −0.195 |
| σM [Å] | 2.23 | 2.02 |
 [e/Å3] [e/Å3] |
0.289 | 0.288 |
| wb [Å] | 8 | 8 |
| 2zb [Å] | 29.0 | 24.4 |
We have also analyzed data taken from oriented samples of DMPC over the temperature range 24 < T < 40°C. Our areal coefficient of thermal expansion of 0.005 per degree is consistent with the value αA = (dA/dT)/A = 0.0042 per degree reported by Needham and Evans (1988) at 35°C and 0.0044 K−1 at 30°C reported by Petrache et al. (2000).
DISCUSSION
The most basic data obtained in this article are the form factors k|F(qz)|. As is typical in diffraction studies, these basic data contain an arbitrary overall scaling factor k and their sign (phase) requires determination. Modeling the electron density and using outside information, such as the measured molecular volume and the reference gel phase, enable us to determine k and the phases, and to put the electron density and the continuous form factor on absolute scales. We nevertheless emphasize that there are assumptions involved in modeling, so to compare to simulations or other determinations of structure one should consider comparing also to these basic data.
The phasing of the form factor F(qz) is even easier using diffuse scattering data than the conventional swelling method that uses diffraction peaks at a number of different hydration levels to map out piecewise segments of |F(qz)|. As was shown experimentally by Torbet and Wilkins (1976) and understood theoretically (Rand and Parsegian, 1989), drying a sample to obtain different D-spacings also results in changes in the membrane thickness and therefore in the form factor, so the swelling method should be limited to a range of relative humidity (osmotic pressure) where it can be demonstrated that the quantitative structure changes insignificantly (Tristram-Nagle et al., 2002). Although this still allows the conventional swelling method for phasing to be very valuable, it does require many data sets and normalization factors. In contrast, phasing from diffuse scattering is obtained from a single fully hydrated sample. As can be seen in Figs. 3 and 8, the relative phases in the first three lobes are obvious. However, the relative phase of the fourth lobe is not so obvious. Although there is a clear minimum between the third and fourth lobe, the form factor for our best electron density model does not change sign near that minimum, as can be seen by the fits in Figs. 8 and 9. The gel phase form factor of DMPC also does not change sign between the third and fourth lobes (Tristram-Nagle et al., 2002).
Determining the phase of the fourth lobe is made more complicated by the occurrence, when fitting the electron density model to the k|F(qz)|, of a second local minimum that has a fitted χ2 that is comparable to the one obtained for our preferred solution. The most notable difference in the form factor of this second solution is that the fourth lobe changes sign compared to the third lobe. Therefore, neither straightforward observation nor blind statistics provide the phase of the fourth lobe. Our preference is established by applying chemical considerations to the components in the electron density model. The second solution requires the distance between the PC Gaussian and the CG Gaussian to be 8.4 Å for DMPC. That distance is greater than the maximum stereochemical distance between the carbonyl groups and the phosphate group in lecithin molecules whereas the values shown in Table 2 for our preferred model does not violate this chemical criterion. We also think that the detailed shape of the third lobe, in particular, the rather gradual decrease in |F(qz)| from its maximum as qz increases, is a strong indication that there is no zero, or at most a soft landing between the third and fourth lobes. This emphasizes that our electron density model is constructed to incorporate physical features and is not just an abstract fitting model.
Our electron density model contains 11 parameters, but there are six constraints that reduce the number of independent parameters in the fit from 11 to five. These constraints use information in addition to the raw scattering data, such as the measured volume, reference values from the gel phase, and component volumes from simulations. Such constraints have physical origins and they usually involve a combination of the model parameters and many of those parameters are affected by more than one constraint. For example, the R constraint that fixes the relative sizes of the two headgroup Gaussians affects four of the basic parameters, the heights and widths of both Gaussians. It may be noted that it is possible to fit the headgroup region with a wide mixture of two unconstrained Gaussians. Constraining the ratio R from simulations as well as the constraint on headgroup volume and number of electrons not only reduces this uncertainty, but these constraints make the fitted model a closer representation of the physical bilayer. This supplementation of the k|F(qz)| data is a major strength of the model method.
We acknowledge that our fitting procedure uses substantial input from simulations. This input provides constraints that are most helpful to obtain unique fits to our data. However, this raises the issue of the degree of independence of our results. The simulations have passed the test of obtaining the measured total lipid volume. Furthermore, the values of the component groups do not vary much for different lipids (Armen et al., 1998). The distribution of water and hydrocarbon in the headgroup region are quite similar for DPPC and DOPC simulations, even though the areas of those two lipids are quite different. We do not use the simulations to locate the positions of any of the components or the widths of their distributions in our hybrid electron density model. Of the six constraints on our electron density model, the ones provided exclusively by the simulations are the R, f and wb constraints defined in the structural modeling section. (The r constraint for the methyl volume is also provided by much previous modeling and gel phase results.) Changing the numerical values of these constraints within reasonable physical bounds does not significantly alter final values of structural parameters in Table 2. Therefore, although there is considerable synergy, there is also considerable independence of our results from the simulation input.
A new technique in this article is combining basic k|F(qz)| data from oriented stacks of bilayers with data from unilamellar vesicles. The advantage of this is that the two kinds of samples provide data in complimentary ranges of qz. In principle, the oriented samples can provide data over the full qz range up to about qz = 0.8 Å−1, but we have found that k|F(qz)| appears to be too small between the first and second orders and there are obvious glitches that occur near the strong h = 1 and h = 2 peaks. In contrast, the k|F(qz)| from the ULV samples are strong and well behaved in the first lobe, but the signal/noise ratio decreases substantially for larger qz. Although ULV provide qualitatively suggestive data in the second lobe, the background is much larger than the data. Therefore, we have used only first lobe ULV data.
Although the previous paragraph emphasizes the advantage of using values of k|F(qz)| from ULV samples for low qz and from oriented stacks for higher qz, this combination could be flawed if the two kinds of samples have different quantitative bilayer structure. It has been argued that the interbilayer interactions in fully hydrated multilamellar stacks (oriented or unoriented MLV) are too weak to alter their structure compared to isolated single bilayers (Nagle and Tristram-Nagle, 2000). However, the diameter of the ULV samples we study in this article is only 600 Å (Balgavý et al., 2001a,b; Kučerka et al., 2004a), so the possibility was considered that curvature stress might alter their structure compared to the structure of giant unilamellar vesicles or planar bilayers in MLV or in oriented samples. Fortunately, there is a fairly large overlap range of qz values in Figs. 8 and 9 within which the two sets of data agree fairly well.
Nevertheless, in addition to this overlap we have applied another test. Together with the form factors obtained from ULV data and oriented data, Fig. 8 shows the form factors obtained by the MCT method from MLV samples (Petrache et al., 1998b). If the ULV bilayer is structurally the same, then the different sets of form factors should lie on the same continuous transform. Based on the very good agreement shown, it appears that there is negligible difference in the first lobe data from ULV and MLV samples. Although this does not conclusively prove that bilayers in ULV and MLV are identical, it does suggest that ULV may be used to obtain first lobe scattering data instead of having to use the more difficult MCT method on MLV.
The new results for the area of DMPC are 1 Å2 larger than the earlier value 59.6 Å2 that was obtained by our previous x-ray method (Petrache et al., 1998b) and by NMR (Koenig et al., 1997; Petrache et al., 2000). Although agreement is satisfactory within estimated uncertainties of 0.5 Å2, the refined structure in this article was obtained with much better x-ray data, so the new value of A should be more accurate. Fig. 12 compares our results for A for DMPC and DLPC with results from two other earlier studies, both on unilamellar vesicles (Lewis and Engelman, 1983; Balgavý et al., 2001a). Because the data were taken at different temperatures, extrapolated lines are shown using the areal thermal coefficient of expansion αA = 0.0042 K−1 obtained for DMPC at 35°C (Needham and Evans, 1988). For the temperature dependence of the hydrocarbon thickness 2DC, we used a coefficient of linear expansion αL = αV − αA, where αV = 0.0009 per degree is an average measured coefficient of volume expansion between 30 and 36°C (Nagle and Wilkinson, 1978), and the resulting αL = 0.0033 K−1 agrees well with the value 0.0031 K−1 reported by Petrache et al. (2000) for T = 30°C. Our results for the hydrophobic thickness 2DC differ from both previous results by ∼2 Å for both DMPC and DLPC, but in opposite directions, as shown in Fig. 12. The result that A is larger at the same temperature for the smaller chain length DLPC than DMPC is obtained by all three studies shown in Fig. 12 and by the NMR study of Petrache et al. (2000). Some theory predicts the opposite experimental trend (Cantor, 1999).
FIGURE 12.

The squares are from Lewis and Engelman (1983), the circles from Balgavý et al. (2001a), and the triangles are from this article. The lines are extrapolations using the coefficient of areal expansion αA = 0.0042 per degree for A and the coefficient of linear expansion αL = 0.0033 per degree for 2DC.
Table 2 also gives many other results. The distance between the peaks in the electron density profile DHH is often identified with the distance between phosphate groups on opposite monolayers. However, the latter quantity is more appropriately the distance 2zPC between the two outer PC Gaussians, although this requires ignoring any effect of the choline group, which is plausible because it has much less electron density contrast than the phosphate group and is located at nearly the same z level. Regardless, the difference between DHH and 2zPC is only 0.2 Å. The average distance between the two carbonyl groups may be represented by the distance 2zCG between the inner Gaussians if we neglect the glycerol group that has less electron density contrast than the carbonyl. It is reassuring that 2zCG is larger than the hydrocarbon thickness 2DC. The steric thickness of the bilayer D′B was obtained by adding 18 Å to 2DC; the reasonableness of this convention is indicated in Figs. 10 and 11, which also show the Gibbs dividing surface at DC for the hydrocarbon region. The distance 2zb between the bridges in the baseline function represents where the water and hydrocarbon make equal contributions to the electron density, which is essentially the Gibbs dividing surface for penetration of water into the hydrocarbon region, although, of course, some water penetrates further to help solvate the carbonyl groups, as is clearly indicated by molecular dynamics simulations (Feller et al., 1997). The number of water molecules per lipid nW is further broken down into the number n′W in the headgroup region between DC and D′B/2. The older and more primitive Luzzati thickness DB uses a Gibbs dividing surface to partition D into a lipid region and a water region, thereby ignoring details of the interfacial headgroup region. Its location relative to more physical thicknesses varies from 1 Å larger than 2zPC for DMPC to 1 Å smaller for DOPC (Liu and Nagle, 2004). Finally, the width σCG of the Gaussian corresponding to the glycerol and carbonyls is smaller than the PC or terminal methyl Gaussians, consistent with the backbone of the molecule having the smallest molecular fluctuations.
CONCLUSIONS
In summary, we have continued the development of a new method that obtains structural data to higher qz and therefore better spatial resolution. We have combined this with data from unilamellar vesicles that are more accurate for lower qz values. Absolute electron density profiles have been obtained that distinguish two features in the headgroup region as well as the usual methyl trough. Results are reported here for the biologically most relevant fully hydrated fluid Lα phases of DMPC and DLPC. It is of interest to compare these results to recent results for DOPC with monounsaturated (18:1) hydrocarbon chains (Liu and Nagle, 2004). Even though DOPC has four more carbons per chain than DMPC, the hydrocarbon chain region is only 2 Å thicker. This contrasts with DLPC, which has only two fewer carbons per chain, but is 4.5 Å thinner than DMPC when measured at the same temperature. A correlative difference is the area A, which is much larger for DOPC (72.1 Å2) and is also somewhat larger for DLPC than for DMPC as shown in Table 2. The tighter packing associated with smaller A is also correlated with differences in the electron density profiles that include more conspicuous carbonyl-glycerol shoulders on the headgroup peaks, narrower and deeper methyl troughs, and higher headgroup peaks. These detailed differences should provide more stringent tests for simulations of lipid bilayers, as well as basic data to employ in biophysical modeling of a variety of problems in biomembranes.
Acknowledgments
We thank the various staff at CHESS, Ernie Fontes, Arthur Woll, and Detlef Smilgies. The sample chamber was built with resources obtained by Dr. Adrian Parsegian at the National Institutes of Health, Bethesda, MD, and Dr. Daniel Harries, in his group, participated in several collaborative runs that acquired these and other data of mutual interest.
We thank CHESS for providing beam time under National Science Foundation grant No. DMR-9311772. The Carnegie Mellon University effort was supported by National Institutes of Health grant No. GM44976 (J.F.N.).
References
- Armen, R. S., O. D. Uitto, and S. E. Feller. 1998. Phospholipid component volumes: determination and application to bilayer structure calculations. Biophys. J. 75:734–744. [DOI] [PMC free article] [PubMed] [Google Scholar]
- Balgavý, P., M. Dubničková, N. Kučerka, M. A. Kiselev, S. P. Yaradaikin, and D. Uhríková. 2001a. Bilayer thickness and lipid interface area in unilamellar extruded 1,2-diacylphosphatidylcholine liposomes: a small-angle neutron scattering study. Biochim. Biophys. Acta. 1512:40–52. [DOI] [PubMed] [Google Scholar]
- Balgavý, P., N. Kučerka, V. I. Gordeliy, and V. G. Cherezov. 2001b. Evaluation of small-angle neutron scattering curves of unilamellar phosphatidylcholine liposomes using a multishell model of bilayer neutron scattering length density. Acta Phys. Slov. 51:53–68. [Google Scholar]
- Barna, S. L., M. W. Tate, S. M. Gruner, and E. F. Eikenberry. 1999. Calibration procedures for charge-coupled device x-ray detectors. Rev. Sci. Instrum. 70:2927–2934. [Google Scholar]
- Caillé, A. 1972. Physique cristalline: remarques sur la diffusion des rayons X dans les smectiques. C. R. Acad. Sc. Paris Sie B. [in French]. 274:891–893. [Google Scholar]
- Cantor, R. S. 1999. Lipid composition and the lateral pressure profile in bilayers. Biophys. J. 76:2625–2639. [DOI] [PMC free article] [PubMed] [Google Scholar]
- Chu, N., N. Kučerka, Y. Liu, S. Tristram-Nagle, and J. F. Nagle. 2005. Anomalous swelling of lipid bilayer stacks is caused by softening of the bilayer modulus. Phys. Rev. E. In press. [DOI] [PubMed]
- Feigin, L. A., and D. I. Svergun. 1987. Structure Analysis by Small-Angle X-Ray and Neutron Scattering. Plenum Publishing, New York.
- Feller, S. E., D. Yin, R. W. Pastor, and A. D. MacKerell. 1997. Molecular dynamics simulation of unsaturated lipid bilayers at low hydration: parameterization and comparison with diffraction studies. Biophys. J. 73:2269–2279. [DOI] [PMC free article] [PubMed] [Google Scholar]
- Glatter, O., and O. Kratky. 1982. Small Angle X-ray Scattering. Academic Press, New York.
- Kiselev, M. A., D. Lombardo, A. M. Kisselev, and P. Lesieur. 2003. Structure factor of dimyristoylphosphatidylcholine unilamellar vesicles: small-angle x-ray scattering study. JINR Dubna. E19–2003–33.
- Koenig, B. W., H. H. Strey, and K. Gawrisch. 1997. Membrane lateral compressibility determined by NMR and x-ray diffraction: effect of acyl chain polyunsaturation. Biophys. J. 73:1954–1966. [DOI] [PMC free article] [PubMed] [Google Scholar]
- Kučerka, N., A. M. Kiselev, and P. Balgavý. 2004a. Determination of the bilayer thickness and lipid surface area in unilamellar dimyristoylphosphatidylcholine vesicles from small-angle neutron scattering curves: a comparison of evaluation methods. Eur. Biophys. J. 33:328–334. [DOI] [PubMed] [Google Scholar]
- Kučerka, N., J. F. Nagle, S. E. Feller, and P. Balgavý. 2004b. Models to analyze small-angle neutron scattering from unilamellar lipid vesicles. Phys. Rev. E. 69:051903. (1–9). [DOI] [PubMed] [Google Scholar]
- Lewis, B. A., and D. M. Engelman. 1983. Lipid bilayer thickness varies linearly with acyl chain length in fluid phosphatidylcholine vesicles. J. Mol. Biol. 166:211–217. [DOI] [PubMed] [Google Scholar]
- Liu, Y. 2003. New method to obtain structure of biomembranes using diffuse x-ray scattering: application to fluid phase DOPC lipid bilayers. PhD thesis. Carnegie Mellon University, Pittsburg, PA. [http://lipid.phys.cmu.edu/].
- Liu, Y., and J. F. Nagle. 2004. Diffuse scattering provides material parameters and electron density profiles of biomembranes. Phys. Rev. E. 69:040901. (1–4). [DOI] [PMC free article] [PubMed] [Google Scholar]
- Lyatskaya, J., Y. Liu, S. Tristram-Nagle, J. Katsaras, and J. F. Nagle. 2001. Method for obtaining structure and interactions from oriented lipid bilayers. Phys. Rev. E. 63:011907. (1–9). [DOI] [PMC free article] [PubMed] [Google Scholar]
- MacDonald, R. C., R. I. MacDonald, B. P. Menco, K. Takeshita, N. K. Subbarao, and L. R. Hu. 1991. Small-volume extrusion apparatus for preparation of large, unilamellar vesicles. Biochim. Biophys. Acta. 1061:297–303. [DOI] [PubMed] [Google Scholar]
- Nagle, J. F., and S. Tristram-Nagle. 2000. Structure of lipid bilayers. Biochim. Biophys. Acta. 1469:159–195. [DOI] [PMC free article] [PubMed] [Google Scholar]
- Nagle, J. F., and M. C. Wiener. 1988. Structure of fully hydrated bilayer dispersions. Biochim. Biophys. Acta. 942:1–10. [DOI] [PubMed] [Google Scholar]
- Nagle, J. F., and M. C. Wiener. 1989. Relations for lipid bilayers. Connection of electron density profiles to other structural quantities. Biophys. J. 55:309–313. [DOI] [PMC free article] [PubMed] [Google Scholar]
- Nagle, J. F., and D. A. Wilkinson. 1978. Lecithin bilayers. Density measurement and molecular interactions. Biophys. J. 23:159–175. [DOI] [PMC free article] [PubMed] [Google Scholar]
- Nawroth, T., H. Conrad, and K. Dose. 1989. Neutron small angle scattering of liposomes in the presence of detergents. Physica B (Amsterdam). 157:477–480. [Google Scholar]
- Needham, D., and E. Evans. 1988. Structure and mechanical properties of giant lipid (DMPC) vesicle bilayers from 20°C below to 10°C above the liquid crystal-crystalline phase transition at 24°C. Biochemistry. 27:8261–8269. [DOI] [PubMed] [Google Scholar]
- Pabst, G., M. Rappolt, H. Amenitsch, and P. Laggner. 2000. Structural information from multilamellar liposomes at full hydration: full q-range fitting with high quality x-ray data. Phys. Rev.E. Stat. Phys. Plasmas Fluids Relat. Interdiscip. Topics. 62:4000–4009. [DOI] [PubMed] [Google Scholar]
- Petrache, H. I., S. W. Dodd, and M. F. Brown. 2000. Area per lipid and acyl length distributions in fluid phosphatidylcholines determined by 2H NMR spectroscopy. Biophys. J. 79:3172–3192. [DOI] [PMC free article] [PubMed] [Google Scholar]
- Petrache, H. I., S. E. Feller, and J. F. Nagle. 1997. Determination of component volumes of lipid bilayers from simulations. Biophys. J. 72:2237–2242. [DOI] [PMC free article] [PubMed] [Google Scholar]
- Petrache, H. I., N. Guliaev, S. Tristram-Nagle, R. Zhang, R. M. Suter, and J. F. Nagle. 1998a. Interbilayer interactions from high-resolution x-ray scattering. Phys. Rev. E. 57:7014–7024. [Google Scholar]
- Petrache, H. I., S. Tristram-Nagle, and J. F. Nagle. 1998b. Fluid phase structure of EPC and DMPC bilayers. Chem. Phys. Lipids. 95:83–94. [DOI] [PMC free article] [PubMed] [Google Scholar]
- Petrache, H. I., S. Tristram-Nagle, K. Gawrisch, D. Harries, V. A. Parsegian, and J. F. Nagle. 2004. Structure and fluctuations of charged phosphatidylserine bilayers in the absence of salt. Biophys. J. 86:1574–1586. [DOI] [PMC free article] [PubMed] [Google Scholar]
- Rand, R. P., and V. A. Parsegian. 1989. Hydration forces between phospholipid bilayers. Biochim. Biophys. Acta. 988:351–376. [Google Scholar]
- Sachs, J. N., H. I. Petrache, and T. B. Woolf. 2003. Interpretation of small angle X-ray measurements guided by molecular dynamics simulations of lipid bilayers. Chem. Phys. Lipids. 126:211–233. [DOI] [PubMed] [Google Scholar]
- Torbet, J., and M. H. F. Wilkins. 1976. X-ray diffraction studies of lecithin bilayers. J. Theor. Biol. 62:447–458. [DOI] [PubMed] [Google Scholar]
- Tristram-Nagle, S., Y. Liu, J. Legleiter, and J. F. Nagle. 2002. Structure of gel phase DMPC determined by X-ray diffraction. Biophys. J. 83:3324–3335. [DOI] [PMC free article] [PubMed] [Google Scholar]
- Tristram-Nagle, S., R. Zhang, R. M. Suter, C. R. Worthington, W. J. Sun, and J. F. Nagle. 1993. Measurement of chain tilt angle in fully hydrated bilayers of gel phase lecithins. Biophys. J. 64:1097–1109. [DOI] [PMC free article] [PubMed] [Google Scholar]
- Wiener, M. C., R. M. Suter, and J. F. Nagle. 1989. Structure of the fully hydrated gel phase of DPPC. Biophys. J. 55:315–325. [DOI] [PMC free article] [PubMed] [Google Scholar]
- Wilkins, M. H. F., A. E. Blaurock, and D. M. Engelman. 1971. Bilayer structure in membranes. Nat. New Biol. 230:72–76. [DOI] [PubMed] [Google Scholar]