

Abstract
G-protein-coupled enzyme cascades are used by eukaryotic cells to detect external signals and transduce them into intracellular messages that contain biological information relevant to the cell's function. Since G-protein-coupled receptors that are designed to detect different kinds of external signals can generate the same kind of intracellular response, effective signaling requires that there are mechanisms to increase signal specificity and fidelity. Here we examine the kinetic equations for the initial three stages in a generic G-protein-coupled cascade and show that the physical properties of the transduction pathway result in two intrinsic features that benefit signaling. 1), The response to a single activated receptor is naturally confined to a localized spatial domain, which could improve signal specificity by reducing cross talk. 2), The peak of the response generated by such a signaling domain is limited. This saturation effect reduces trial-to-trial variability and increases signaling fidelity by limiting the response to receptors that remain active for longer than average. We suggest that this mechanism for reducing response fluctuations may be a contributing factor in making the single photon responses of vertebrate retinal rods so remarkably reproducible.
INTRODUCTION
The functional viability of multicellular organisms depends on their constituent cellular building blocks being able to communicate with each other. This requires that cells have a way to detect and respond specifically to select external signals. One of the most common strategies for doing this makes use of a three-stage G-protein-coupled enzyme cascade (Lodish et al., 2000). In the first stage, a specialized membrane receptor protein, R, is activated by its interaction with a specific external signal, such as by binding a particular ligand or absorbing a photon of a particular wavelength. In the second stage, the activated receptor, R*, turns on a heterotrimeric G-protein, G*, by catalyzing GDP/GTP exchange on the α-subunit of the protein. During the time it stays active, tR, a single R* will serially excite many G-proteins and thus amplify the original signal, i.e., one R* to many G*. In the third stage, each G* associates with an effector protein, E, forming a G*-E complex that stimulates the effector. We shall refer to the G*-E complex as the active effector, E*. Activated effector proteins are most commonly enzymes that control the level of an intracellular second messenger such as a cyclic nucleotide or Ca2+. The resulting change in second messenger concentration represents the output signal of the transduction process and is further amplified by each activated enzyme, E*, which turns over more than one substrate molecule.
The strength of the cascade's output signal, i.e., the size of the change in second messenger concentration, depends on how many effector enzymes are active and how long they stay active. Thus the overall gain of the cascade depends on the rate of its inactivation. This involves shutting off the two catalytically active intermediates, R* and E*. The life of the activated receptor, R*, and the steady production of G* it catalyzes, are terminated after receptor phosphorylation. The catalytic activity of E* is terminated when the GTPase activity of G* within the G*-E complex hydrolyzes GTP to GDP, leading to the dissociation of the complex and the shutting off of effector activity. The G-protein, in its inactive (GDP-bound) state is no longer able to excite the effector and E* returns to it resting state. Additional elements, which control both R* shutoff and the intrinsic activity of G-protein GTPase (Berman and Gilman, 1998; He et al., 1998; Makino et al., 1999; Arshavsky et al., 2002) provide a mechanism for gain control. Our treatment of the G-protein cascade considers the pathway only so far as the activation of effector enzyme; it does not include the dynamics of the second messenger signal.
The activated elements of the cascade (R*, G*, and E*) that ultimately generate the second messenger signal are all membrane-associated and diffuse two-dimensionally on the membrane surface. Here we consider two inherent properties of signals that arise as a consequence of being generated by an amplified enzyme cascade that is confined to the membrane. By examining the first steps of G-protein signaling that follow the excitation of a single receptor we show that the resulting activity of the effector enzyme is naturally localized to a small ∼1 μm radius response domain and the peak amplitude of the response is limited. Both of these built-in effects would serve to benefit the signaling process. The establishment of a localized signaling domain would reduce cross talk and improve signal specificity. Limiting the peak amplitude of the response would decrease trial-to-trial variability and thus increase response reproducibility and signal fidelity.
Our analysis is relevant to membrane-localized enzyme cascades in general, but our treatment is guided specifically by the phototransduction process in vertebrate retinal rods. We have chosen this as our model because it is the most thoroughly studied and best-understood example of G-protein-coupled signaling (Stryer, 1991; Baylor, 1996). The basic scheme is the same as the generic one described above. An external signal (a visible photon) activates a membrane receptor (rhodopsin, Rh). The light-activated receptor (Rh*) serially activates many G-proteins (also known as transducin, or T) molecules. The activated transducin (T*) stimulate one-to-one an equal number of effector enzymes (phosphodiesterase; i.e., PDE). The activated phosphodiesterase (PDE*) hydrolyzes cyclic nucleotides (cyclic GMP; i.e., cGMP), generating an amplified second messenger signal consisting of a fall in the resting level of cGMP. In retinal rods the drop in cGMP closes ion channels that are opened by binding cGMP (cyclic nucleotide-gated channels). This reduces the standing inward cationic current that circulates through the rod in darkness and completes the phototransduction process that converts light into an amplified electrical signal, a change in cell membrane potential.
Another reason we have focused our attention on phototransduction is that our analysis considers the events that follow the activation of a single receptor molecule. Detailed information about the signal that G-protein-coupled cascades produce in response to a single activated receptor molecule is only available for photoreceptors, which produce a robust response to the absorption of a single photon (Baylor, 1984).
The G-protein module
The analysis begins by considering the rate equations that describe the localized activation and deactivation of G-protein and effector enzyme caused by activated receptor R*:
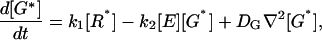 |
(1) |
 |
(2) |
In addition to formation and destruction of active species these equations describe their diffusion on the membrane, away from their sites of production. The G-protein and effector enzyme are membrane-associated proteins and their concentrations are expressed as areal densities (number per μm2) denoted by the bracket […]. Their diffusion coefficients DG and DE are reported (Pugh and Lamb, 1993; Lamb, 1994) to have similar values in the 1–2 μm2/s range. The constant k1 is the rate of activation of G* by R*. More generally this process obeys Michaelis-Menten kinetics, k1[R*]/(1+Km/[G]), which we assume operates in the saturation limit when [G] ≫ Km, as is apparently the case for phototransduction. The kinetic constant k2, describes the formation of the G*-E complex and thus the production of E*. The rate of E* decay is governed by kH, the rate of G* inactivation due to GTP hydrolysis by the G-protein's GTPase activity within the G*-E complex. We assume that E and E* have the same diffusivity (DE). As a result, the total E concentration, [Etot] = [E] + [E*], satisfies a simple diffusion equation, and is taken to be a constant in this study.
The kinetic equations (Eqs. 1 and 2) do not describe the full G-protein cycle, nor do they consider the possible dissociation of G* from the membrane, which might become important under conditions of prolonged strong excitation (Chabre and Deterre, 1989; Heck and Hofmann, 1993, 2001). Nevertheless, they can be used to describe the response evoked by the activation of a single receptor molecule. In the continuum kinetic equation description employed here, single receptor activation is represented as a density of active receptor, [R*] = A(t)δ(r–r*), sharply peaked at the location, r*, of the active receptor molecule and non-zero only over the time interval 0 < t < tR, where tR denotes the shutoff time of the activated receptor (note A(t) = 1 for 0 < t < tR). The shutoff of the active receptor is a random variable with an average lifetime, τR, which is controlled by the rate of receptor phosphorylation and arrestin binding (Chabre and Deterre, 1989; Stryer, 1991; Helmreich and Hofmann, 1995). The difference between tR (the shutoff time of a single activated receptor for a single trial) and lifetime τR (defined as the average tR taken over many trials) is important, and will come up later in the analysis.
Note that this description does not prevent the incorporation of other general properties of G-protein signaling. For example, multistep deactivation of R* may be accommodated by endowing tR with an appropriate sub-Poisson statistical distribution, whereas the diffusion of R* may be represented by making the locus of activity, r*, follow a random trajectory and averaging E* activation patterns over all possible trajectories.
Localization of G-protein signaling
Let us consider a response defined as the effector activity generated by a single catalytically active receptor molecule acting as a point source of [G*]. The details of the analysis can be found in the Appendix. In the text we describe the physical mechanism of signal localization and saturation and then describe the relationships between particular parameters and the properties of the localization and saturation process. A full quantitative description obtained by the numerical solution of Eqs. 1 and 2, as described in the Appendix, is presented in the figures. To simplify the discussion we shall presently ignore effector diffusion, for it does not affect the key aspects of the mechanism.
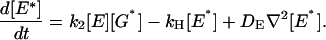
Free G* will spread spatially from its site of production with a characteristic length, ld, that represents a competition between its outward diffusion and its sequestration, upon binding with free E, into a G*-E complex. This length can be expressed as
 |
(3) |
and is quite short (<100 nm using the parameters in Table 1, and assuming that free effector concentration is of the order of total effector concentration [Etot].) The one-to-one association of G* and E to produce E*, reduces free [E].
TABLE 1.
Rod phototransduction parameter values
| Description | Value | Reference |
|---|---|---|
| DG | 1.2 μm2/s | Pugh and Lamb (1993) |
| kH | 10 s−1 | Chen et al. (2000) |
| k1 | 100–1000 s−1 | Pugh and Lamb (1993); Kahlert and Hofmann (1991); Leskov et al. (2000) |
| k2 | 1 μm2/s | Pugh and Lamb (1993) |
| [Rhodopsin] | 25,000 μm−2 | Hamm and Bownds (1986) |
| [Transducin] | 2500 μm−2 | Pugh and Lamb (1993) |
| [Phosphodiesterase] | 200 μm−2 | Dumke et al. (1994) |
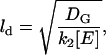
The resulting initial response domain will have different properties depending on whether the rate of G* activation is large or small compared to the rate of E* (i.e., G*-E complex) deactivation. If the recovery of free E, which follows GTP hydrolysis within the complex, is faster than the rate of G* production, then there will always be free E on hand to bind to free G* and prevent its outward spread. For this to happen k1 must be less than the maximum rate of E recovery within the activated area ( ), which we estimate as
  —note that, in the subsaturated condition, [E*] < [E]). Thus a single molecule of activated receptor (R*) will give rise to a spatially localized subsaturated response domain when k1 < (πDGkH/k2)([E*]/[E]) < πDGkH/k2. It is convenient to define a saturation parameter (S) as
 |
(4) |
The subsaturated response domain described above corresponds to S < 1. When S > 1, the deactivation of E*, and recovery of free E, is slower than the rate of G* production. Under these conditions after a time, 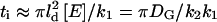 (∼3–10 ms for rod phototransduction), nearly all the effector molecules in the initial response domain will be excited, forming an area of saturated activity. This means that if R* remains active for a time longer than ti, G* will no longer be completely absorbed by free E within the ld region. Molecules of G* will spill out of the initial response domain and proceed to expand with a radius, r, growing with time as
 |
(5) |
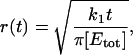
so that the total number of activated effectors, E*, will increase as k1t. This process is illustrated in Fig. 1. The expansion of the response domain continues until it reaches a maximum radius, rmax, which is on the order of 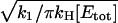 . We refer to this process as spot formation. It develops with a characteristic time, tS, which is on the order of 1/kH. The internal consistency of this argument requires that the time for spot formation, tS, be longer than the time it takes for G* to spread by free diffusion over a distance on the same scale as rmax. This time is
  provided
  This condition is satisfied for the rod parameters in Table 1.
FIGURE 1.

Localization of G-protein and effector activation. Hexagon represents location of single active receptor molecule, which activates G-proteins. Active G-protein (solid circles) diffuses outward, binds to the effector and activates it (open circles). Green denotes the activation front which moves out with time and if receptor activity persists, eventually converging to the stationary active spot boundary. See text for details.
Fig. 2 shows the space and time evolution of the effector response triggered by a single active receptor molecule. The traces present the results of the numerical solution of Eqs. 1 and 2 for S > 1. They show snapshots of the spatial profile of the response at different times. As time increases, the response (the spatial distribution of [E*]) converges to a stationary profile and does not change further with time. This illustrates the process of spot formation discussed above and shows that the limiting profile of the response is a saturated area of effector activity. Total effector activation in the case of continuous receptor activity is shown as a function of time in Fig. 3. As the saturated spot forms, the total number of active effectors E* approaches a limit (Fig. 3 a) equal to k1/kH — a result derived in the Appendix. Fig. 3, b and c, compare the effect for two different values of k1 and three different values of kH. In these figures the active effector number is normalized to the amplitude of the saturated response (k1/kH) and time is measured in the units of 1/kH. Normalizing the response and time axes in this way shows that the characteristic time of saturation, tS, (defined quantitatively as the time for half-maximum effector activation), scales with (and is approximately equal to)  with only a weak dependence on k1. The maximal active domain size, rmax, as a function of kH, is shown in Fig. 4. Spot size scales as
  .
.
FIGURE 2.

The fraction of activated effector is shown as a function of the distance from the excited receptor molecule at various times. The outermost curve corresponds to the saturated spot profile corresponding to stationary response to continuous receptor activity, and the inner curves represent the snapshots of the profile at earlier times, as this stationary profile is approached. Snapshots are taken at t = 0.015, 0.02, 0.025, 0.05, 0.1, 0.15, 0.2, 0.25, … 3.0 in units of 1/kH. Parameters are kH = 3 s−1, k1 = 103 s−1, and k2 = DG = 1 μm2/s; the total effector density is [ Etot ] = 200 μm−2.
FIGURE 3.

(a) Total effector activation as a function of time for a set of different kH values and fixed k1 = 103 s−1 (and other parameters the same as in Fig. 2). Maximal activation and the characteristic time of saturation (tS defined as time corresponding to half-maximal activation) both decrease with increasing kH. (b) Same as a but with E* scaled with k1/kH and time in units of 1/kH. The fact that they asymptotically approach 1, shows that maximal activation is equal to k1/kH (as derived in the Appendix). Near-collapse of the curves also shows that the characteristic time of saturation (tS) scales with 1/kH. Furthermore, to the extent that half-activation occurs at tkH ≈ 1, we have tS ≈ kH. (c) Same as b, but with k1 = 102 s−1. Similarity of b and c indicates that the effect of decreasing k1 is mostly limited to decreasing the total activation level absorbed (in b and c) by rescaling the ordinate (E*) with k1/kH.
FIGURE 4.

Radius of the saturation spot, rmax, as a function of kH, with k1=103 s−1.
The effect of this localized saturation on the actual response depends on the duration of receptor activity. The plots in Fig. 3, b and c, show the growth of normalized effector activity (E*(t)) in response to a maintained step of receptor activation. The effector response to a pulse of receptor activity staying on for time tR, would depart from the time course of the response to a step, only after receptor shutoff at tR — at which time the growth of E* would slow, reach a peak and begin to decline as recovery took over. Hence, the peak amplitude of the response, as a function of time (Ep*(t)), closely follows the behavior of E*(t). Fig. 5 presents Ep*(t) determined from the numerical solution of Eqs. 1 and 2, as described in the Appendix. Since the timescale in this figure is in units of 1/kH, which, as discussed above, is on the order of tS, it can also be read as the ratio of tR to tS. Thus, for example, when tR is equal to tS, the peak amplitude of the response would be ∼55% saturated.
FIGURE 5.

Peak effector activation in response to single receptor activity with duration tR. The curve is a result of a numerical simulation with the same parameters as in Fig. 2.
Our analysis has, for simplicity's sake, ignored the diffusion of R* and E*. These additional diffusive processes are similar in effect to an increase in DG and lead to the reduction of the saturation parameter S. Yet, since our estimated value of S, based on Table 1 parameters, is in the range of 10–100 and thus is much larger than 1, its reduction — even by a factor of 2 or 3 — would not take the system out of the S > 1 regime analyzed above. Note also that in the regime corresponding to this condition, the size of the spot and the peak amplitude of effector activity are independent of diffusivity and are determined by the balance of k1 and kH.
Response fidelity
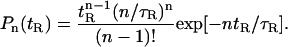
The output signal of a generic G-protein-coupled enzyme cascade is a change in the level of a soluble second messenger, e.g., a change in cGMP in the case of the retinal rod. The amplitude of the output signal evoked by a single activated receptor depends on how many effector enzymes are activated and how long they stay active. Since the output of an amplified enzymatic cascade is more strongly influenced by changes in upstream events than downstream events, which pass through fewer amplified stages, variations in the amplitude of the output signal would be dominated by noise in the earliest stage of the cascade, i.e., activation of G* by R*. The trial-to-trial variation in the signal generated by a single molecule of R* has only been studied in photoreceptors. This is because the phototransduction cascade is highly amplified and responses evoked by single photon absorptions, i.e., single R* responses, can be identified and recorded. Rod single photon responses are robust and remarkably reproducible; their mean amplitude is 4–5 times larger than the standard deviation of the fluctuations in their amplitude (Baylor et al., 1979, 1980, 1984; Rieke and Baylor, 1996, 1998; Whitlock and Lamb, 1999; Field and Rieke, 2002; Hamer et al., 2003). The explanation(s) for this exceptionally low variability has not been fully established, but the trial-to-trial variation in the amplitude of the single photon response is recognized to arise predominantly from randomness in shutting off receptor activity. If receptor shutoff were a single-step process occurring at a certain rate, the fluctuations of the shutoff time tR would have Poisson statistics so that the standard deviation of tR would be equal to its mean. To suppress noise down to the level observed at the output would require shutoff to be a much less noisy process, which would be the case if it involved multiple steps occurring sequentially with equal rates. If this were the only mechanism for noise suppression in the transduction pathway, 16 R* shutoff steps would be required for a rod to produce single photon responses with a coefficient of variation, Q — defined as the ratio of the standard deviation to the mean — of 0.25 as observed (number of steps = (1/Q)2) (Rieke and Baylor, 1998).
Another mechanism that would act to reduce response variability and arises as a natural consequence of the properties of a G-protein-coupled enzyme cascade is spot formation, described above. As illustrated in Fig. 2, the effector response to a single R* converges on a stable response profile which ceases to depend on R* lifetime. This would reduce the overall variability of the responses by making all the responses evoked by R*s that lived longer than a certain time, essentially identical.
In our analysis, response variability was estimated from the dependence of the peak effector response on the shutoff time tR (see Fig. 5). The coefficient of variation, 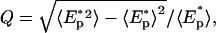 was used to evaluate response variability, where Ep* represents the peak effector response. The averaging 〈…〉 is taken over tR, which is governed by the probability distribution of shutoff times, Pn(tR), with the average shutoff time 〈tR〉 = τR,
 |
(6) |
This probability distribution corresponds to deactivation via n steps with equal rates n/τR and is a generalization of the simple Poisson distribution of shutoff times (n = 1). Fig. 6 plots Q for the peak effector response as a function of τR kH obtained from the numerical solution of Eqs. 1 and 2, as illustrated in Fig. 5. The different curves in Fig. 6 show the decrease in Q, i.e., the decrease in noise, due to spot formation for R* shutoff with different numbers of shutoff steps. The decrease in variability is due to the sublinearity and saturation of the effector response. The quantitative contribution of this effect is evident from comparing Q (τR kH; n) with Q(0; n) which corresponds to the limit where response is directly proportional to on-time Ep* = k1tR.
FIGURE 6.

Coefficient of variation (ratio of standard deviation to the mean) for peak response as a function of τR. Averages are taken in the ensemble of responses with random shutoff times governed by n = 1,2,3,4 step Poisson processes with the average shutoff time given by τR. Note that with τR kH value of, say, 1.5, there is a significant reduction of the coefficient of variation (denoted by Q in the text) even for n = 2. This reduction occurs because the sublinear behavior of the peak response, as a function of the shutoff time (tR) (see Fig. 5), reduces the contribution of the events with late receptor shutoff times to the trial-to-trial variability of the responses.
DISCUSSION
G-protein-coupled pathways are designed to couple the activation of a surface membrane receptor to the stimulation of an intracellular effector enzyme. We analyzed the kinetic equations (Eqs. 1 and 2) constituting a simplified model for the enzyme cascade that underlies generic G-protein-coupled signaling focusing on the response to single receptor activation. The results show that the three-step cascade has two features: 1), localization of effector activation and 2), signal saturation—which arise as a natural consequence of the physical properties of signaling. These features could benefit the signaling process by acting to reduce cross talk and increase response fidelity, respectively.
Cross talk
Typical mammalian cells have a large number of different G-protein-coupled receptors that converge to control a much smaller population of different effector enzymes. By virtue of this arrangement it is possible for the same type of effector to be stimulated by different surface receptors that respond to different external signals (Birnbaumer, 1990; Gundermann et al., 1996). In addition, the three principal elements in the cascade (R, G, and E) are all membrane-associated and diffuse two-dimensionally on its surface. This would be expected to further confuse signal specificity by providing an opportunity for diffusion to drive promiscuous interactions between the three components of the cascade, thus making it harder to use a nonspecific change in effector enzyme activity as a message about the detection of a specific external signal. Despite these expected signaling problems, it is well documented that G-protein-coupled signaling pathways are commonly used to produce selective cellular responses to specific stimuli (Gilman, 1987). This shows that there are cell mechanisms to increase signal specificity. One well-recognized mechanism that biology uses to limit the confusion due to cross talk is to physically contain the elements of a cascade that are coupled to a specific receptor. This is done either by fencing them in (by forming a molecular corral made of distinct lipid and protein elements; Okamoto et al., 1998; Fagan et al., 2000; Steinberg and Brunton, 2001) or by tying them up (with scaffolding proteins to tether the components together into a multimolecular transduction complex; Steinberg and Brunton, 2001; Colledge and Scott, 1999; Brady and Limbird, 2002; Albert and Robillard, 2002).
Our analysis shows that in addition to these molecular mechanisms for physical containment, the spatial spread of the effector response of a generic G-protein cascade is self-limiting and naturally forms a restricted signaling domain in the vicinity of the activated membrane receptor. The properties of the localization domain depend essentially on the ratio of the rate of G* production, k1, to the rate of E* inactivation, kH, which enters the saturation parameter S (defined by Eq. 4). Saturation parameter S controls the crossover to the saturated spot response, where a local domain of activated effector forms with an area increasing with the time that the receptor has been active until saturating at the maximal radius rmax (given by Eq. 5). Using photoreceptor parameters we estimate the maximum radius of the signaling domain to be ∼1 μm. We note that the size of the signaling domain and the maximal signal amplitude can be controlled by k1 and kH parameters and hence by controlling, respectively, the G-protein concentration and the concentration (or activity) of the RGS proteins (Berman and Gilman, 1998; He et al., 1998; Makino et al., 1999; Arshavsky et al., 2002), which modulate the GTPase activity of G* to influence kH. These regulatory knobs could provide cells with a mechanism for adapting their response to the stimulus. In any case, to the extent that local signaling domains can reduce cross talk, our analysis shows that cross-talk suppression is an intrinsic feature of the G-protein-coupled enzyme cascade.
Response fidelity
The effector activation process results in a sublinear, saturating dependence of peak effector activity on the on-time of a single R* so that for long on-times the response becomes independent of the duration of R* activity. This acts to decrease the fluctuations in peak amplitude that would normally arise from random variation in the shutoff time (tR) of R*s and thus serves to increase signal fidelity. This effect, which we have referred to as spot formation, may be a contributing factor in the remarkable reproducibility of the single photon response.
Its influence on the trial-to-trial variability of single R* responses, as measured by the coefficient of variation of the responses, is shown in Fig. 6 for different values of the τR. The coefficient of variation of rod single photon responses is ∼0.25 (Baylor et al., 1979; Rieke and Baylor, 1998; Whitlock and Lamb, 1999; Hamer et al., 2003). Fig. 6 shows that this level of reproducibility can be achieved if the τRkH is sufficiently large and that the value required for a given Q decreases with increasing number of R* deactivation steps, n. Thus for n = 4, we find that Q = 0.25 can be obtained for τR kH ≈ 2. On the other hand, looking at Fig. 5 we note that for τR this large, typical responses—ones with tR ≈ τR—would have peak response within ∼20% of saturation. A somewhat shorter lifetime, such that τR kH = 1.5, would keep the average response further from saturation, yet decrease Q to 0.6 for n = 1 and to 0.3 for n = 4.
In a previous study Rieke and Baylor (1998) considered the possibility that response saturation suppresses variability and plays a role in the reproducibility of single photon responses. They dismissed this idea, however, by arguing that responses were not saturated because an experimental manipulation that prolonged the lifetime of Rh*, i.e., increased τR, also increased the peak amplitude of the response. Our results are in fact consistent with this observation, since we see in Fig. 5 that the peak response corresponding to τR kH = 1.5 is well below saturation. The reduction of variability that we are talking about comes from a more subtle effect than outright total effector saturation. The crossover to saturation as a function of the shutoff time selectively suppresses the peaks of the responses evoked by R* activation events with long on-times. These are the events that correspond to the tail of the tR distribution, P(tR), when tR > τR. Thus the variability can be suppressed even while the typical events with tR ≈ τR are relatively unaffected by saturation.
To further evaluate our analysis with respect to the observed statistical properties of rod single photon responses (Whitlock and Lamb, 1999; Field and Rieke, 2002), we consider a time-resolved measure of response variability. Fig. 7 compares the time courses of the average response with the trial-to-trial standard deviation of the response all computed numerically in ensembles of simulated responses to receptor activation events with Pn(tR) distribution of shutoff times and τR kH = 1.5. The results show that the peak of Q(t) lags behind the peak of the mean response, consistent with the results of Field and Rieke (2002).
FIGURE 7.

The time course of the trial-to-trial standard deviation (solid line) of the responses is compared to the time course of the average response (dashed line). Based on the same numerical simulation as Fig. 6 with τR kH = 1.5. Red, blue, and green curves correspond respectively to n = 1,2,4 shutoff steps. Note that the peak of standard deviation is delayed relative to the peak of the average response.
We conclude, although we cannot prove here, that the spot-formation mechanism contributes to the high fidelity of single photon responses in rod cells. We have demonstrated that: 1), suppression of response variability is a natural consequence of the G-protein-mediated signaling cascade and 2), the proposed mechanism is not inconsistent with experimental observations of single photon response variability. Finally, we note that reduction of the coefficient of variation down to 0.25 is likely to be a multifactorial phenomenon with the abovementioned mechanism being one of several components.
Acknowledgments
Authors acknowledge stimulating discussions with F. Rieke.
This work was supported in part by National Institute of General Medical Sciences grant No. GM67794 (to B.I.S.) and National Eye Institute grant No. EY02048 (to P.B.D.).
APPENDIX: LOCALIZATION OF G-PROTEIN SIGNALING
In this Appendix we present the details of the calculations of the E* spot formation by analyzing Eqs. 1 and 2. [G*] and [E*] are, respectively, the areal density of activated G-proteins and of activated effector, whereas  is the areal density of inactive or free effector. We are interested in the effect of a single activated receptor molecule, which we assume to be at the origin of our coordinate system, r = 0, and to stay active for time t, 0 < t < tR. Then active receptor areal density
 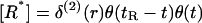 where δ(2)(r) denotes a two-dimensional Dirac delta function and function θ(t) = 1 for t ≥ 0 and equal to 0 for t < 0. In our further analysis, for the sake of simplicity we neglect the diffusion of E, since it does not qualitatively change the results. To produce full time-dependent solutions, equations were integrated numerically in MatLab (The MathWorks, Natick, MA).
Axially symmetric solutions are conveniently described in polar coordinates. To deal with the diffusion term, the solution was sought as a linear superposition of Bessel functions J0(βm r) (Abramowitz and Stegun, 1965) where βm forms the root of J0(z):
 |
Since Bessel functions are the eigen-functions of the Laplacian ∇2 J0(β r) = −β2 J0 (β r), the partial differential equations (Eqs. 1 and 2) in the Bessel basis (i.e., in terms of am and bm) reduce to a system of ordinary differential equations which are integrated numerically using an Adams-Bashforth (Stoer and Bulirsch, 1992) method with the linear terms of Eq. 1 advanced in time using an implicit scheme (Stoer and Bulirsch, 1992). The nonlinear (k2 term) is evaluated at the preceding time step by going back to r-space, i.e., by recomputing G*(r,t) and E(r,t). Keeping 200 Bessel modes will provide sufficient convergence and allow rapid integration in MatLab.
Let us consider the stationary state, which can be reached in the absence of receptor deactivation:
 |
 |
Eliminating the k2 [E][G*] term and integrating the resulting equation over space removes the diffusion terms and yields an exact expression for the maximal number of activated E* molecules in a saturated spot: k1/kH .
References
- Abramowitz, M., and I. Stegun. 1965. Handbook of Mathematical Functions. Dover Publications, Mineola, NY.
- Albert, P. R., and L. Robillard. 2002. G-protein specificity: traffic direction required. Cell Signal. 14:407–418. [DOI] [PubMed] [Google Scholar]
- Arshavsky, V. Y., T. D. Lamb, and E. N. Pugh, Jr. 2002. G-proteins and phototransduction. Annu. Rev. Physiol. 64:153–187. [DOI] [PubMed] [Google Scholar]
- Baylor, D. A. 1996. How photons start vision. Proc. Natl. Acad. Sci. USA. 93:560–565. [DOI] [PMC free article] [PubMed] [Google Scholar]
- Baylor, D. A., B. J. Nunn, and J. L. Schnapf. 1984. Photocurrent, noise, and spectral sensitivity of rods of the monkey Macaca fascicularis. J. Physiol. 357:575–607. [DOI] [PMC free article] [PubMed] [Google Scholar]
- Baylor, D. A., G. Matthews, and K.-W. Yau. 1980. Two components of electrical dark noise in toad retinal rod outer segments. J. Physiol. 309:591–621. [DOI] [PMC free article] [PubMed] [Google Scholar]
- Baylor, D. A., T. D. Lamb, and K.-W. Yau. 1979. Responses of retinal rods to single photons. J. Physiol. 288:613–634. [PMC free article] [PubMed] [Google Scholar]
- Berman, D. A., and A. G. Gilman. 1998. Mammalian RGS proteins: barbarians at the gate. J. Biol. Chem. 273:1269–1272. [DOI] [PubMed] [Google Scholar]
- Birnbaumer, L. 1990. G-proteins in signal transduction. Annu. Rev. Pharmacol. Toxicol. 30:675–705. [DOI] [PubMed] [Google Scholar]
- Brady, A. E., and L. E. Limbird. 2002. G-protein-coupled receptor interacting proteins: emerging roles in localization and signal transduction. Cell. Signal. 14:297–309. [DOI] [PubMed] [Google Scholar]
- Chabre, M., and P. Deterre. 1989. Molecular mechanism of visual transduction. Eur. J. Biochem. 179:255–266. [DOI] [PubMed] [Google Scholar]
- Chen, C.-K., M. E. Burns, W. He, T. G. Wensel, D. A. Baylor, and M. I. Simon. 2000. Slowed recovery of rod photoreceptors in mice lacking the GTPase accelerating protein RGS9-1. Nature. 403:557–560. [DOI] [PubMed] [Google Scholar]
- Colledge, M., and J. D. Scott. 1999. AKAPs: from structure to function. Trends Cell Biol. 9:216–221. [DOI] [PubMed] [Google Scholar]
- Dumke, C. L., V. Y. Arshavsky, P. D. Calvert, M. D. Bownds, and E. N. Pugh, Jr. 1994. Rod outer segment structure influences the apparent kinetic parameters of cyclic GMP phosphodiesterase. J. Gen. Physiol. 103:1071–1098. [DOI] [PMC free article] [PubMed] [Google Scholar]
- Fagan, K. A., K. E. Smith, and D. M. F. Cooper. 2000. regulation of the Ca2+-inhibitable adenylyl cyclase type VI by capacitative Ca2+ entry requires localization in cholesterol-rich domains. J. Biol. Chem. 275:26530–26537. [DOI] [PubMed] [Google Scholar]
- Field, G. D., and F. Rieke. 2002. Mechanisms regulating variability of the single photon response of mammalian rod photoreceptors. Neuron. 35:733–747. [DOI] [PubMed] [Google Scholar]
- Gilman, A. G. 1987. G-proteins: transducers of receptor-generated signals. Annu. Rev. Biochem. 56:615–649. [DOI] [PubMed] [Google Scholar]
- Gundermann, T., F. Kalkbrenner, and G. Schultz. 1996. Diversity and selectivity of receptor-G-protein interaction. Annu. Rev. Pharmacol. Toxicol. 36:429–459. [DOI] [PubMed] [Google Scholar]
- Hamm, H. E., and M. D. Bownds. 1986. Protein complement of rod outer segments of frog retina. Biochemistry. 25:4512–4523. [DOI] [PubMed] [Google Scholar]
- Hamer, R. D., S. C. Nicholas, D. Tranchina, P. A. Liebman, and T. D. Lamb. 2003. Multiple steps of phosphorylation of activated rhodopsin can account for the reproducibility of vertebrate rod single-photon responses. J. Gen. Physiol. 122:419–444. [DOI] [PMC free article] [PubMed] [Google Scholar]
- He, W., C. W. Cowan, and T. G. Wensel. 1998. RGS9, a GTPase accelerator for phototransduction. Neuron. 20:95–102. [DOI] [PubMed] [Google Scholar]
- Heck, M., and K. P. Hofmann. 1993. G-protein-effector coupling: a real-time light-scattering assay for transducin-phosphodiesterase interaction. Biochemistry. 32:8220–8227. [DOI] [PubMed] [Google Scholar]
- Heck, M., and K. P. Hofmann. 2001. Maximum rate and nucleotide dependence of rhodopsin-catalyzed transducin activation: initial rate analysis based on a double displacement mechanism. J. Biol. Chem. 276:10000–10009. [DOI] [PubMed] [Google Scholar]
- Helmreich, E. J. M., and K. P. Hofmann. 1995. Structure and function of proteins in G-protein-coupled signal transfer. Biochim. Biophys. Acta. 1286:285–322. [DOI] [PubMed] [Google Scholar]
- Kahlert, M., and K. P. Hofmann. 1991. Reaction rate and collision efficiency of the rhodopsin-transducin system in intact retinal rods. Biophys. J. 59:375–386. [DOI] [PMC free article] [PubMed] [Google Scholar]
- Lamb, T. D. 1994. Stochastic simulation of activation in the G-protein cascade of vision. Biophys. J. 67:1439–1454. [DOI] [PMC free article] [PubMed] [Google Scholar]
- Leskov, I. B., V. A. Klenchin, J. W. Handy, G. G. Whitlock, V. I. Govardovskii, M. D. Bownds, T. D. Lamb, E. N. Pugh, Jr., and V. Y. Arshavsky. 2000. The gain of rod phototransduction: reconciliation of biochemical and electrophysiological measurements. Neuron. 27:525–537. [DOI] [PubMed] [Google Scholar]
- Lodish, H., A. Berk, S. L. Zipursky, P. Matsudaira, D. Baltimore, and J. Darnell. 2000. Molecular Cell Biology, 4th Ed. W.H. Freeman, New York. 849–877.
- Makino, C. L., J. W. Handy, T. Li, and V. Y. Arshavsky. 1999. The GTPase activating factor for transducin in rod photoreceptors in the complex between RGS9 and type 5 G-protein β-subunit. Proc. Natl. Acad. Sci. USA. 96:1947–1952. [DOI] [PMC free article] [PubMed] [Google Scholar]
- Okamoto, T., A. Schiegel, P. E. Scherer, and M. P. Lisanti. 1998. Caveolins, a family of scaffolding proteins for organizing “preassembled signaling complexes” at the plasma membrane. J. Biol. Chem. 273:5419–5422. [DOI] [PubMed] [Google Scholar]
- Pugh, E. N., Jr., and T. D. Lamb. 1993. Amplification and kinetics of the activation steps in phototransduction. Biochim. Biophys. Acta. 1141:111–149. [DOI] [PubMed] [Google Scholar]
- Rieke, F., and D. A. Baylor. 1998. Origin of reproducibility in the responses of retinal rods to single photons. Biophys. J. 75:1836–1857. [DOI] [PMC free article] [PubMed] [Google Scholar]
- Rieke, F., and D. A. Baylor. 1996. Molecular origin of continuous dark noise in rod photoreceptors. Biophys. J. 71:2553–2572. [DOI] [PMC free article] [PubMed] [Google Scholar]
- Steinberg, S. F., and L. L. Brunton. 2001. Compartmentation of G-protein-coupled signaling pathways in cardiac myocytes. Annu. Rev. Pharmacol. Toxicol. 41:751–773. [DOI] [PubMed] [Google Scholar]
- Stoer, J., and R. Bulirsch. 1992. Introduction to Numerical Analysis, 2nd Ed. Springer, New York.
- Stryer, L. 1991. Visual excitation and recovery. J. Biol. Chem. 266:10711–10714. [PubMed] [Google Scholar]
- Whitlock, G. G., and T. D. Lamb. 1999. Variability in the time course of single photon responses from toad rods: termination of rhodopsin's activity. Neuron. 23:337–351. [DOI] [PubMed] [Google Scholar]