
Figure 1.
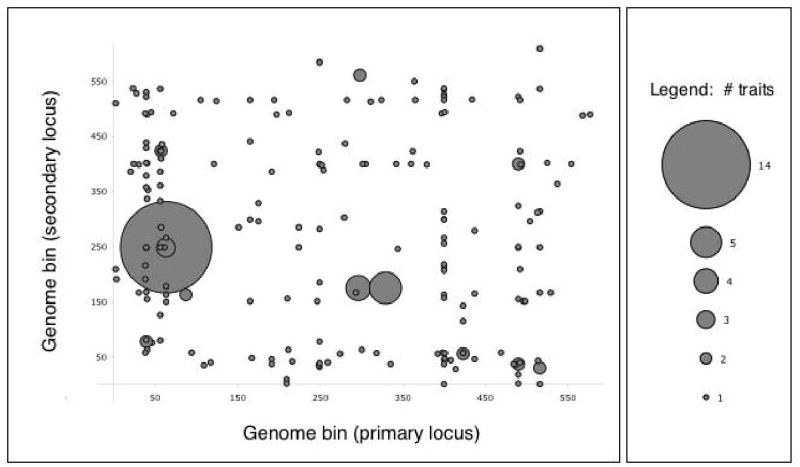
Genome distribution of QTL pairs detected by the two-stage linkage search. On each axis the genome is divided into 611 bins of 20 kb each, shown in chromosomal order. The set of transcripts mapping to QTLs in each pair of bins in the two-stage analysis is represented as a circle, with the width proportional to the number of such co-linking transcripts; circles are centered on the corresponding bins. The largest circle represents the MAT-GPA1 locus pair.