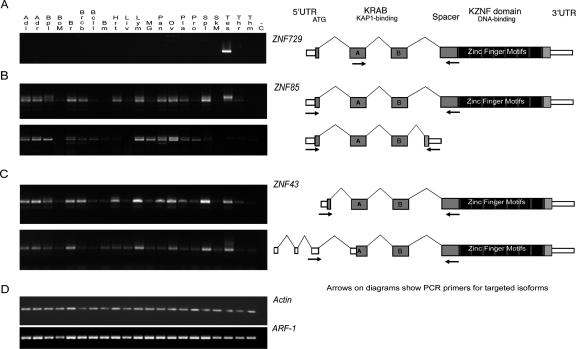
Figure 7.
RT–PCR gels showing the expression patterns for (A) the KRAB-ZNF gene ZNF729 (a ZNF91 subfamily member on chromosome 19), (B) alternate splice variants of ZNF85 with and without the zinc fingers exon, and (C) alternate splice variants of ZNF43 with different 5′ ends and start sites. Diagrams at right indicate primer locations (arrows) designed to selectively amplify the depicted isoforms for ZNF43 and ZNF85. Notably, each of these isoforms has its first exon within a HERV70/ERV1 LTR repeat. Predicted 5′ ends on many (but not all) of the genes in the cluster overlap with the same type of LTR repeat sequence, which may indicate that the repeats are involved in driving gene expression, as has been shown previously for other genes including related zinc finger genes (Di Cristofano et al. 1995; Abrink et al. 1998). (D, bottom) Gels for two “housekeeping” genes selected as positive controls for the cDNA panels. Guide to the tissues included on the gels: (Adi) Adipose tissue; (Adr) Adrenal gland; (Bpl) Blood, peripheral leukocytes; (BoM) Bone marrow; (Br) Brain; (Brcb) Brain (cerebrum); (Bcll) Brain (cerebellum); (Bm) Brain (medulla oblongata); (Hrt) Heart; (Liv) Liver; (Lym) Lymph node; (MG) Mammary gland; (Pan) Pancreas; (Ov) Ovary; (Pla) Placenta; (Pro) Prostate gland; (Spl) Spleen; (SkM) Skeletal muscle; (Tes) Testis; (Thr) Thyroid; (Thm) Thymus; (−C) negative control. The zinc finger RT–PCR reactions were repeated under varying conditions, and the gels shown are for the 33-cycle experiments, which reveal tissues with present but low-abundance ZNF transcripts.

