

Abstract
Torsade de pointes is a potentially lethal arrhythmia that occasionally appears as an adverse effect of pharmacotherapy. Recently-developed understanding of the underlying electrophysiology allows better estimation of the drug-induced risks, and explains the failures of older approaches through the surface electrocardiogram.
The article expresses a consensus reached by an independent academic task force on the physiologic understanding of drug-induced repolarisation changes, on their preclinical and clinical evaluation, and on the risk-benefit interpretation of drug-induced torsade de pointes.
The consensus of the task force includes suggestions on how to evaluate the risk of torsade within drug development program. Individual sections of the text discuss the techniques and limitations of methods directed at drug-related ion-channel phenomena, investigations aimed at action potentials changes, preclinical studies of phenomena seen only in the whole (or nearly whole) heart, and at interpretation of human electrocardiograms obtained in clinical studies. Final section of the text discusses drug-induced torsade within the larger evaluation of drug-related risks and benefits.
Keywords: Torsade de Pointes, Drug effects, Long QT Syndrome, Risk assessment, Action Potentials, M cells, Electrocardiogram, QT interval
1 Overview
1.1 Introduction
Torsade de pointes (from the French for “twisting of the points”) is a polymorphic ventricular tachycardia seen in the setting of QT prolongation. The electrocardiographic pattern (Figure 1) is distinctive, sometimes described as a sine wave within a sine wave. The pattern is called “twisting” because when the peaks are at their smallest in one lead, they are generally at their largest in another, as if the several leads were different views of a vibrating string whose plane of vibration was being slowly rotated about the long axis of the string.
Figure 1.

Examples of electrocardiograms of torsade de pointes.The top panel shows an episode of the tachycardia on dofetilide, the bottom panel on sotalol. In the bottom panel, torsade starts as a few beats, followed by a pause, followed more beats of the tachycardia, followed by another pause that leads to a prolonged episode of torsade.
Like some other ventricular tachycardias, torsade is often self-limited, but it can persist, deteriorate to ventricular fibrillation, and thereby lead to sudden death. It is more common in women, in patients with hypokalemia,(1) in patients with certain congenital syndromes mentioned below, and in several other settings. This article describes an approach to torsade as an adverse effect of pharmacotherapy.
Some antiarrhythmics (including dofetilide, quinidine, and sotalol) induce torsade in up to a few percent of all patients who receive them.(2) These drugs are intended to affect the cardiac electrophysiology; hence the frequent unintended occurrence of pro-arrhythmia should not be surprising. For the most part, we focus our discussion on torsade as an adverse effect of drugs other than antiarrhythmics, where electrophysiological effects might be expected to be rare.
Indeed, such effects are rare. Astemizole, cisapride, grepafloxacin, terfenadine, and terodiline were each withdrawn from marketing in all or some countries because of drug-induced torsade, but the total number of attributable cases of torsade with each of these drugs was no more than a few dozen, out of millions or tens of millions of patients exposed. Less publicly, real or perceived risks of torsade have caused other drug-development programs to be aborted or greatly delayed. Could these losses (of a few lives and several billion dollars) have been averted?
1.2 Monitoring for torsade
Since torsade is the phenomenon of concern, one might hope to screen drugs by simply being alert for the occurrence of torsade during the human trials in drug-development. However, because torsade is usually so rare (with non-antiarrhythmics, less than one case per 10 000 or 100 000 exposures(2)), little reassurance is provided by the non-observation of torsade among the 2000–3000 subjects in a typical program, let alone the 1500 subjects recommended in guidelines of the International Conference on Harmonisation.
Even after marketing, when the rate of exposure is greatly increased, the lack of controls and reduction in intensity of monitoring may make torsade difficult to detect. Syncope and sudden death may be observed, but it may be difficult to determine that these events are increased in frequency over the background incidence in the population receiving a drug. When an event occurs in a patient taking multiple drugs, it may be difficult to choose which of them to hold responsible.
Torsade is hardly unique in being an adverse drug effect of great concern even though its incidence is low. Chloramphenicol-induced aplastic anemia, hydrochlorothiazide-induced pancreatitis, and angiotensin-receptor-blocker-induced eosinophilic nephritis are similarly rare. A distinguishing characteristic of torsade is that its mechanism has been at least partially understood, so it is tempting to focus upon early manifestations of the mechanism, and to use these manifestations as predictors of torsade, overcoming the rarity of the clinical arrhythmia. Some predictors might be usable in earlier stages of drug development, both reducing the risk to human subjects and allowing development funds to be shifted to other candidate pharmaceuticals.
1.3 Working with the human QT interval
Inasmuch as torsade is (by definition) always preceded by QT prolongation, QT measurement is an obvious candidate as a predictor. The QT duration can be measured in most subjects, so such measurement might be more efficient than waiting for rare events.
As further described in Section 5 below, however, useful QT measurements are more difficult to obtain than is generally acknowledged. Even after precise measurement and careful adjustment for physiological co-factors, interpretation may be difficult. For example, some drugs can cause substantial prolongation of the QT interval but have rarely (amiodarone(3–5)) or never (pentobarbital, (6;7) verapamil) been associated with torsade or other malignant tachyarrhythmias. Also, modern techniques have revealed that small drug-induced QT prolongations are ubiquitous, but there is no known example of torsade induction by a drug that causes only small QT changes (despite overdose or metabolic interference).
1.4 Biological model
If torsade de pointes is too rare to be awaited, and if QT prolongation in human subjects is only a mediocre predictor, then decision-making must be based (at least in part) on other observations. These other observations can be credibly pertinent only in the light of an accepted biological model of how torsade de pointes arises. Parts of our current model can be called classical, but other parts reflect results that have been obtained only recently.
1.4.1 In vitro assessment of drug effect on cardiac ion channels
All the electrical activity of the heart starts in voltage-gated ion channels. Ion flux through these channels causes a cell’s transmembrane voltage to vary over time, and the functions of channels can be altered by the presence of drugs. Drugs’ interactions with ion channels can be studied by a variety of techniques described below in Section 2. Interference with the normal function of certain of the ion channels is necessary, but not sufficient, for the induction of torsade.
1.4.2 Action potentials
A voltage-gated ion channel is normally open only within a set range of transmembrane voltage, and the charges carried by ions moving through the channel cause the cell transmembrane voltage to change. As a result, opening any channel begins a process that will inevitably lead to its closing and to the opening and/or closing of other channels as well, so the cell enters a stereotyped sequence in which the intracellular voltage rises from its resting level (the cell depolarizes) and then returns to the resting level (the cell repolarizes). Each such excursion is called an action potential.
The surface electrocardiogram sums the action potentials of all of the cells of the heart. Conduction delays between parts of the myocardium might in principle allow normal action potentials starting at different times to sum to an electrocardiogram in which repolarization – the QT interval –appeared to be prolonged, but this phenomenon does not occur in electrocardiograms considered to have interpretable QT intervals. In interpretable electrocardiograms, QT prolongation is a manifestation of action potentials that are themselves prolonged, in at least some region of the ventricular myocardium. Prolongation of action potentials is necessary, but not sufficient, for the induction of torsade. The techniques and limitations of action-potential studies are further discussed in Section 3 below.
1.4.3 Transmural dispersion of repolarization
The action potentials of uninjured adjacent cells of the same kind are likely to have the same form and duration. On the other hand, cells of different kinds express different mixtures of ion channels and thus display different resulting action potentials, in the native state or as affected by drugs. In particular, every cross-section of the normal myocardium in some species (including humans) contains at least three different populations of cells, with different native electrophysiological properties and different responses to drugs. When adjacent cells’ action potentials are more than slightly different in duration, the scene is set for reentrant arrhythmias, notably torsade.
Torsade can be reproduced in whole animals, in isolated-heart preparations, and even in preparations that use only a portion of a ventricle. These techniques are described in Section 4 below.
1.5 Structure of the article
As noted variously above, the next few sections of the article discuss the techniques and limitations of methods directed at ion-channel phenomena (Section 2), at action potentials (Section 3), at phenomena seen only in the whole (or nearly whole) heart (Section 4), and at interpretation of human electrocardiograms (Section 5). In Section 6, we discuss the place of drug-induced torsade within the larger evaluation of drug-related risks and benefits.
2 Ion-channel effects
Ion-channel studies are the lowest-level studies that are pertinent to the prediction of torsade de pointes, and they are attractive for their simplicity. Some ion-channel studies can be performed by automated, high-throughput apparatus, using only microgram quantities of drug. These relatively inexpensive studies can be performed early in the drug-development process, perhaps helping the developer choose among a portfolio of candidate compounds.
Twenty-odd different types of ion channels have been found in the human heart, but nearly all the drugs associated with human torsade have – whatever their effects on other currents – turned out to be blockers of IKr, the (repolarizing) rapid delayed-rectifier potassium current. Three other currents (the depolarizing currents ICaL and INa and the repolarizing current IKs) are commonly studied, and have been shown to contribute to the QT-prolonging effects of many drugs and toxins. INa and IKs are also of interest because of their demonstrated role in the congenital long-QT syndromes.
2.1 Implications of findings in patients with congenital LQT syndromes
Much of our current thinking about drug-induced ion-channel effects in humans has been influenced by our knowledge of the congenital long-QT syndromes.(8) Patients with these syndromes are at risk of torsade and sudden death, with about half of them sustaining major arrhythmic events before the age of 40. These patients are thus at high risk by the standards of everyday life, but their event-free longevity is measured in decades. It should no longer be surprising that torsade is rarely seen in a clinical trial of typical duration, even when the trial exposes subjects to a drug that effectively simulates one or another of the congenital syndromes.
Although many different types of human ion channels have been identified, only four currents (the depolarizing current INa and the repolarizing currents IKr, IKs, and IK1) are affected in any of the common congenital syndromes. (Mutations in a non-ion channel encoding gene, Ankyrin B, cause a long-QT syndrome through mechanisms that are not yet well understood.(9))
Each of the congenital syndromes is caused by dysfunction of the product of a specific gene, and thus a specific channel. For example, the LQT2 syndrome is caused by dysfunction of the HERG protein that, assembled into a homotetramer of 4 identical HERG units, forms the IKr channel. The congenital long-QT syndromes are in this way simpler than many drug-induced syndromes, inasmuch as many drugs have effects on multiple channels.
Each of the congenital syndromes is heterogeneous, however, in ways that have no direct analogs among the drug-induced syndromes. Two patients with the same congenital LQT syndrome are unlikely to have the same mutation. As of mid-2003, the seven congenital syndromes were known to arise from more than 300 different mutations.(10)
Also, the simple monogenetic inheritance of the mutations is not reflected in simple Mendelian inheritance of the phenotypic manifestations. In a family carrying a known LQT mutation, the carriers will typically have QT intervals ranging from normal (in about a third of carriers) to grossly prolonged. The frequency of arrhythmic events is elevated in mutation carriers, even in those with normal QT intervals. It increases with increasing QT interval in some syndromes, but not in others.(11–13)
The mutations associated (in at least some patients) with frank QT prolongation and spontaneous arrhythmias are not the only important genetic defects in human genes related to ion channels. Mutations (present in < 1% of the population) and polymorphisms (present in ≥ 1% of the population) of these genes are widespread, especially in certain subgroups. Some of these gene variants may be clinically silent until the patient is exposed to a drug that, in a person with a normal genotype, would have no pro-arrhythmic effect. Splawski et al.,(14) for example, found a specific ion-channel polymorphism present in 13 (57%) of 23 African-American patients who had sustained arrhythmias (many drug-induced), but in only 13% of 100 race-matched controls (P < 0.000 028).(14) Similarly, among 98 unselected patients who had had drug-induced torsade, Sesti et al.(15) found that 3 had subclinical mutations of KCNE2, the gene that is implicated in congenital syndrome LQT1. Some of the mutations and polymorphisms that have been implicated in these and similar cases are listed in Table 1.
Table 1.
The table lists mutations (in boldface), polymorphisms, and drug-induced torsade.
| Gene | Coding effect (reference) | Drug | Remarks |
|---|---|---|---|
| KCNE2 | T8A(20) | Quinidine | allele frequency 1.6% |
| KCNE2 | T8A(15) | sulfamethoxazole/trimethoprim | allele frequency 1.6% |
| KCNE2 | Q9E(20) | Clarithromycin | |
| KCNE2 | M54T(15) | Procainamide | |
| KCNE2 | I57T(15) | Oxatomide | |
| KCNE2 | A116V(15) | Quinidine | |
| KCNH2 | P486R(121) | Quinidine | |
| KCNH2 | R784W(122) | Amiodarone | |
| KCNQ1 | Y315C(123) | Cisapride | |
| KCNQ1 | R555C(124) | terfenadine (1)
disopyramide (1) mefloquine (1) diuretics (1) |
3 families, 5 events |
| KCNQ1 | R583C(122) | dofetilide | |
| SCN5A | G615E(122) | quinidine | |
| SCN5A | L618F(122) | quinidine | |
| SCN5A | S1102Y(14) | various drugs | allele frequency among African- Americans 13% |
| SCN5A | F1250L(122) | sotalol | |
| SCN5A | V1667I(125) | halofantrine | 4 carriers with QT prolongation- one symptomatic with drug |
| SCN5A | L1825P(126) | cisapride |
2.2 Technique
Drug-channel interactions, like other drug-receptor interactions, follow the familiar rules of mass action, so a drug’s effect on a channel becomes detectable, increases, and finally reaches saturation as drug concentrations increase over (typically) 2–4 orders of magnitude. For convenience, the potency of an interaction is commonly communicated by citing the IC50, which is the drug concentration at which the current magnitude is halved.
No method of evaluating drug-channel interactions could be cheaper, or require smaller quantities of the drug, than one performed computationally. In the case of the IKr channel, some investigators have identified common 3-dimensional features of known channel-blocking drugs and have used these features to “train” a model that was then tested on other compounds.(16;17) By comparing mutant and wild-type channel proteins, other investigators have identified the binding sites of known channel blockers, and they have then modeled possible interactions between other drugs and these sensitive sites on the channel protein.(18) These in silico models are promising, but they cannot yet replace studies of living cells.
2.2.1 Voltage-clamp techniques
2.2.1.1 Preparations
Until recently, most ion-channel studies have been performed using isolated single cells, usually cardiac myocytes, in which the channel of interest was naturally present. The use of cardiac myocytes guarantees that any as-yet-undefined auxiliary subunits or intracellular factors that may modulate channel activity are intact. On the other hand, the use of isolated myocytes poses technical difficulties, including the need to isolate fresh myocytes on each experimental day and possible overlap of the current of interest with other ionic currents.
IKr is the current most frequently studied. IKr can be measured in isolated ventricular myocytes from a number of species, and guinea pig, rabbit, and dog are the most commonly used. Rats and mice have a very small IKr and are not appropriate species for this purpose. Recording IKr from isolated myocytes requires that other currents that are normally activated over a similar voltage range be eliminated with specific blockers or reduced by special voltage-clamp protocols. For example, Ca++ currents can be eliminated by dihydropyridines, and Na+ current can be blocked by tetrodotoxin or eliminated by holding the membrane at a voltage level at which Na+ channels are inactivated. IKr can be measured as activating current during a depolarizing pulse, or as deactivating tail currents during repolarization from a positive test potential.
Instead of using myocytes from one or another non-human species, many investigators have more recently used non-cardiac mammalian cells that have been made to express human ion channels by transfection with human DNA. The cells can be chosen for their ease of maintenance in culture and ease of high-resistance-seal formation with microelectrodes; this approach also eliminates the complexities of interference from currents other than the one of interest, although ancillary proteins –whose expression may vary among cell types – have been reported to affect the potency or kinetics of IKr block.(15,19) The most frequently used cells have been human embryonic kidney cells and Chinese-hamster ovarian cells. For study of IKr, most investigators transfect with HERG cDNA alone, but others co-transfect with cDNA encoding MiRP1, a putative accessory protein of the IKr channel.(20,21)
Instead of using mammalian cells, some investigators have undertaken drug-effect studies on Xenopus oocytes injected with HERG cDNA. The drug concentrations needed to achieve channel-blocking effects in these cells are typically about an order of magnitude greater than those needed in other preparations, so it is difficult to integrate results obtained in Xenopus oocytes with the results of other studies.
Automated patch-clamp techniques that enable simultaneous electrical recording from multiple single cells at once are still in the development and testing stage, but some are expected to be commercially available in early 2004. Combinations of newly-developed electrode arrays, automated perfusion systems, and novel data analyses promise to enable high-throughput screening. The availability of these methods may greatly increase the number of compounds that can be evaluated by voltage clamp, but their anticipated high cost will (at least initially) be a barrier to widespread use.
2.2.1.2 Measurement
Over the course of each experiment, the cells of the preparation lose their viability, and all of the current amplitudes gradually decline. These declines are annoying at best, but they become critical during the study of drugs that penetrate cells slowly and exert their effects – as most HERG blockers are believed to do – on the intracellular side of the affected channel(s). To decrease the rates of these declines, most investigators prefer to work with the preparation at room temperature. An IC50 derived at room temperature may differ from that derived at physiological temperature by almost an order of magnitude, but similar differences are sometimes seen at the same temperature in different preparations, or in the same preparation in the hands of different investigators.(22)
Many drugs block channels in a frequency-dependent manner, which may translate into a heart-rate-dependent change in QT interval. Thus, it is useful to determine if channel block varies with pulsing frequency (e.g., 0.1 vs. 2 Hz).
The concentration-effect relationship of a drug and an ion channel is estimated by gradually increasing the drug concentration, generally escalating in half-log increments from an approximate no-effect level until at least 80% block is attained. The preparation can be calibrated by including a potent, specific blocker (e.g., in the case of IKr, dofetilide or E-4031) in the same study. The relationship between drug concentration and percentage of current blocked can be fitted to a Hill equation to determine IC50.
2.2.2 Other techniques
Radioligand binding assays are routinely used to quantify the interaction of new drugs with some channels (e.g., with L-type Ca++ channels), but they are less widely used to assay for blockade of IKr. However, competitive displacement of 3H-dofetilide or similar compounds from membranes of cells transfected with HERG cDNA appears to be a robust assay.(23) A disadvantage of radioligand displacement assays is that they may not detect a signal for drugs that bind to domains of HERG distinct from the site used by the radioligand. Also, there is concern that in some cells 3H-dofetilide may bind to sites other than the HERG channel.(24)
Potassium channels are also highly permeable to rubidium, so measurements of drug effects on the flow of nonradioactive Rb+ (using atomic absorption spectroscopy) or of radioactive 86Rb+ (using standard tracer techniques) have been used as assays of drug effects on these channels.(25) Suppression of Rb+ flux is more predictive of genuine HERG channel block than fluorescent-dye-based assays,(26) but neither technique is sensitive, and probably neither should be used if quantitative results are desired.
2.3 Interpretation
Of the three most common congenital long-QT syndromes, only one (LQT2) is the result of dysfunction of IKr. In animals, LQT1 can be simulated by blockade of IKs, and LQT3 can be simulated by administering reagents that prevent normal termination of INa. Sooner or later, a drug intended for human pharmacotherapy will prove to cause torsade even though it has no effect on IKr.
On the other hand, the prominence of IKr blockade in the drug-induced human syndromes is probably not a chance finding. The IKr channel is distinguished from other potassium channels by a large, funnel-like vestibule, and (probably more important) by the prominence of aromatic amino acids along its central channel. These features may make it easier for many small molecules to enter and sometimes to block the passage of ions.(18) Whatever the underlying biochemical reason turns out to be, the current emphasis on IKr vis-à-vis other currents does not seem inappropriate.
Not many human drugs have IC50 for IKr blockade < 10 nM; every such drug (e.g., astemizole, IC50 = 0.9 nM;(27) terodiline, 3.7 nM (Yang and Roden, unpublished observations); dofetilide, 3.9 nM;(28) cisapride, 6.5 nM(29)) seems to have turned out to cause torsade. At the other extreme, torsade has been reported with d-sotalol (100 μM(30)), although not with cetirizine, 108 μM (31) or ciprofloxacin, 966 μM(32).
In the much more densely populated middle ground, the degree of IKr blockade has proven to be an imperfect predictor, failing to distinguish verapamil (IC50 = 143 nM(33)) and loratadine (173 nM(34)) from terfenadine (150 nM(35)) and quinidine (0.2–1.0 μM at normal potassium levels(1;35)). Evidently, some of the mechanisms leading to torsade emerge only at higher levels of organization.
Verapamil, for example, is a moderately potent IKr blocker (IC50 = 143 nM),(33) and thus might be expected at ordinary concentrations to prolong repolarization, perhaps a first step toward induction of torsade. In fact, because verapamil blocks L-type Ca++ channels with similar potency,(36) the usual effect of verapamil is to shorten repolarization, and verapamil has never been associated with tachyarrhythmias.
3 Action-potential studies
Figure 2 shows the relation between the action potential in three different (simulated) canine ventricular myocytes, with parallel displays of the calculated currents through the most important of the contributing ion channels, where Ito is the transient outward K+ current; ICaL is the L-type Ca++ current; INa is the sodium current (the early sodium current is not seen in the figure because its initial peak is so much larger [typically 200 pA/pF] than any of the other peaks shown); INaCa is the Na+-Ca++ exchange current; IKr is the rapid delayed-rectifier K+ current; IKs is the slow delayed-rectifier K+ current; ICl(Ca) is a transient outward Cl− current, activated by intracellular Ca++; IK1 is the inward rectifier K+ current; and INaK is the sodium-potassium exchange (the “sodium pump”).
Figure 2.
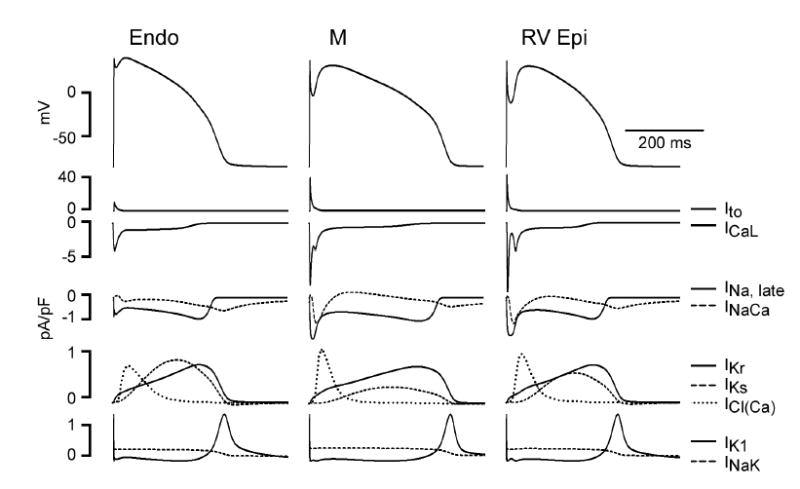
Electrical heterogeneity in the canine ventricle: The figure shows computer simulations of the three predominant ventricular cell type: epicardial, M, and endocardial cells. The action-potential distinctions are based on differences in ion-channel activity recorded from the three cell types in voltage-clamp experiments conducted in enzymatically-dissociated canine ventricular myocytes: Ito = transient outward K+ current; ICa,L = L-type Ca2+ current; Late INa = late sodium channel current; INa-Ca = sodium-calcium exchange current; IKr = rapidly-activating delayed-rectifier K+ current; IKs = slowly-activating delayed-rectifier K+ current; ICl(Ca) = calcium-activated Cl− current; IK1 = inward rectifier K+ current; INa-K = electrogenic sodium-potassium exchange (“sodium pump”) current. (Nesterenko and Antzelevitch, unpublished observation).
It may not be meaningful to ask, without specifying the tissue to be studied, what effect a drug has on “the” action potential. For example, the deep notch that immediately follows the initial peak of the epicardial action potential (rightmost column) in Figure 2 is the result of the strong Ito shown just below. In the endocardial action potential (leftmost column), only a tiny notch is seen, because Ito is scarcely present in these cells. A drug that blocked Ito might therefore be expected to affect the epicardium by making its action potential resemble that of the endocardium; the same drug might be expected to have little or no effect on the electrical properties of the endocardium.
The most frequent drug-induced changes in action potentials are not major morphological changes of the sort just described. Sometimes, the action potential can be shortened by drugs that block depolarizing currents or prevent the normal closure of repolarizing channels. Conversely, the action potential is more or less prolonged when a drug blocks repolarizing channels or defers closure of depolarizing Na+ or Ca++ channels. When the prolongation lasts long enough (perhaps because some Ca++ channels recover their ability to open during the long repolarization), repolarization can be interrupted by an afterdepolarization, as seen in Figure 3.
Figure 3.
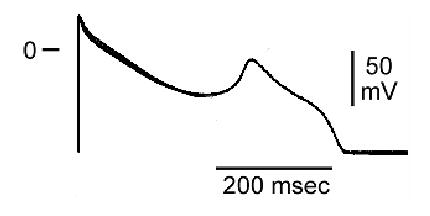
Sotalol-induced early afterdepolarization in an action potential recorded from a guinea-pig M cell preparation.
3.1 Technique
3.1.1 Action-potential recording techniques
3.1.1.1 Preparations
The preparation most commonly used for action-potential studies is the isolated dog Purkinje fiber, but single ventricular myocytes isolated from guinea pig, rabbit, or dog are also frequently used, and some investigators have used isolated papillary muscles or ventricular strips. Some findings in cardiac tissues from rats and mice have been provocative,(37) but because the dominant ion channel in these tissues is Ito, they are not frequently used during human drug development.
Purkinje fibers are attractive because they tend to be more sensitive to action-potential-prolonging drugs, and because stable microelectrode impalements are relatively easy to maintain in them. On the other hand, Purkinje fibers often fail to respond to blockers of IKs, so some drugs’ effects may be underestimated. (38,39)
3.1.1.2 Measurement
As noted above in Section 2.1, a drug that affects any of the ion channels is likely to affect others too. Quinidine, for example, blocks Ito, IKr, IK1, IKs, INa, and ICa-L. As the concentration of quinidine is increased, the net effect on the action potential varies in a complex fashion, as one ion-channel effect and then another goes through its concentration-effect range. To characterize the effects of a drug on action potentials, it is thus important to use several concentrations of the drug, usually escalated in half-log increments over at range covering at least two orders of magnitude.
The rate of stimulation is another important variable. For example, most IKr blockers prolong action potentials more effectively at slow than at fast rates of stimulation, while many ICa-L blockers are more effective at fast rates than at slow rates. These effects may reflect rate-dependent drug-channel interactions, or intrinsic differences in the behavior of these and other ion channels (e.g., IKs) during an action potential.
Changes in action-potential duration are usually quantified by measuring the time required for the repolarization process to reach 50% (APD50) or 90% (APD90) completion.
3.1.2 Other techniques
A simpler and higher-throughput approach is to determine the effect of compounds on the effective refractory period (ERP) of isolated papillary muscles, using paired-pulse electrical stimulation and using contractile activity as a signal.(40) One disadvantage with this method is that some INa blockers induce post-repolarization refractoriness (that is, they cause the ERP to last much longer than the action potential), and thus they produce a false-positive response.
3.2 Interpretation
From the timing and magnitude of the currents shown in Figure 2, many drugs effects on action potentials can be roughly predicted. Na+ channel blockers will reduce the maximum upstroke velocity of the action potential; Ito blockers, as noted above, will generally abolish an early notch, if one is present; Ca++ channel blockers will shorten APD50; IKr and IKs blockers will prolong APD50 and APD90 with little change in the rate of terminal repolarization; and IK1 blockers will reduce the resting potential, prolong APD90, and slow the rate of terminal repolarization.
The value of action-potential studies comes not from these single-channel phenomena, but rather from emergent phenomena that reveal the interaction of multiple channels. In particular, early afterdepolarizations seen in action-potential studies tend to be associated with proarrhythmia later on.(41) Action-potential prolongation by itself is somewhat worrisome, but several drugs (e.g., pentobarbital(6)) cause action-potential prolongation and yet are anti-arrhythmic.(6,7,42) Plainly, the mechanism of torsade does not fully emerge until an even higher level of integration than the action potential.
4 Whole-heart and related studies
When electrically-excitable tissues with different repolarization characteristics are juxtaposed, the scene is set for re-entrant arrhythmias. Clinicians are familiar with this notion from infarction models and other studies. In the last several years, it has become apparent that a similar mechanism is responsible for torsade de pointes.
The pivotal discovery was the finding that the cells of the ventricular myocardium are heterogeneous.(43,44) In every species tested, including dogs, rabbits, guinea pigs, pigs, and humans, the myocardium has been found to include three different tissues, roughly(45) layered with the endocardium, a middle region (the M cells), and the epicardium.(46) The three layers are histologically indistinguishable, but electrophysiologically distinct, as seen in Figure 2. Among many other differences,
the repolarizing current IKs is important in the epicardium and endocardium, but much less so in the M cells; and
once depolarization is well under way, the depolarizing current INa tapers off rapidly in epicardium and endocardium, but it lingers, opposing the repolarization currents, in M cells.
With protracted influx of Na+ and reduced opposing K+ efflux via IKs, the action potentials of M cells are normally somewhat longer than those of the epicardium and endocardium, as shown on the left side of Figure 4. The voltage gradients between the M cells and the others appear, at least in the wedge model (see Section 4.1.3 below), as the T wave on the electrocardiogram.
Figure 4.

Transmembrane potentials and a transmural ECG recorded from an arterially-perfused canine left ventricular wedge preparation. Action potentials from epicardial (Epi), M, and endocardial (Endo) sites were simultaneously recorded using floating glass microelectrodes, together with a transmural ECG. Repolarization of epicardium is coincident with the peak of the T wave of the ECG, whereas repolarization of the M cells coincides with the end of the T wave. Opposing voltage gradients on either side of the M-cell region are responsible for the inscription of the T wave. Reproduced from (135), with permission.
The transmural differences in action-potential duration are normally no more than a few milliseconds, but drug effects can change the picture. With relatively low IKs activity, the repolarization of M cells is critically dependent on IKr. When IKr is blocked, repolarization is delayed everywhere, but (as shown on the right side of Figure 4, where IKr-blocking concentrations of dl-sotalol were used) much more in the M cells than in those of the epicardium or endocardium. As a result, not only is the QT interval prolonged, but the transmural dispersion of repolarization (TDR) is prolonged to an even greater degree.
Moreover, the effect upon TDR turns out to be the more important one. For example, pentobarbital is an IKr blocker, but it is a much more potent blocker of IKs and of the late portion of INa. As a result (as shown in Figure 5), administration of pentobarbital causes the QT interval to be prolonged (last row of the Figure), but with the action potentials of the epicardium and endocardium prolonged more than that of the M cells (first three rows of the Figure). As a result, TDR (measurements at the bottom of Figure 5) actually decreases. The reduction in TDR explains the paradoxical-seeming observation that despite its effect on the QT interval, pentobarbital is antiarrhythmic in familiar animal models,(6) and it suppresses sotalol-induced early afterdepolarizations.(7) Similar results are obtained with amiodarone,(47) ranolazine,(48) and the experimental agent chromanol 293B.(49) In modeling torsade de pointes, there seems to be benefit in models that contain more than a few homogeneous ventricular myocytes.
Figure 5.
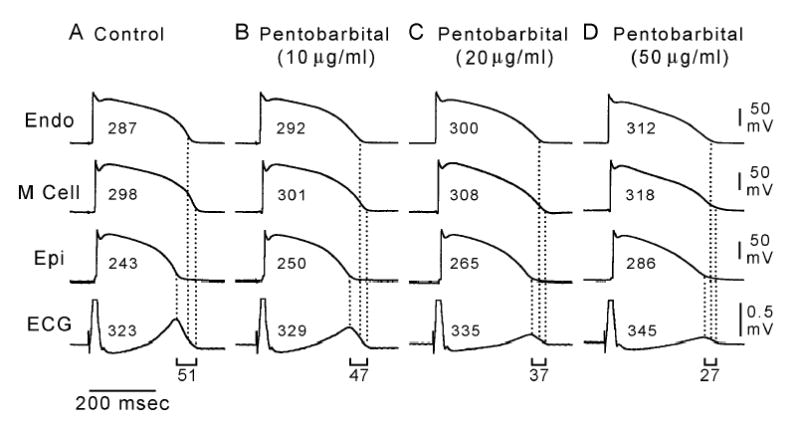
Dose-dependent effect of sodium pentobarbital (10, 20, 50 μg/ml) on transmembrane and ECG activity in an arterially-perfused canine left ventricular wedge preparation. All traces depict action potentials simultaneously recorded from endocardial (Endo), M, and epicardial (Epi) sites together with a transmural ECG. BCL = 2000 msec. Pentobarbital produced a dose-dependent prolongation of the QT interval and APD of all three cell types, but it prolonged the APD of the endocardial and epicardial cells more than that of the M cells, thus reducing transmural dispersion of repolarization (and flattening the T wave) in a dose-dependent manner. Numbers associated with each action potential indicate the APD90 value. Numbers associated with the ECG denote the QT interval, and those beneath the ECG represent the transmural dispersion of repolarization. Reproduced from (6), with permission.
4.1 Technique
4.1.1 Whole animals
One obvious way to obtain a preparation that contains all of the pertinent tissues is to use a whole animal. This sounds straightforward, but naïve implementation gives rise to the same problems that are found in human studies: Torsade is rare, and lesser electrocardiographic changes are of uncertain predictive value. In particular, variations of animals’ QT intervals with heart rate, autonomic influences, and so on (see Section 5.1.6) are as complex as those seen in humans, with a smaller body of pertinent data to guide the investigator.
To get away from the difficulties of deriving predictions from QT changes, several groups of investigators have developed models in which animals are pre-treated so as to make them more likely to develop frank torsade. Then, drugs are tested by seeing whether they induce torsade, or whether they enhance or reduce other drugs’ tendency to do so.
As with any whole-animal studies, these investigations of a drug will be credibly predictive only to the extent that the human and animal metabolism of the drug are appropriately similar. An effect seen in one species might be absent in another, if the culprit substance were a metabolite not produced in the second species.
4.1.1.1 Methoxamine-treated rabbits
In a model initially developed by Carlsson et al.,(50) α-chloralose-anesthetized rabbits are pretreated with methoxamine, an alpha1 agonist. These animals then have greatly increased sensitivity to the repolarization-altering effects of some drugs, especially those that are relatively pure IKr blockers (dofetilide, sotalol, etc.). As the dose of one of these drugs is increased, the rabbits predictably exhibit marked QT prolongation, large U waves, epicardial early afterdepolarizations, and finally polymorphic ventricular tachycardia.
Most of the reported experience with the rabbit model has come from studies of the IKr blockers, characterizing their proarrhythmic properties and investigating methods for terminating drug-induced arrhythmias. Experience with drugs of other kinds has been limited. When methoxamine-treated rabbits were exposed to increasing concentrations of terfenadine and quinidine, polymorphic ventricular tachycardias were not induced.(51) The quinidine effect likely reflects the drug’s alpha-blocking properties, inhibiting methoxamine actions in this model, but the general sensitivity and specificity of the rabbit model remain unsettled.
4.1.1.2 AV-blocked dogs
Dogs used in this model undergo ablation of the atrioventricular node, either by injection of formaldehyde via thoracotomy or by application of radio-frequency energy(52) via a catheter. Pacing electrodes are placed, and the dogs are then followed for 2–4 months to allow for bradycardia-induced ventricular remodeling.(53). In one version of this model, the dogs’ susceptibility to torsade de pointes is further increased by using furosemide to induce hypokalemia.(54)
Studies using this model are generally conducted on conscious, quietly restrained animals, so all routes of drug administration are possible. Cross-over studies after appropriate washout are also possible with this model. The total reported experience is not large, but (as shown in Table 2) drugs known to produce (or not to produce) torsade in humans have generally produced (or not produced) torsade in A-V blocked dogs. Quinidine has been a borderline exception; sotalol induced torsade in five of six dogs studied by Weissenburger,(55) but quinidine, in the same animals, induced only various less distinctive ventricular tachyarrhythmias.
Table 2.
Selected results from published studies initiating torsade in a model of AV-blocked dogs.
| drug (reference) | N | incidence of torsade |
|---|---|---|
| almokalant (127) | 14 | 64% |
| amiodarone (5) | 7 | 0 |
| azimilide (128) | 9 | 56% |
| dofetilide (128) | 9 | 67% |
| dronedarone (5) | 8 | 38% |
| d-sotalol (129) | 20 | 5% |
| d-sotalol (127) | 14 | 0% |
| ibutilide* | 12 | 67% |
- Cantilena, unpublished observation.
4.1.2 Isolated perfused hearts
Arrhythmogenesis has also been studied in the whole, isolated, perfused hearts of rabbits(56–59) and guinea pigs.(60) The sensitivity and specificity of these models are uncertain, and they provide no information as to potential arrhythmogenic mechanisms. These models have been substantially superseded, in our view, by the wedge model described in the next section.
4.1.3 The wedge preparation
Because the principal substrate for the development of torsade is thought to be due to amplification of transmural dispersion of repolarization, a thick transmural segment of myocardium provides a minimally complete model in which to study the genesis of the arrhythmia. Antzelevitch and colleagues have demonstrated that a full-thickness slab of ventricular wall (a “wedge”) can indeed be isolated and studied, providing insight into torsade and a variety of related electrophysiological phenomena.
As shown in Figure 6, the wedge preparation is a few square centimeters of full-thickness ventricular wall. The specimen is immersed in a physiological bath, and it is also perfused through its native vessels. Electrodes in the bath at some distance from the endocardial and epicardial surfaces record a pseudo-electrocardiogram, while floating glass microelectrodes record simultaneous action potentials in each layer of tissue from the transmural surface.
Figure 6.

Schematic of arterially-perfused canine left ventricular wedge preparation. Reproduced from (136), with permission
By providing results like those shown in Figure 4 and Figure 5, the wedge preparation has been pivotal in providing our current understanding of torsadogenesis. As shown in Table 3, TDR is much better correlated with human torsade than the length of the QT interval. In particular, compounds that have been shown to increase TDR have all turned out to cause torsade in humans, and of all of the compounds that have been shown not to increase TDR, amiodarone is the only one that has ever been convincingly (albeit rarely) associated with human torsade.
Table 3.
Transmural dispersion of repolarization as a predictor of human torsade de pointes
| canine LV tissue studied | effect in canine LV | effect in humans | ||||||
|---|---|---|---|---|---|---|---|---|
| drug | M* | Epi* | PF* | wedge | EADs | ⇑TDR | torsade | ⇑QT |
| amiodarone | √ | √ | − | − | ± | + | ||
| Azimilide | √ | √ | + | + | + | + | ||
| Cisapride | √ | √ | √ | √ | + | + | + | + |
| Erythromycin | √ | √ | √ | + | + | + | + | |
| ⇓IKs* with βstim* | √ | √ | √ | √ | − | + | + | + |
| ⇓IKs* with βblock* | √ | √ | √ | √ | − | − | − | + |
| Pentobarbital | √ | √ | √ | − | − | − | + | |
| quinidine, low conc | √ | √ | √ | + | + | + | + | |
| quinidine, high conc | √ | √ | √ | − | − | − | + | |
| Sotalol | √ | √ | √ | √ | + | + | + | + |
| Terfenadine | √ | √ | √ | + | + | + | + | |
| Verapamil | √ | √ | √ | √ | − | − | − | ± |
Epi = epicardial cells; ⇓IKs = LQT1 (IKs defect) in humans, drug-induced IKs blockade in dogs; βblock = beta-adrenergic blockade; βstim = beta-adrenergic stimulation; M = M cells; PF = Purkinje fibers
A limitation of the wedge preparation is that it is technically demanding, but some of Antzelevitch’s former co-workers and other investigators have now begun to replicate it in other laboratories (61–63). The level of transmural dispersion of repolarization needed to precipitate torsade in the wedge often requires long pauses or slow rates, hypokalemia, or epicardial activation, conditions similar to those that predispose to torsade in the clinic. Confirming the findings of the wedge model, the ability of a drug to significantly amplify transmural dispersion can be delineated via studies of the individual layers, that is in tissue slices isolated from the epicardial and M regions of the ventricular wall.
4.1.4 In silico techniques
Computer simulations of the myocardium(64) and of the whole human heart(65) have reproduced the electrophysiological effects of drugs, ischemia, and other conditions. These simulations have required massive computational resources, but such resources are increasingly available. Simulations are not yet familiar enough to be fully trusted, but a growing number of developers are using them to suggest prioritization of more traditional investigations.
4.2 Interpretation
The physiological completeness of the models described in this section is sufficient for the appearance of torsade de pointes, strictly resembling the human arrhythmia. These models are –notwithstanding imperfect sensitivity and specificity – better predictors of human torsade than any other studies known, including (as suggested in Table 3) measurement of QT intervals in human electrocardiograms.
5 Electrocardiography
Adequate pre-clinical screening by the methods described above may be able to keep most drugs likely to induce torsade from ever being tested in clinical trials. Even so, and despite the imperfection of QT measurement as a predictor of pro-arrhythmia, early drug trials must include some evaluation of the effect of a new drug on the human QT interval.
5.1 Technique
5.1.1 QT intervals that should not be measured
Some electrocardiograms are technically defective (with muscle artifact, misplaced leads, or other problems), and one should not attempt to derive useful data from them. This is an old and well-understood problem, although it is one that investigators in pharmaceutical studies are still occasionally pressured to ignore.
5.1.1.1 Hysteresis
The importance of hysteresis was recognized much more recently. As will be discussed in Section 5.1.6.2.1 below, the interpretation of measured QT intervals must take the concurrent heart rate into account. When the heart rate changes, the QT interval also changes, but it is now known that the QT interval takes a minute or two to reach a new steady state.(66) When the QT interval is measured during or just after a change in heart rate, the heart rate to use in the analysis of that QT interval is not defined. (Figure 7)
Figure 7.

Example of QT/RR hysteresis. The top part of the figure shows leads V4 and V6 of a 10-second electrocardiogram recorded while heart rate was decelerating (consecutive RR intervals of 768, 764, 858, 982, 984, 904, 1144, 1120, and 1056 ms). The bottom part of the figure shows superimposition of the QRS-T complexes following the shortest (764 ms) and longest (1144 ms) RR intervals. Despite the marked differences in RR intervals, the QT interval is constant at 376 ms. Data like these demonstrate the inappropriateness of blindly correcting the QT interval on the basis of the immediately preceding RR interval, or of blindly utilizing all collected intervals in an application of the bin method. Using the Bazett correction, QTc in the tracing shown ranges from 352 ms to 430 ms.
When large numbers of electrocardiographic complexes are available (e.g., from a 24-hour Holter recording), failure to take account of hysteresis can result in a biased analysis. If acceleration is more rapidly completed than deceleration, the QT-RR mismatch may be small during and after deceleration, but occasionally large just after acceleration, leading to the false detection of “outlier” values of abnormal prolongation. Adopting a criterion of moderate rigor (say, analyzing only those beats preceded by at least 2 minutes of heart rate stable to ± 3 beats per minute) leaves only a minority of beats in a typical Holter recording available for analysis (Malik, unpublished observations).
Recordings of complexes seen during and just after changes in heart rate should not be discarded, even though methods for their analysis and interpretation have not been developed. In some preclinical models, predictors of arrhythmia are seen only during or just after changes in cycle length.(67) Techniques to derive useful information out of the hysteresis-affected electrocardiographic complexes are not yet available, but this is an area of intense current research. Very recent investigations suggest that the pattern of QT/heart rate adaptation is subject-specific and that protracted adaptation is a risk marker for arrhythmic complications in cardiac patients.(68,69)
5.1.2 Electrocardiographic leads
Some investigators have defined the QT interval as the longest interval measured in any measurable lead, others have used the interval that appeared to be measurable with greatest precision (e.g., the one in which the descending limb of the T wave was steepest), others have adopted a specific lead (usually Lead II) as standard, and still others have utilized a mixed strategy, perhaps using Lead II whenever it is measurable, then using Lead V2 as a second choice, and so on. These various strategies can give radically different results, and the results from some strategies are often unstable. For example, Figure 8 shows the unpredictable differences between QT intervals in Leads II and V2, carefully measured in 10 332 digital electrocardiograms. Careful superimposition of different (up to all 12) digitally and simultaneously recorded leads seems to solve the problem of lead selection and frequently makes the Q wave onset and T wave offset easier to detect.
Figure 8.

Difference between QT interval in lead V2 and lead II as a function of QT interval in lead II, from manual measurements made on computer screen according to previously published technology (76) in 10 332 digital 10-s 12-lead electrocardiograms. The substantial differences are largely caused by isoelectric projection of the terminal part of the T wave in one of the two compared leads.
5.1.3 U waves
The origin of U waves was obscure for many years. U waves had been said to be manifestations of repolarization of the Purkinje fibers, since these fibers are slow to repolarize (consistent with normal U wave timing) and of low mass (consistent with normal U wave diminutive magnitude).(43) On the other hand, it is hard to reconcile this account with the occasional appearance of U waves that are somewhat earlier and much larger. Some authors have included the U wave in their measurements of QT intervals, but others have not.
It now appears that the small U waves and large U waves have different origins. In particular, studies using the wedge preparation have demonstrated that under appropriate conditions (hypokalemia or drug infusion), a large U wave can be repeatably produced during repolarization of isolated ventricular myocardium, and that it is produced by the same mechanisms that produce the T wave.(43)
5.1.4 QT dispersion
As noted in Section 5.1.2, the measured QT interval commonly varies from lead to lead of the electrocardiogram. This circumferential or regional variation has been called QT dispersion; it is different from the radial phenomenon of transmyocardial dispersion discussed in Section 4. QT dispersion is increased in congenital and drug-induced long-QT syndromes and in other conditions associated with increased arrhythmic risk. Various measures of QT dispersion have been proposed as measures of risk, but none has proven to have independent predictive value, and their reproducibility is rather poor.(70) In hindsight, the insensitivity of these measures should have been expected, inasmuch as each of the proposed measures was sensitive to differences in repolarization between regions of ventricular tissue that were physically far separated from each other, and therefore unlikely to join in hosting reentrant arrhythmias.(71)
5.1.5 Measurement per se
In other areas of biology, the notion of the width of a curve peak is usually defined so as to avoid the difficulties that accompany gradual return to a noisy baseline. For example, the width of a chromatographic peak is ascertained by measuring the width of the peak at half of its maximum height. Because the electrocardiographic intervals are traditionally defined to last until the tracing has entirely returned to baseline, there is no possible gold-standard method of measurement. Strategies that improve precision in some situations (e.g., increasing the paper speed or frequency of sampling, which improves precision of measuring the timing of signals that are changing rapidly) can be useless in others (e.g., in measuring the timing of a signal changing very slowly).
Manual readings from paper tracings have a repeatability of about ±25 ms in good hands, but even the best readers demonstrate greater or lesser degrees of digit preference and occasional major errors.(72–74) Using electronic calipers on the computer screen allows for arbitrary rescaling, superimposition of multiple leads or complexes, and other techniques, with a resulting improvement in precision to about ±5 ms. As it happens, the beat-to-beat variation in the QT interval of normal subjects under optimal steady-state conditions is also about ±5 ms (Malik, unpublished observations).
The familiar interval measurements are the easiest measurements for humans to make from paper tracings, but other metrics are under active investigation. Some are more susceptible to precise computerized measurement (e.g., the time from the QRS onset until the point at which 90% of the area under the T-wave curve is past), and others are suggestively linked to the current electrophysiological model (e.g., the time from the peak of the T wave to its end(44;75)). None of these new metrics is yet of proven utility, but the possibility of changes in metric justifies our strong recommendation that electrocardiograms be collected digitally, so that possible future manipulation will not entail reexamination of paper tracings.
Simple automatic measurements of QT interval are provided by most electrocardiographs. However, these are frequently grossly inaccurate (Figure 9) and cannot be recommended for studies of potential drug-induced QT interval prolongation.(76) Contrary to these simple automatic measurements, recent developments in advanced electrocardiographic pattern recognition suggest that a reliable automatic measurement might be available in the near future.
Figure 9.

Example of problems with automatic measurements by contemporary electrocardiogram machines. The left and middle panels show scans of leads I and II of two automatically-measured electrocardiograms; the right panel shows superimposition of the electrocardiographic patterns from the two tracings. The QT interval duration is the same in both tracings, but the machine reports a difference of 100 ms. Reproduced from Camm AJ, Yap YG, Malik M. Acquired long QT syndrome. Blackwell, 2004, with permission.
5.1.6 Co-factors affecting the QT interval
The purpose of QT measurement during drug development is to estimate the size of a drug effect, if any, on the duration of the QT interval. This task is made more difficult by the fact that the QT interval is affected by multiple co-factors, and any drug effect must be separated from these. Some of these factors are immutable (sex), some change little during typical trials (age), and some can be held constant or let vary unrelated to treatment (patient position or time of day(77)) so as to reduce their potential for confounding. Others are more difficult to control, because drugs typically have multiple effects, and it may not be possible or even meaningful to isolate the QT effect from the others.
5.1.6.1 Serum potassium
For example, the duration of the QT interval is prolonged during frank hypokalemia, but the effects of minor variations in serum potassium levels have not been reported. Although use of thiazide diuretics is said to be a risk factor for torsade, this association is presumably mediated by the occurrence of diuretic-induced hypokalemia.(78) The statement that a specific thiazide diuretic prolongs the QT interval would generally be taken to mean that it does so even when the serum potassium is somehow held constant. Whenever a drug has a nonzero effect on serum potassium, precise estimation of a QT effect may require adjustment of the raw measurements to separate a direct effect from one mediated by changes in serum potassium. Data that might be used for such adjustment have not been reported.
Because lowering serum potassium increases the risk of torsade,(78) concern about distinguishing thiazide effects on serum potassium from direct effects on QT duration might be dismissed as a semantic exercise: By whatever mechanism, use of thiazide diuretics increases the risk of torsade. Other drugs, however, might have effects that affected repolarization in different directions. For example, a potassium-sparing diuretic could have direct effects on ion channels that increased the risk of torsade but – because of the drug’s effect on serum potassium – a net effect that made torsade less likely.
5.1.6.2 Heart rate
Heart rate is the best known of the co-factors affecting QT duration: A QT interval that is normal at one heart rate may be abnormal at another.
Clinicians might have come to deal with rate-related changes in QT duration by using tables, similar to common height-weight tables. It might have become customary to look up an observed age, sex, heart rate, and QT duration, and to see in which percentile the observed QT duration fell. This solution was not adopted. Instead, clinicians have used one or another QT normalization formula, just as many clinicians use the body-mass index instead of less practical height-weight tables.
More than thirty different formulas have appeared in the literature.(79) Each relies on a model of how the QT duration normally varies with heart rate. Many of the published models are of the form
| (Eq 1) a common RR-QT model |
for some α and β, where RR is the cycle length (60 / heart rate). The α parameters of several of the published formulas are shown in Table 4.
Table 4.
Parameters in some published QT/RR models in the form of (Eq 1).
| Author (reference) | year | α |
|---|---|---|
| Fridericia (130) | 1920 | 0.333* |
| Bazett (107) | 1920 | 0.5 |
| Mayeda (131) | 1934 | 0.603 |
| Simonson (93) | 1962 | 0.32 |
| Boudoulas (132) | 1981 | 0.398 |
| Kawataki (81) | 1984 | 0.25 |
| Yoshinaga (133) | 1993 | 0.31 |
| Hodges (134) | 1997 | 0.38 |
- Using curve fitting tools, Fridericia actually found α = 0.3558 and concluded that it might be reasonably approximated by a = ⅓
In each model based on (Eq 1), the α exponent adjusts for the variation in heart rate. Given a measured QT duration and heart rate, for any given model from the (Eq 1) family one can effectively invert the equation, computing the β coefficient needed to allow the measured values to be consistent with the given α exponent. If the RR interval is measured in seconds, then the β coefficient is equal to the expected QT interval at an RR interval of one second, and is called the “corrected” QT interval, QTc. (“Corrected” is a misnomer, since the measured QT intervals may be hard to interpret, but they are not incorrect. A body weight might need to be corrected if it were measured when the subject was heavily dressed, but using the body-mass-index formula is not a correction.) Similar calculations are possible with models other than those based on (Eq 1).
In the case of models from the (Eq 1) family, the general form
| (Eq 2) general QTc model |
(where QT is the measured QT duration and RR is the measured cycle length) becomes
| (Eq 3) QTc formula corresponding to the model of ((Eq 1) |
The value of this calculation is that if the a parameter is numerically correct, then the computed QTc may be compared to a known normal range without further attention to the measured QT duration and the measured heart rate. This process is akin to the one that allows clinicians who believe that weight varies with height according to
to use the computed body-mass index
Loosely, formulas like (Eq 2) and (Eq 3) are sometimes said to be telling us what the QT interval “would have been” if other things were equal and the heart rate were 60; in the same way, a patient’s body-mass index might be interpreted as indicating what the patient’s weight “would have been” if other things were equal and the patient’s height were one meter.
Since all of the associated models from Table 4 are of the form shown in (Eq 1), the different choices of α must give different results, and the differences can be substantial. There has been at least one trial (80) that separated heart-rate effects from direct effects on ventricular repolarization. Volunteers in that study received atropine, and in one phase of the trial their hearts were paced to prevent the increase in heart rate that atropine normally produces. Under these conditions, the measured QT interval was shortened from baseline by 24 ms (Figure 10). In another arm of the study, the same volunteers received atropine in the absence of pacing. The measured QT interval was decreased by 49 ms, combining the direct effect (24 ms) with an extra 25 ms induced by the rate change. An adequate “correction” formula would have adjusted for the rate and come out with a decrease close to the gold-standard 24 ms (probably somewhat larger since (Eq 1) is multiplicative, and the paced rate was probably faster than 60/min). The Bazett correction (α = 0.5) falsely computed that these subjects had suffered a 43 ms increase in their true QT intervals.
Figure 10.

Misleading “correction” by Bazett formula in a study of QT/QTc changes induced by atropine. See the text for details.
Many other authors have commented on the inadequacy of the Bazett formula, (81–95) but many other proposals are equally problematic. Table 4 provides a variety of other α values to choose among, but in the decades since the reports of Bazett and Fridericia, the α values do not appear to be converging over time. The reason why different workers have come up with such remarkably different values is that each of the published methods reports a curve that was the best fit to data from a limited population, and the wide range of reported α parameters is a consequence of these authors having estimated a parameter of very high inter-subject variance.(96;97)
The typical extent of inter-subject variance is seen in Figure 11, which shows the QT interval and heart rate from each of about 100 electrocardiograms in each of two subjects. Points plotted with the same symbol come from electrocardiograms of the same subject. The intersubject differences may be easier to see in Figure 12, where different subjects are represented by just the best-fitted line of the form of (Eq 1). Each of the subjects had QT intervals that were consistently related to heart rate in a linear or curvilinear manner, but the individual curves differed in position, slope, and curvature. It is not hard to see how different investigators might, from small samples, come out with different best-fit formulas. In terms of (Eq 1), each subject would be best fit by personal values of α and β.
Figure 11.
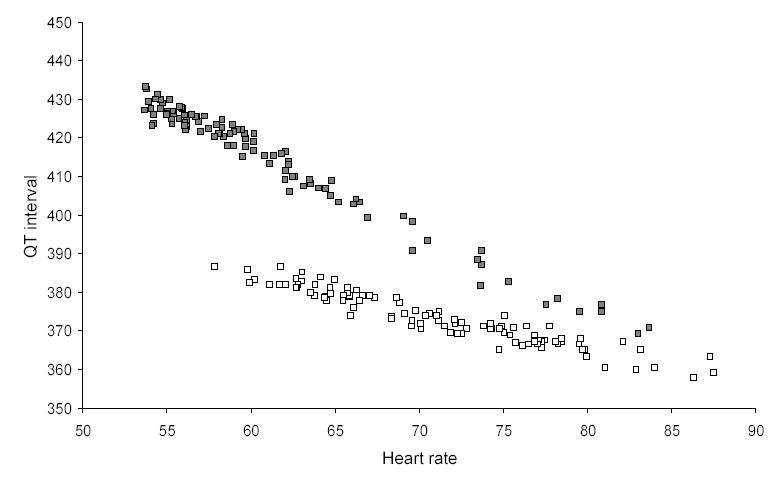
Heart rate and QT interval measurements in 100 electrocardiograms from each of two normal middle-aged male subjects. Only stable electrocardiograms free of QT/RR hysteresis and of recording noise were selected from day-time continuous 12-lead recordings. Measurement was performed manually using previously described technology.(76)
Figure 12.

Regression representation of QT/heart rate relationships in 6 normal middle-aged subjects. The data of each subject were fitted with a regression line corresponding to the individualized form of (Eq 1).
High variance might be inescapable if the RR-QT relationship varied not only between subjects, but even within the same subject from time to time. Fortunately, this turns out not to be the case. In studies of the same subjects repeated over a period of one month, Malik at al found that each subject’s RR-QT relationship was preserved over time.(98,99) More recent observations confirm that the stability of these relationships persists for at least 2 years (100).
Once an individual’s RR-QT relationship has been characterized, it should be easy to check where any new (RR, QT) pair lies with respect to the usual measurements of the same subject. Specifically, the extent to which drug treatment can properly be said to have altered the QT interval of a subject is the extent to which drug-affected (RR, QT) pairs are outside the usual drug-free distribution of (RR, QT) pairs. If the subjects in a trial can be seen each to have demonstrated the same (RR, QT) pairs on and off drug, there is no place for concern arising from a model (Bazett or other) of how the QT duration should vary with heart rate.
Although the evaluation of any given (RR, QT) is straightforward, there is no scalar expression for the difference (possibly a drug effect) between two different RR-QT relationships. When the effect of drug treatment is not so much to shift the QT/RR curve as to change its slope or curvature, the estimated change in QTc could be positive or negative, depending on the RR interval. When the only description of the difference is the difference in QTc at RR = 1000 ms, information has been discarded.
5.1.6.2.1 Pacing heart-rate variation away
Cardiac pacing might – as in the study shown in Figure 10 – be an attractive means of eliminating drug-induced changes in heart rate, apparently simplifying investigation of drug-induced changes in repolarization. There are no recent reports of this methodology, perhaps because of the ethical difficulties of transvenous pacing, and the discomfort induced by percutaneous pacing, of healthy volunteers. Even if these difficulties could be overcome, pacing studies would necessarily be of limited duration, data could be collected only within a relatively narrow range of (rapid) heart rates, and the stress responses likely to be associated with temporary pacing might raise questions about generalizability of the results.
5.1.6.2.2 Each patient as his or her own control
To determine the extent to which an observation made during treatment reveals a drug effect, it is necessary to compare that observation to observations made in the absence of treatment, but with other co-factors unchanged. One attraction of large trials is that co-factors unaffected by drug treatment will on average have the same distribution in each arm of any such trial.
Large trials are not necessarily helpful when one or more co-factors are affected by the drug treatment. In the specific case of heart rate as a co-factor determining QT duration, one is asking how an observed QT duration, seen during treatment when the subject had a stable heart rate, compares to the QT intervals ordinarily seen in the same patient off treatment and with the same stable heart rate.
5.1.6.2.2.1 Bin methods
Theoretically, the most straightforward approach to this question is model-free. (RR, QT) pairs are collected while the patient is not receiving the treatment to be tested, and these pairs are distributed into “bins” according to the immediately preceding RR value. With a bin width of (say) 10 ms, the bins might contain all of those pairs with 500 ≤ RR < 509 ms, 510 ≤ RR < 519 ms, …, 1190 ≤ RR < 1199 ms, and 1200 ≤ RR < 1209 ms, respectively. To evaluate a new (RR, QT) pair obtained during drug treatment, standard statistical techniques are used to ask how the new QT value compares to those in the bin to which the new RR value would be mapped.(101–104)
In part because of the problem of excluding complexes not preceded by adequate periods of stable heart rate (see Section 5.1.1.1), collecting data sufficient for implementation of a bin method is labor-intensive, and adequate statistical power may be difficult to achieve unless the population of each relevant bin is > 50. Especially if the drug effect on the heart rate is large, the RR intervals observed during treatment may have appeared rarely or not at all before treatment started. Increasing the bin widths can alleviate this problem, but only at the cost of decreased precision and increasing bias (essentially regression bias(105)) toward false detection of outliers. Further, since similar on- and off-drug heart rates may appear at different time of the day, the precision of the bin method is likely decreased by the circadian rhythm of heart rate corrected QT interval.(106) Similarly, if the drug changes heart rate considerably, similar on- and off-drug heart rates are bound to be associated with different levels of other co-factors, leading potentially to inappropriate comparisons.
5.1.6.2.2.2 Formula-based methods
By making minimal mathematical assumptions, the data requirements of the bin methods can be reduced, and the problems of bias can be eliminated. As shown in the typical examples depicted in Figures 11 and 12, individual RR-QT relationships may vary, but all are smooth and of limited curvature. If a reasonable number of off-treatment (RR, QT) pairs is collected from a given subject, spanning a reasonable range of RR values, standard curve-fitting techniques can be used to find the best-fitting member (say, QT = φ(RR)) of a family of parametric curves. Thereafter, an (RR0, QT0) pair obtained during treatment can be tested by applying standard statistical tests to the residual ΔQT = QT0 – φ(RR0). When individualized formulas have been computed for each of a population of subjects, the individualized ΔQT values can be pooled and similarly tested.(79) Since the objective is to fit the off-treatment (RR,QT) pairs best, different families of parametric curves might be applied to different subjects.
Use of formula-based methods reduces the data requirements of individualized adjustment for heart rate, but the requirements are still substantial. It is not possible to predict exactly how many electrocardiograms are needed for each subject, but truly stable estimates of the curve fitting parameters (e.g., for curves of the (Eq 1) family, stable estimates of α) are rarely obtained with fewer than 20 electrocardiograms. Even when many electrocardiograms have been obtained, stable estimates will not be able to be produced if – as is often the case with electrocardiograms obtained at rest at the same time of day – the heart rate varied only within a narrow range.
Most of our experience of formula-based heart-rate adjustment has used the family of curves defined by (Eq 1) as well as with several others.(99) While there is no a priori reason to restrict attention to any family of curves, or even to require that all of the subjects in a study be fitted with curves from the same family, experience with different mathematically defined curves suggests that QTc values at moderate heart rates will rarely differ by more than 5 milliseconds when computed by individualized curves from different families. Even at very slow or very fast heart rates, we have not seen differences between individualized curves from different families greater than 15 ms.
Two large databases (Fenichel and Malik, unpublished observations) were explored with individualized curves from the family of (Eq 1). The results are shown in Table 5; parameters of a new population might be as different from each of these as these were from each other.
Table 5.
Numerical values of parameters of (Eq 1) found in two unpublished studies.
| Study 1 | Study 2 | ||
|---|---|---|---|
| N | 50 | 229 | |
| data quality | excellent | Less precise | |
| α | minimum | 0.23 | 0.06 |
| 1st quartile | 0.33 | 0.20 | |
| median | 0.37 | 0.27 | |
| 3rd quartile | 0.41 | 0.34 | |
| maximum | 0.49 | 0.78 | |
| β | minimum | 0.37 | |
| 1st quartile | 0.39 | ||
| median | 0.40 | N/A | |
| 3rd quartile | 0.41 | ||
| maximum | 0.45 |
5.1.6.2.3 Norms derived from the study population
The data requirements can be reduced still further by fitting a single curve to pooled off-drug data from all of the subjects in a study, but this approach brings problems of its own. A curve that attempted to describe the population of Figure 11, for example, would pass somewhere through the middle of that graph. On-treatment (RR, QT) pairs seen in these subjects might lie directly on the population-derived line and still be grossly abnormal for either subject.
On the other hand, any number of on-treatment (RR, QT) pairs seen in these subjects might lie far from the central line and still each be typical of the baseline RR-QT pairs of the affected subject. A non-individualized RR-QT formula can be optimal for the population overall, but still a very poor fit to many (or even all) of its members, so specificity may be extremely poor. Because the population QT/RR slope may be different from the mean of the individual slopes, such a formula may provide biased estimates of the average change in QT interval, and it is totally inappropriate for identification of noteworthy responses in individual subjects.
In terms of (Eq 1), an erroneously high value for α causes one to expect that with increasing heart rate, the QT interval will decrease more rapidly than it actually does. As a result, normal reductions of QT duration with heart rate will be perceived as insufficient, suggesting that some concomitant process is prolonging the QT interval. With decreasing heart rate, an erroneously high value of α will lead to acceptance as normal of QT durations that are actually abnormally long. Erroneously low values of α have, of course, the opposite effects.
5.1.6.2.4 Assumed, population-independent norms
Instead of fitting a curve to the mean RR-QT relationship of the population to be studied, one may posit a standard relationship, choosing (for example) one of the formulas of Table 4 or another of the 30 or 40 formulas in the literature. With luck, one might be no worse off (but surely no better off) than with a population-fitted formula.
5.1.6.2.4.1 The Bazett formula
Every formula from the (Eq 1) family (with α > 0) postulates that the QT interval should shorten as the heart rate increases, and for most clinical purposes it may make little difference which is used. Even so, the lasting popularity of the Bazett formula (α = 0.5) is difficult to understand.
The Bazett formula was derived empirically by pre-statistical methods, using data from a small population,(107) and the exponent 0.5 appears to have been chosen fairly casually, as much on the grounds of ease of computation as anything else. An α value of 0.5 would be greater than any of those seen in the 50 subjects of the better-quality study described above in Section 5.1.6.2.2.2, so at heart rates above 60, any QTc values computed by the Bazett formula would be falsely elevated in each of these subjects, and at heart rates below 60 (where the risk of torsade is greatest), the Bazett formula would give false reassurance in every case.
Even in evaluating patients whose heart rate is exactly 60/min, clinicians are probably carrying unwanted baggage from the years of uncritical acceptance of the Bazett formula. When the heart rate is 60/min, the accepted upper limit of normal for the QT duration is given in most texts as 440 ms. This range might have been obtained by studying a population of subjects whose heart rates happened to be 60/min, but we suspect that it was actually obtained by pooling the QTc values, computed by the Bazett formula, of subjects at various heart rates, mostly greater than 60/min. Because the great majority of these QTc values will have been falsely elevated as described above, the actual upper limit of normal QT duration at a heart rate of 60 is probably somewhat lower than the accepted upper limit. In the light of such considerations as these, it is strange to see the Bazett formula being occasionally defended on the grounds that its errors are always conservative and prudent.
5.2 Interpretation
QT prolongation is a mediocre predictor of torsade or other ill effects. Some drugs (amiodarone, pentobarbital, etc.) can cause large QT prolongations, but – by reducing transmyocardial dispersion of repolarization – they actually reduce the likelihood of torsade. At the other extreme, some patients with congenital long-QT syndromes have normal QT duration, but they still have an increased risk of sudden death. Small studies in patients with cardiovascular disease have tended to show an association between modest QT prolongation and mortality, but in a review of 7 prospective studies of 36 031 persons, Montanez et al. found no such association, except possibly in the subgroup of persons with pre-existing cardiovascular disease.(108)
Notwithstanding these caveats, it is reasonable to be concerned about large QT prolongations, and to derive some comfort from QT intervals that remain unchanged during drug treatment. In fact, every drug convincingly associated with human torsade has been shown – perhaps only at supratherapeutic doses and/or in the presence of co-administered metabolic inhibitors – to cause QT prolongation of at least 60 ms. This is not to say that all human torsade-inducers cause large QT prolongations at conventional doses. As is well known, metabolically-intact subjects who receive normal doses of cisapride or terfenadine sustain QT prolongations of only a few milliseconds, scarcely distinguishing these drugs from placebo. But these drugs can easily be made to cause large QT changes by increased dosing and/or metabolic inhibition.
5.2.1 Early trials
These considerations suggest a strategy for early human studies of a new drug. The purpose of such studies should be to observe the QT effects of the maximal possible exposure to the drug and/or – if the electrophysiological effects of the drug are mediated by metabolites – to its metabolites. Including hundreds of subjects is not likely to provide additional information, if a dozen or so subjects have been studied with adequate intensity. QT responses in women and in patients with heart failure are typically greater than those in healthy young men, but the differences are not large, and the quality and stability of electrocardiograms in heart-failure patients is frequently problematic.
Two or more waves of these studies may be necessary, if the first studies are begun before all of the human metabolites are identified and characterized, or before the pertinent metabolic pathways have been identified. If an electrophysiologically-active metabolite accumulates only very slowly, studies of maximal exposure may entail direct administration of the metabolite. Multiple on-treatment measurements are necessary, to be sure that the measurements have been made near the times of peak activity of all of the relevant molecular species.
New drugs are often potential replacements for older drugs that were never properly studied. To simplify interpretation of weakly positive findings, it will sometimes be prudent to include dosing of older drugs of the same therapeutic class in parallel arms of each of these early trials. Ziprasidone, for example, was found to cause non-zero changes in the QT interval, but the same studies were able to show that older medications (phenothiazines and butyrophenones) caused similar changes.(109) Similarly, some agents used as metabolic inhibitors (e.g., ketoconazole) turn out to have small nonzero QT effects of their own,(110) so it may be necessary to include arms for these as well.
In most respects, aggressive maximization of exposure in early trials is appropriate regardless of the adverse effect of interest, but repolarization changes are special in two ways. First, the associated risk (death as the result of malignant tachyarrhythmias) is one from which – by intensive monitoring –Phase 1 subjects can be relatively well protected. When an appropriately monitored Phase 1 subject has had a suspicious electrocardiogram, the option to continue dosing might be more reasonable than it would be if the subject had had an equally suspicious panel of hepatocellular enzymes.
Second, a subject with an unusual repolarization response to a new drug is reasonably likely to have similar responses to others, and electrophysiological evaluation of the subject is therefore in the interest of both the drug developer and the subject. No similar statements can be made when a subject's response to a studied drug suggests hematologic or hepatic toxicity.
The observation of large drug-induced QT changes in these trials is important, even if such changes are seen in only one or two subjects, and only at extreme doses. The subjects exhibiting the large changes should be studied further, possibly identifying special risk factors (such as polymorphisms in genes known to be associated with congenital long QT syndrome). Whether or not special risk factors are identified, the observation of large QT changes might make it worthwhile for the developer to return to preclinical studies, possibly demonstrating that the drug is – like amiodarone – one of the few whose QT-prolonging effects are associated with a reduced, rather than an increased, risk of torsade.
If exposure was limited (say, by other adverse effects) to only small multiples of that seen with therapeutic dosing, then the non-observation of large drug-induced changes is relatively uninformative. In this situation, the preclinical data are of increased importance.
If only small QT changes are observed, despite exposure exceeding that of ordinary dosing by one or two orders of magnitude, then these trials can be taken to be strongly reassuring.
5.2.2 Later trials and post-marketing surveillance
It is rarely feasible to subject the numerous subjects and patients in later trials to the extensive baseline studies and intensive monitoring that are appropriate in early studies. For these reasons, precise QT interpretation will generally not be possible in the later studies, and aggressive maximization of exposure may be open to ethical question. Some patient populations (notably patients with congestive heart failure(111)) are known to be at increased risk of torsade, but even in these populations, torsade has not been attributed to drugs that could not, in normal subjects, be made to induce large QT changes. The only interpretable events in later reports will be large QT changes and occasional occurrences of torsade. These should be followed up, but important repolarization-related discoveries in these later trials are unlikely if proper attention has been given to early ones.
6 Risk and benefit
The first step in any discussion of risk must be the decision as to whether risk is actually present. Unconfounded observation of human torsade de pointes speaks for itself, and torsade induced in animals or wedge preparations should also be taken as solid evidence of risk – albeit unquantified – in humans.
Once a drug has been found to carry genuine risk of inducing torsade, it is reasonable to expect the duration of the QT interval – properly measured – to be positively associated with the magnitude of risk. In particular, risk may be expected to be reduced when dosing is guided by QT measurement. On the other hand, the rate of increase of risk with increasing QT interval may differ from drug to drug, just as it differs from one congenital LQT syndrome to another.(112)
More often, preclinical and early clinical studies will provide no direct evidence of risk. They may provide evidence of, e.g., HERG blockade and QT prolongation, but these phenomena are easily produced by agents that do not induce torsade de pointes or other malignant tachyarrhythmias. HERG blockade and QT prolongation by themselves are not strong evidence of genuine risk.
On the other hand, to date there has been no example of human torsade de pointes induced by a drug that does not block IKr or by a drug that cannot cause substantial increases in QT duration. We say “to date” because (as noted above) torsade certainly occurs in congenital LQT syndromes in which IKr is unaffected, and it even occurs in LQT patients who have the culprit mutations but normal electrocardiograms. Drug-induced polymorphic ventricular tachycardia unrelated to IKr and with minimal (or no) QT prolongation will probably sooner or later be reported. Nevertheless, for the moment one can be comforted upon finding that a drug does not block IKr, or upon finding that it cannot be made to greatly prolong the QT interval.
These comforting findings of inactivity should be convincing only when they are the results of due experimental diligence. For example, normal doses of terfenadine lead to QT prolongations averaging only a few milliseconds when given to metabolically-competent subjects, but the prolongations can be more than an order of magnitude higher when drug metabolism is impaired;(113) the latter effects are the effects of interest. Before concluding that the QT-prolonging effects of a drug are small, the investigator must have explored the full range of tolerated doses, under all relevant conditions of metabolic interference.
The techniques of in vitro studies and QT interpretation described above have greatly increased the precision with which electrophysiological effects of drugs can be detected and compared. Even when genuine risk has not been demonstrated, these measurements might be used as figures of relative merit. For example, developers might be tempted to abandon development of an antibiotic whose IC50 for IKr was 300 nM, preferring to develop a related compound whose IC50 in the same assay was 400 nM. Such temptations should be resisted. It is unlikely that differences of this magnitude have any predictive value at all, and other features of the two drugs (e.g., subtle differences in antibiotic efficacy) are likely to be much more important.
When there is evidence of genuine risk (that is, as noted above, reports of torsade or presumptive torsade in humans or other intact or near-intact higher animals), this evidence must be combined with the evidence of unrelated risks and with the evidence for benefit.
Unrelated risks will in many cases be more important than torsade, even if they are not associated with convenient markers like the electrophysiologic and electrocardiographic markers of altered repolarization. When drugs are used in intensive-care settings, torsade de pointes should rarely lead to irreversible harm, while other toxicities (e.g., hepatotoxicity or myelotoxicity) may be much more difficult to reverse, even if they are detected equally promptly. When drugs are prescribed for outpatient use, where torsade is more likely to be lethal, torsade may still be so rare that it is outweighed in importance by other toxicity.
The ultimate evaluation of risks and benefits will occasionally be simple. Compared to older drugs, the new drug might provide greater benefits at the same or reduced risk, or – as with fexofenadine compared to terfenadine – equal benefits at lower risk. In such a case, the older drugs are what economists call “dominated strategies,” and the new drug is uniquely attractive. Conversely, the new drug might be easily rejected if it differs from older alternatives only in providing similar or lesser benefits at greater risk.
If the new drug is not a dominated or dominating strategy, but there is evidence of benefit with respect to a mortality endpoint, the decision is again simple. Regardless of whether torsade was or was not seen in the clinical trials, mortality trials have by definition incorporated the ill effects of torsade. If there is convincing evidence of net benefit (as in trials of highly torsadogenic arsenic compounds in the treatment of acute promyelocytic leukemia(114–117)), then – unless there is doubt about the generalizability of the trials – there should be no residual concern about torsade.
Sometimes the expected benefit of a drug is a reduction in irreversible harm (e.g., a reduction in the incidence of stroke), but the available data show only benefit with respect to a surrogate endpoint (e.g., reduction in blood pressure). These cases are difficult, although it may sometimes be possible when risk has been bounded (e.g., no cases of torsade in 10 000 patient-years of exposure) to compare the upper-bound risk of torsade to the benefit thought to be linked to the effect on the surrogate endpoint.
If none of the above cases apply, and the expected benefit of the drug is symptomatic, the integration of risk and benefit must often be deferred to the affected patients. It is sometimes said that irreversible harm is never acceptable for “mere” symptomatic treatment, but as a description of how informed people commonly behave, this statement is simply false. Some people accept the small mortal risks of taking acetaminophen for common headache, or ibuprofen for dysmenorrhea, but others do not. Some people would choose surgery over radiation therapy for laryngeal cancer because of improved survival, but others would choose radiation therapy because of improved preservation of speech.(118) In the same vein, the recent U.S. Preventive Services Task Force report on postmenopausal hormone replacement therapy(119) acknowledged that “the harmful effects of [such therapy] are likely to exceed the [irreversible-harm] prevention benefits in most women,” but stated that in view of the symptomatic benefits “the balance of benefits and harms for an individual woman will be influenced by her personal preferences.…” FDA’s recent re-approval of alosetron for irritable bowel syndrome(120) appears to have been based on (belated) similar reasoning.
When the risks are even more extreme, society intervenes; therapies carrying high risks and only remote possibilities of benefit are not offered by clinicians, and drug therapies with these characteristics are not approved for marketing. Short of that point, non-dominated pharmacologic therapy for minor symptoms need not be risk-free to be appropriately developed, registered, and –when the patient informedly agrees – prescribed.
7 Summary and future directions
Put most simply, there is concern about drug-induced torsade de pointes, but torsade is so rare that seeking it is an impractical, insensitive study. The best predictor of human torsade is increased transmural dispersion of repolarization, but this is measurable only in preclinical studies of limited availability. The situation is unsatisfactory.
One might hope that ongoing rapid genetic advances will allow populations at higher risk to be identified, so that detection of risk becomes a practical means of screening, and so that patients at increased risk can be identified and, perhaps, excluded from some therapies. These hopes may be unrealistic. Genotyping for any of the hundreds of LQTS variations is now so expensive that such screening must be limited to research settings. Technological advances may substantially reduce these costs, but even if they do, widespread screening appears unlikely to be adopted rapidly. We say this because humans with known characteristics leading to adverse reactions to some pharmacotherapy (CYP2D6 poor metabolizers, for example, or persons with pseudocholinesterase deficiency) have been easily identifiable for many years, but few such patients are in fact identified prospectively. In a risk-averse regulatory environment, the prospect of therapies indicated for, or contraindicated in, only people of certain genotypes is sure to be problematic.
Unlike the overall QT interval, some T-wave-derived measurements appear – as described in Section 5.1.5 – to be more directly linked to transmural dispersion of repolarization. These measurements are promising, but their validation may be difficult in the absence of an accepted methodology in populations at high risk of drug-induced torsade de pointes.
Footnotes
Contributors
The project was organized by RRF and MM. Initial position statements were submitted by CA (implications of transmyocardial dispersion of repolarization), LC (preclinical in vivo investigations), DMR (clinical and regulatory implications), RRF (introduction, risks and benefits), MM (electrocardiography), SGP (genetic considerations), JR (clinical considerations), and MS (in vitro investigations), and these contributions were then criticized by other members. After a 2-day strategy meeting attended by CA, LC, DMR, RRF, RJL, MM, and JR, and with continuing interactions among all of the members, the manuscript was written by RRF and edited by MM.
The consensus expressed in this article has been facilitated by unrestricted educational grants from Abbott Laboratories, Almirall Prodesfarma, CV Therapeutics, Eli Lilly & Company, Grünenthal GmbH, and H. Lundbeck A/S. The sponsors had no role in selecting the members of the Task Force, the composition of the article, or the decisions related to its publication. CA also receives support from the National Institutes of Health (HL 47678) and from the New York State Affiliate of the American Heart Association. DMR also receives support from the National Institutes of Health (HL46681, HL49989, HL65962), MM also receives support from British Heart Foundation and the Wellcome Trust.
Disclosures of potential conflicts of interest
In the past two years, CA has received consulting fees or research support from Aventis Pharmaceuticals, Chugai Pharmaceutical, CV Therapeutics, Eli Lilly Pharmaceuticals, Pfizer Pharmaceuticals, and Physiome Sciences; LC has received consulting fees from Almirall Prodesfarma, ICOS, Eli Lilly, Sanofi-Synthélabo, and ViroPharma; RRF has received consulting fees from Abbott Laboratories, Actelion Pharmaceutical, Aderis Pharmaceuticals, Almirall Prodesfarma, AstraZeneca LP, Aventis Pharmaceuticals, Berlex Laboratories, Boehringer-Ingelheim Pharmaceuticals, Bristol-Myers Squibb, Centocor, Corgentech, Corvas International, CV Therapeutics, DepoMed, Forest, GlaxoSmithKline, Hoffman-LaRoche, Lilly Research Laboratories, H. Lundbeck A/S, Meditor, Medtronic, MetaPhore Pharmaceuticals, Mylan Laboratories, Myogen, NeuroSearch, Novartis, Otsuka, Penwest Pharmaceuticals, Pfizer Pharmaceuticals, Pharmacia & Upjohn, Physiome Sciences, Procter and Gamble, Purdue, Reddy, Ross, Roxane Laboratories, Sanofi-Synthélabo, Schwarz BioSciences, Scios, Sepracor, Sigma Tau, Somerset, Synpac, Theravance, Upsher-Smith, United Therapeutics, Watson Pharma, WinPharm, Wyeth-Ayerst, Yamanouchi Pharma America, and Zengen; RJL has received consulting fees from Academic Pharmaceuticals, Abbott Laboratories, Actelion Pharmaceuticals, Alexion Pharmaceuticals, Almirall Prodesfarma, Alteon Inc., Amylin Pharmaceuticals, Angiogenix Inc, Astra Zeneca LP, Aventis Pharmaceuticals, Bayer, BioCryst, BioMarin Pharmaceuticals, Boehringer-Ingelheim Pharmaceuticals, Biovail, Bracco Diagnostics, Collegium Pharmaceutical, Combinatorix Inc., CV Therapeutics, CuraGen Corporation, Diakron Pharmaceuticals, Dr Reddy's Laboratory, eNos Pharmaceuticals, Esperion, Fujisawa, GlaxoSmithKline, Hyseq Pharmaceuticals, ICOS, Indevus, INO Therapeutics, Jansen (Johnson & Johnson), King, LaJolla, Lilly Research Laboratories, H. Lundbeck A/S, The Medicines Company, Medifacts (Med Therapeutics), Medtronic AVE, Inc., Mission Pharmaceuticals, Mylan Laboratories, Myogen, Inc., Nerosearch, Novartis, Otsuka, Pfizer, Pharmacia & Upjohn, Point Biomedical, Provensis, Reliant, Restoregen, Sanofi-Synthélabo, Scios, Sepracor, Shire, Sigma Tau, Solvay, Speedel, Synergy Research, Taro, Transform, United Therapeutics, VDDI, Vivus, Wellspring and Wyeth-Ayerst Pharmaceuticals; MM has received consulting fees from Abbott Laboratories, Almirall Prodesfarma, Alza Corporation, Antisoma Ltd, AstraZeneca, Aventis Pharma, Boehringer-Ingelheim Pharmaceuticals, Cardionetics Ltd, CV Therapeutics, Eisai Ltd, Forum Bioscience Holding, GlaxoSmithKline, Global Medical Solutions, Grünenthal GmbH, Icon Clinical Research, Janssen Research Foundation, Lilly Research Laboratories, Lundbeck A/S, Lorex Synthelabo, Medtronic, Merck Research Laboratories, Neurosearch, Novartis, Otsuka, Pfizer Pharmaceuticals, Roche Products Ltd, Sanofi-Synthelabo, Schering AG, and Takeda Pharmaceuticals; SGP has received consulting fees from Almirall Prodesfarma, H. Lundbeck A/S, and Pharmacia & Upjohn; DMR has received consulting or speaking fees from Abbott Laboratories, Alza, AstraZeneca LP, Bayer, Boehringer Ingelheim Japan, Bristol-Myers Squibb, CV Therapeutics, GlaxoSmithKline, Johnson & Johnson, Medtronic, Pfizer Pharmaceuticals, Pharmacia, Schering Plough, Solvay Pharmaceuticals, and Yamanouchi Pharma America; JR has received consulting fees and honoraria from Almirall Prodesfarma, Bristol-Myers Squibb, Cryo Cath, CV Therapeutics, Guidant, ICOS, H. Lundbeck A/S, Medtronic, Novartis, Pfizer Pharmaceuticals, and Sanofi-Synthélabo; and MS has received consulting fees from Abbott Laboratories, Chantest, CV Therapeutics, Neurion, and Pharmacia & Upjohn.
References
- 1.Yang T, Roden DM. Extracellular potassium modulation of drug block of IKr: Implications for torsade de pointes and reverse use-dependence. Circulation. 1996;93:407–11. doi: 10.1161/01.cir.93.3.407. [DOI] [PubMed] [Google Scholar]
- 2.Haverkamp W, Breithardt G, Camm AJ, Janse MJ, Rosen MR, Antzelevitch C, Escande D, Franz M, Malik M, Moss A, Shah R. The potential for QT prolongation and proarrhythmia by non-antiarrhythmic drugs: clinical and regulatory implications. Report on a policy conference of the European Society of Cardiology. Eur Heart J. 2000;21:1216–31. doi: 10.1053/euhj.2000.2249. [DOI] [PubMed] [Google Scholar]
- 3.Hohnloser SH, Klingenheben T, Singh BN. Amiodarone-associated proarrhythmic effects. A review with special reference to torsade de pointes tachycardia. Ann Intern Med. 1994;121:529–35. doi: 10.7326/0003-4819-121-7-199410010-00009. [DOI] [PubMed] [Google Scholar]
- 4.Hohnloser SH, Singh BN. Proarrhythmia with class III antiarrhythmic drugs: definition, electrophysiologic mechanisms, incidence, predisposing factors, and clinical implications. J Cardiovasc Electrophysiol. 1995;6:920–36. doi: 10.1111/j.1540-8167.1995.tb00368.x. [DOI] [PubMed] [Google Scholar]
- 5.van Opstal JM, Schoenmakers M, Verduyn SC, de Groot SH, Leunissen JD, van Der Hulst FF, Molenschot MM, Wellens HJ, Vos MA. Chronic amiodarone evokes no torsade de pointes arrhythmias despite QT lengthening in an animal model of acquired long-QT syndrome. Circulation. 2001;104:2722–7. doi: 10.1161/hc4701.099579. [DOI] [PubMed] [Google Scholar]
- 6.Shimizu W, McMahon B, Antzelevitch C. Sodium pentobarbital reduces transmural dispersion of repolarization and prevents torsades de Pointes in models of acquired and congenital long QT syndrome. J Cardiovasc Electrophysiol. 1999;10:154–64. doi: 10.1111/j.1540-8167.1999.tb00656.x. [DOI] [PubMed] [Google Scholar]
- 7.Weissenburger J, Nesterenko VV, Antzelevitch C. Transmural heterogeneity of ventricular repolarization under baseline and long QT conditions in the canine heart in vivo: torsades de pointes develops with halothane but not pentobarbital anesthesia. J Cardiovasc Electrophysiol. 2000;11:290–304. doi: 10.1111/j.1540-8167.2000.tb01798.x. [DOI] [PubMed] [Google Scholar]
- 8.Keating MT, Sanguinetti MC. Molecular and cellular mechanisms of cardiac arrhythmias. Cell. 2001;104:569–80. doi: 10.1016/s0092-8674(01)00243-4. [DOI] [PubMed] [Google Scholar]
- 9.Mohler PJ, Schott JJ, Gramolini AO, Dilly KW, Guatimosim S, duBell WH, Song LS, Haurogne K, Kyndt F, Ali ME, Rogers TB, Lederer WJ, Escande D, Le Marec H, Bennett V. Ankyrin-B mutation causes type 4 long-QT cardiac arrhythmia and sudden cardiac death. Nature. 2003;421:634–9. doi: 10.1038/nature01335. [DOI] [PubMed] [Google Scholar]
- 10.Priori, Silvia G. Gene connection for the heart. [Web Page]; http://pc4.fsm.it:81/cardmoc [Accessed 28 Jul 2003].
- 11.Priori SG, Napolitano C, Schwartz PJ. Low penetrance in the long-QT syndrome: clinical impact. Circulation. 1999;99:529–33. doi: 10.1161/01.cir.99.4.529. [DOI] [PubMed] [Google Scholar]
- 12.Vincent GM, Timothy KW, Leppert M, Keating M. The spectrum of symptoms and QT intervals in carriers of the gene for the long-QT syndrome. N.Engl. J Med. 1992;327:846–52. doi: 10.1056/NEJM199209173271204. [DOI] [PubMed] [Google Scholar]
- 13.Priori SG, Schwartz PJ, Napolitano C, Bloise R, Ronchetti E, Grillo M, Vicentini A, Spazzolini C, Nastoli J, Bottelli G, Folli R, Cappelletti D. Risk stratification in the long-QT syndrome. N Engl J Med. 2003;348:1866–74. doi: 10.1056/NEJMoa022147. [DOI] [PubMed] [Google Scholar]
- 14.Splawski I, Timothy KW, Tateyama M, Clancy CE, Malhotra A, Beggs AH, Cappuccio FP, Sagnella GA, Kass RS, Keating MT. Variant of SCN5A sodium channel implicated in risk of cardiac arrhythmia. Science. 2002;297:1333–6. doi: 10.1126/science.1073569. [DOI] [PubMed] [Google Scholar]
- 15.Sesti F, Abbott GW, Wei J, Murray KT, Saksena S, Schwartz PJ, Priori SG, Roden DM, George AL, Jr, Goldstein SA. A common polymorphism associated with antibiotic-induced cardiac arrhythmia. Proc Natl Acad Sci USA. 2000;97:10613–8. doi: 10.1073/pnas.180223197. [DOI] [PMC free article] [PubMed] [Google Scholar]
- 16.Ekins S, Crumb WJ, Jr, Sarazan RD, Wikel JH, Wrighton SA. Three-dimensional quantitative structure-activity relationship for inhibition of human ether-a-go-go-related gene potassium channel. J Pharmacol Exp Ther. 2002;301:427–34. doi: 10.1124/jpet.301.2.427. [DOI] [PubMed] [Google Scholar]
- 17.Cavalli A, Poluzzi E, De Ponti F, Recanatini M. Toward a pharmacophore for drugs inducing the long-QT syndrome: Insights from a CoMFA study of HERG K(+) channel blockers. J Med Chem. 2002;45:3844–53. doi: 10.1021/jm0208875. [DOI] [PubMed] [Google Scholar]
- 18.Mitcheson JS, Chen J, Lin M, Culberson C, Sanguinetti MC. A structural basis for drug-induced long QT syndrome. Proc Natl Acad Sci U S A. 2000;97:12329–33. doi: 10.1073/pnas.210244497. [DOI] [PMC free article] [PubMed] [Google Scholar]
- 19.Yang IC, Kupershmidt S, Wei J, Petersen CI, Johns DC, George AL, Jr, Roden DM, Balser JR. A molecular toggle for drug block of HERG potassium channels. Circulation. 2000;102:260. [Google Scholar]
- 20.Abbott GW, Sesti F, Splawski I, Buck ME, Lehmann MH, Timothy KW, Keating MT, Goldstein SA. MiRP1 forms IKr potassium channels with HERG and is associated with cardiac arrhythmia. Cell. 1999;97:175–87. doi: 10.1016/s0092-8674(00)80728-x. [DOI] [PubMed] [Google Scholar]
- 21.Weerapura M, Nattel S, Chartier D, Caballero R, Hebert TE. A comparison of currents carried by HERG, with and without coexpression of MiRP1, and the native rapid delayed rectifier current. Is MiRP1 the missing link? J Physiol. 2002;540:15–27. doi: 10.1113/jphysiol.2001.013296. [DOI] [PMC free article] [PubMed] [Google Scholar]
- 22.Fenichel, Robert R. Drugs that do and do not affect cardiac ion channels. [Web Page]; http://www.fenichel.net/pages/Professional/subpages/QT/subpages/pqt_prolongation.htm [Accessed 19 Feb 2003].
- 23.Finlayson K, Turnbull L, January CT, Sharkey J, Kelly JS. [3H]dofetilide binding to HERG transfected membranes: a potential high throughput preclinical screen. Eur J Pharmacol. 2001;430:147–8. doi: 10.1016/s0014-2999(01)01362-0. [DOI] [PubMed] [Google Scholar]
- 24.Finlayson K, Pennington AJ, Kelly JS. [3H]dofetilide binding in SHSY5Y and HEK293 cells expressing a HERG- like K+ channel? Eur J Pharmacol. 2001;412:203–12. doi: 10.1016/s0014-2999(01)00731-2. [DOI] [PubMed] [Google Scholar]
- 25.Cheng CS, Alderman D, Kwash J, Dessaint J, Patel R, Lescoe MK, Kinrade MB, Yu W. A high-throughput HERG potassium channel function assay: an old assay with a new look. Drug Dev Ind Pharm. 2002;28:177–91. doi: 10.1081/ddc-120002451. [DOI] [PubMed] [Google Scholar]
- 26.Tang W, Kang J, Wu X, Rampe D, Wang L, Shen H, Li Z, Dunnington D, Garyantes T. Development and evaluation of high throughput functional assay methods for HERG potassium channel. J Biomol Screen. 2001;6:325–31. doi: 10.1177/108705710100600506. [DOI] [PubMed] [Google Scholar]
- 27.Zhou Z, Vorperian VR, Gong Q, Zhang S, January CT. Block of HERG potassium channels by the antihistamine astemizole and its metabolites desmethylastemizole and norastemizole. J Cardiovasc Electrophysiol 1999 Jun; 10:836–43. [DOI] [PubMed]
- 28.Carmeliet E. Voltage- and time-dependent block of the delayed K+ current in cardiac myocytes by dofetilide. J Pharmacol Exp Ther. 1992 Aug;262:809–17. [PubMed] [Google Scholar]
- 29.Mohammad S, Zhou Z, Gong Q, January CT. Blockage of the HERG human cardiac K+ channel by the gastrointestinal prokinetic agent cisapride. Am J Physiol. 1997;273:H2534–8. doi: 10.1152/ajpheart.1997.273.5.H2534. [DOI] [PubMed] [Google Scholar]
- 30.Sanguinetti MC, Jurkiewicz NK. Two components of cardiac delayed rectifier K+ current. Differential sensitivity to block by class III antiarrhythmic agents. J Gen Physiol. 1990;96:195–215. doi: 10.1085/jgp.96.1.195. [DOI] [PMC free article] [PubMed] [Google Scholar]
- 31.Carmeliet E. Effects of cetirizine on the delayed K+ currents in cardiac cells: comparison with terfenadine. Br J Pharmacol. 1998;124:663–8. doi: 10.1038/sj.bjp.0701879. [DOI] [PMC free article] [PubMed] [Google Scholar]
- 32.Kang J, Wang L, Chen XL, Triggle DJ, Rampe D. Interactions of a series of fluoroquinolone antibacterial drugs with the human cardiac K+ channel HERG. Mol Pharmacol. 2001;59:122–6. doi: 10.1124/mol.59.1.122. [DOI] [PubMed] [Google Scholar]
- 33.Zhang S, Zhou Z, Gong Q, Makielski JC, January CT. Mechanism of block and identification of the verapamil binding domain to HERG potassium channels. Circ Res. 1999;84:989–98. doi: 10.1161/01.res.84.9.989. [DOI] [PubMed] [Google Scholar]
- 34.Crumb WJ., Jr Loratadine blockade of K(+) channels in human heart: comparison with terfenadine under physiological conditions. J Pharmacol Exp Ther. 2000;292:261–4. [PubMed] [Google Scholar]
- 35.Woosley RL, Chen Y, Freiman JP, Gillis RA. Mechanism of the cardiotoxic actions of terfenadine. JAMA. 1993;269:1532–6. [PubMed] [Google Scholar]
- 36.Fang LM, Osterrieder W. Potential-dependent inhibition of cardiac Ca2+ inward currents by Ro 40–5967 and verapamil: relation to negative inotropy. Eur J Pharmacol. 1991;196:205–7. doi: 10.1016/0014-2999(91)90430-x. [DOI] [PubMed] [Google Scholar]
- 37.Abrahamsson C, Palmer M, Ljung B, Duker G, Baarnhielm C, Carlsson L, Danielsson B. Induction of rhythm abnormalities in the fetal rat heart. A tentative mechanism for the embryotoxic effect of the class III antiarrhythmic agent almokalant. Cardiovasc Res. 1994;28:337–44. doi: 10.1093/cvr/28.3.337. [DOI] [PubMed] [Google Scholar]
- 38.Han W, Wang Z, Nattel S. Slow delayed rectifier current and repolarization in canine cardiac Purkinje cells. Am J Physiol Heart Circ Physiol. 2001;280:H1075–80. doi: 10.1152/ajpheart.2001.280.3.H1075. [DOI] [PubMed] [Google Scholar]
- 39.Burashnikov A, Antzelevitch C. Block of I(Ks) does not induce early afterdepolarization activity but promotes beta-adrenergic agonist-induced delayed afterdepolarization activity. J Cardiovasc Electrophysiol. 2000;11:458–65. doi: 10.1111/j.1540-8167.2000.tb00342.x. [DOI] [PubMed] [Google Scholar]
- 40.Baskin EP, Lynch JJ., Jr Differential atrial versus ventricular activities of class III potassium channel blockers. J Pharmacol Exp Ther. 1998;285:135–42. [PubMed] [Google Scholar]
- 41.Studenik CR, Zhou Z, January CT. Differences in action potential and early afterdepolarization properties in LQT2 and LQT3 models of long QT syndrome. Br J Pharmacol. 2001;132:85–92. doi: 10.1038/sj.bjp.0703770. [DOI] [PMC free article] [PubMed] [Google Scholar]
- 42.Zhou S, Cao JM, Ohara T, KenKnight BH, Chen LS, Karagueuzian HS, Chen PS. Torsade de pointes and sudden death induced by thiopental and isoflurane anesthesia in dogs with cardiac electrical remodeling. J Cardiovasc Pharmacol Ther. 2002;7:39–43. doi: 10.1177/107424840200700i106. [DOI] [PubMed] [Google Scholar]
- 43.Antzelevitch, Charles.; Dumaine, Robert. Electrical heterogeneity in the heart: Physiological, pharmacological, and clinical implications. in: Fozzard, H. A.; Solaro, R. J., eds. Handbook of physiology: The heart. New York: Oxford University Press; 2002.
- 44.Antzelevitch C. Heterogeneity of cellular repolarization in LQTS: the role of M cells. Eur Heart J. 2001;3:K2–K16. [Google Scholar]
- 45.Akar FG, Yan G-X, Antzelevitch C, Rosenbaum DS. Unique topographical distribution of M cells underlies reentrant mechanism of torsade de pointes in the long-QT syndrome. Circulation. 2002;105:1247–53. doi: 10.1161/hc1002.105231. [DOI] [PubMed] [Google Scholar]
- 46.Antzelevitch C, Shimizu W. Cellular mechanisms underlying the long QT syndrome. Curr Opin Cardiol. 2002;17:43–51. doi: 10.1097/00001573-200201000-00007. [DOI] [PubMed] [Google Scholar]
- 47.Sicouri S, Moro S, Litovsky S, Elizari MV, Antzelevitch C. Chronic amiodarone reduces transmural dispersion of repolarization in the canine heart. J Cardiovasc Electrophysiol. 1997;8:1269–79. doi: 10.1111/j.1540-8167.1997.tb01018.x. [DOI] [PubMed] [Google Scholar]
- 48.Zygmunt AC, Thomas GP, Belardinelli L, et al. Ranolazine produces ion-channel effects similar to those observed with chronic amiodarone in canine cardiac ventricular myocytes. Pacing Clin Electrophysiol. 2002;25:626. [Google Scholar]
- 49.Shimizu W, Antzelevitch C. Cellular basis for the ECG features of the LQT1 form of the long-QT syndrome: effects of beta-adrenergic agonists and antagonists and sodium channel blockers on transmural dispersion of repolarization and torsade de pointes. Circulation. 1998;98:2314–22. doi: 10.1161/01.cir.98.21.2314. [DOI] [PubMed] [Google Scholar]
- 50.Carlsson L, Almgren O, Duker G. QTU-prolongation and torsades de pointes induced by putative class III antiarrhythmic agents in the rabbit: Etiology and interventions. J.Cardiovasc. Pharmacol. 1990;16:276–85. doi: 10.1097/00005344-199008000-00014. [DOI] [PubMed] [Google Scholar]
- 51.Lu HR, Remeysen P, De Clerck F. Nonselective I(Kr)-blockers do not induce torsades de pointes in the anesthetized rabbit during alpha1-adrenoceptor stimulation. J Cardiovasc Pharmacol. 2000;36:728–36. doi: 10.1097/00005344-200012000-00007. [DOI] [PubMed] [Google Scholar]
- 52.Sugiyama A, Satoh Y, Shiina H, Takeda S, Hashimoto K. Torsadegenic action of the antipsychotic drug sulpiride assessed using in vivo canine models. J Cardiovasc Pharmacol. 2002;40:235–45. doi: 10.1097/00005344-200208000-00009. [DOI] [PubMed] [Google Scholar]
- 53.Vos MA, de Groot SH, Verduyn SC, van der Zande J, Leunissen HD, Cleutjens JP, van Bilsen M, Daemen MJ, Schreuder JJ, Allessie MA, Wellens HJ. Enhanced susceptibility for acquired torsade de pointes arrhythmias in the dog with chronic, complete AV block is related to cardiac hypertrophy and electrical remodeling. Circulation. 1998;98:1125–35. doi: 10.1161/01.cir.98.11.1125. [DOI] [PubMed] [Google Scholar]
- 54.Weissenburger J, Chezalviel F, Davy JM, Lainee P, Guhennec C, Penin E, Engel F, Cynober L, Motte G, Cheymol G. Methods and limitations of an experimental model of long QT syndrome. J Pharmacol Methods. 1991;26:23–42. doi: 10.1016/0160-5402(91)90051-6. [DOI] [PubMed] [Google Scholar]
- 55.Weissenburger J, Davy JM, Chezalviel F, Ertzbischoff O, Poirier JM, Engel F, Lainee P, Penin E, Motte G, Cheymol G. Arrhythmogenic activities of antiarrhythmic drugs in conscious hypokalemic dogs with atrioventricular block: comparison between quinidine, lidocaine, flecainide, propranolol and sotalol. J Pharmacol Exp Ther. 1991;259:871–83. [PubMed] [Google Scholar]
- 56.Eckardt L, Breithardt G, Haverkamp W. Electrophysiologic characterization of the antipsychotic drug sertindole in a rabbit heart model of torsade de pointes: low torsadogenic potential despite QT prolongation. J Pharmacol Exp Ther. 2002;300:64–71. doi: 10.1124/jpet.300.1.64. [DOI] [PubMed] [Google Scholar]
- 57.Zabel M, Hohnloser SH, Behrens S, Woosley RL, Franz MR. Differential effects of D-sotalol, quinidine, and amiodarone on dispersion of ventricular repolarization in the isolated rabbit heart. J Cardiovasc Electrophysiol. 1997;8:1239–45. doi: 10.1111/j.1540-8167.1997.tb01014.x. [DOI] [PubMed] [Google Scholar]
- 58.Zabel M, Hohnloser SH, Behrens S, Li YG, Woosley RL, Franz MR. Electrophysiologic features of torsades de pointes: insights from a new isolated rabbit heart model. J Cardiovasc Electrophysiol. 1997;8:1148–58. doi: 10.1111/j.1540-8167.1997.tb01001.x. [DOI] [PubMed] [Google Scholar]
- 59.Johna R, Mertens H, Haverkamp W, Eckardt L, Niederbroker T, Borggrefe M, Breithardt G. Clofilium in the isolated perfused rabbit heart: a new model to study proarrhythmia induced by class III antiarrhythmic drugs. Basic Res Cardiol. 1998;93:127–35. doi: 10.1007/s003950050073. [DOI] [PubMed] [Google Scholar]
- 60.Pinney SP, Koller BS, Franz MR, Woosley RL. Terfenadine increases the QT interval in isolated guinea pig heart. J Cardiovasc Pharmacol. 1995;25:30–4. doi: 10.1097/00005344-199501000-00006. [DOI] [PubMed] [Google Scholar]
- 61.Yan G-X, Rials SJ, Wu Y, Liu T, Xu X, Marinchak RA, Kowey PR. Ventricular hypertrophy amplifies transmural repolarization dispersion and induces early afterdepolarization. Am J Physiol Heart Circ Physiol. 2001;281:H1968–H1975. doi: 10.1152/ajpheart.2001.281.5.H1968. [DOI] [PubMed] [Google Scholar]
- 62.Yan G-X, Wu Y, Liu T, Wang J, Marinchak RA, Kowey PR. Phase 2 early afterdepolarization as a trigger of polymorphic ventricular tachycardia in acquired long-QT syndrome: direct evidence from intracellular recordings in the intact left ventricular wall. Circulation. 2001;103:2851–6. doi: 10.1161/01.cir.103.23.2851. [DOI] [PubMed] [Google Scholar]
- 63.Aiba T, Shimizu W, Inagaki M, Hidaka I, Tatewaki T, Sunagawa K. Transmural heterogeneity of the action potential configuration in the feline left ventricle. Circ J. 2003;67:449–54. doi: 10.1253/circj.67.449. [DOI] [PubMed] [Google Scholar]
- 64.Clancy CE, Rudy Y. Na(+) channel mutation that causes both Brugada and Long-QT syndrome phenotypes: simulation study of mechanisms. Circulation. 2002;105:1208–13. doi: 10.1161/hc1002.105183. [DOI] [PMC free article] [PubMed] [Google Scholar]
- 65.Noble D. Modeling the heart--from genes to cells to the whole organ. Science. 2002;295:1678–82. doi: 10.1126/science.1069881. [DOI] [PubMed] [Google Scholar]
- 66.Lau CP, Freedman AR, Fleming S, Malik M, Camm AJ, Ward DE. Hysteresis of the ventricular paced QT interval in response to abrupt changes in pacing rate. Cardiovasc Res. 1988;22:67–72. doi: 10.1093/cvr/22.1.67. [DOI] [PubMed] [Google Scholar]
- 67.Burashnikov A, Antzelevitch C. Acceleration-induced action potential prolongation and early afterdepolarizations. J Cardiovasc Electrophysiol. 1998;9:934–48. doi: 10.1111/j.1540-8167.1998.tb00134.x. [DOI] [PubMed] [Google Scholar]
- 68.Pueyo E, Smetana P, Laguna P, Malik M. QT/RR hysteresis dynamicity. J Electrocardiol 2004; in press. [DOI] [PubMed]
- 69.Pueyo E, Smetana P, Caminal P, Bayes de Luna A, Malik M, Laguna P. Characterization of QT interval adaptation to RR interval changes and its use as a risk-stratifier of arrhythmic mortality in amiodarone-treated survivors of acute myocardial infarction. IEEE Trans Biomed Eng 2004; in press. [DOI] [PubMed]
- 70.Malik M, Batchvarov VN. Measurement, interpretation and clinical potential of QT dispersion. J Am Coll Cardiol. 2000;36:1749–66. doi: 10.1016/s0735-1097(00)00962-1. [DOI] [PubMed] [Google Scholar]
- 71.Antzelevitch C, Shimizu W, Yan G-X, Sicouri S. Cellular basis for QT dispersion. J Electrocardiol. 1998;30 (Suppl):168–75. doi: 10.1016/s0022-0736(98)80070-8. [DOI] [PubMed] [Google Scholar]
- 72.Dilaveris P, Batchvarov V, Gialafos J, Malik M. Comparison of different methods for manual P wave duration measurement in 12-lead electrocardiograms. Pacing Clin Electrophysiol. 1999;22:1532–8. doi: 10.1111/j.1540-8159.1999.tb00358.x. [DOI] [PubMed] [Google Scholar]
- 73.Kautzner J, Yi G, Camm AJ, Malik M. Short- and long-term reproducibility of QT, QTc, and QT dispersion measurement in healthy subjects. Pacing Clin Electrophysiol. 1994;17:928–37. doi: 10.1111/j.1540-8159.1994.tb01435.x. [DOI] [PubMed] [Google Scholar]
- 74.Malik M, Bradford A. Human precision of operating a digitizing board: implications for electrocardiogram measurements. Pacing Clin Electrophysiol. 1998;21:1656–62. doi: 10.1111/j.1540-8159.1998.tb00255.x. [DOI] [PubMed] [Google Scholar]
- 75.Takenaka K, Ai T, Shimizu W, Kobori A, Ninomiya T, Otani H, Kubota T, Takaki H, Kamakura S, Horie M. Exercise stress test amplifies genotype-phenotype correlation in the LQT1 and LQT2 forms of the long-QT syndrome. Circulation. 2003;107:838–44. doi: 10.1161/01.cir.0000048142.85076.a2. [DOI] [PubMed] [Google Scholar]
- 76.Malik M, Camm AJ. Evaluation of drug induced QT interval prolongation: Implications for drug approval and labeling. Drug Saf. 2001;24:323–51. doi: 10.2165/00002018-200124050-00001. [DOI] [PubMed] [Google Scholar]
- 77.Coumel, Philippe; Maison-Blanche, Pierre. Neuro-mediated repolarization abnormalities. Gussak, Ihor; Antzelevitch, Charles, editors. Cardiac Repolarization: Bridging Basic and Clinical Science. Totowa, NJ: Humana Press; 2003. pp. 329–50.
- 78.Chvilicek JP, Hurlbert BJ, Hill GE. Diuretic-induced hypokalaemia inducing torsades de pointes. Can J Anaesth. 1995;42:1137–9. doi: 10.1007/BF03015102. [DOI] [PubMed] [Google Scholar]
- 79.Malik M. Problems of heart rate correction in assessment of drug-induced QT interval prolongation. J Cardiovasc Electrophysiol. 2001;12:411–20. doi: 10.1046/j.1540-8167.2001.00411.x. [DOI] [PubMed] [Google Scholar]
- 80.Browne KF, Zipes DP, Heger JJ, Prystowsky EN. Influence of the autonomic nervous system on the Q-T interval in man. Am J Cardiol. 1982;50:1099–103. doi: 10.1016/0002-9149(82)90425-8. [DOI] [PubMed] [Google Scholar]
- 81.Kawataki M, Kashima T, Toda H, Tanaka H. Relation between QT interval and heart rate. applications and limitations of Bazett’s formula. J Electrocardiol. 1984;17:371–5. doi: 10.1016/s0022-0736(84)80074-6. [DOI] [PubMed] [Google Scholar]
- 82.Puddu PE, Jouve R, Mariotti S, Giampaoli S, Lanti M, Reale A, Menotti A. Evaluation of 10 QT prediction formulas in 881 middle-aged men from the seven countries study: emphasis on the cubic root Fridericia’s equation. J Electrocardiol. 1988;21:219–29. doi: 10.1016/0022-0736(88)90096-9. [DOI] [PubMed] [Google Scholar]
- 83.Karjalainen J, Viitasalo M, Manttari M, Manninen V. Relation between QT intervals and heart rates from 40 to 120 beats/min in rest electrocardiograms of men and a simple method to adjust QT interval values. J Am Coll Cardiol. 1994;23:1547–53. doi: 10.1016/0735-1097(94)90654-8. [DOI] [PubMed] [Google Scholar]
- 84.Rautaharju PM, Warren JW, Calhoun HP. Estimation of QT prolongation. A persistent, avoidable error in computer electrocardiography. J Electrocardiol. 1990;23 (Suppl):111–7. doi: 10.1016/0022-0736(90)90085-g. [DOI] [PubMed] [Google Scholar]
- 85.Sagie A, Larson MG, Goldberg RJ, Bengtson JR, Levy D. An improved method for adjusting the QT interval for heart rate (the Framingham Heart Study) Am J Cardiol. 1992;70:797–801. doi: 10.1016/0002-9149(92)90562-d. [DOI] [PubMed] [Google Scholar]
- 86.Van de Water A, Verheyen J, Xhonneux R, Reneman RS. An improved method to correct the QT interval of the electrocardiogram for changes in heart rate. J Pharmacol Methods. 1989;22:207–17. doi: 10.1016/0160-5402(89)90015-6. [DOI] [PubMed] [Google Scholar]
- 87.Kovacs SJ., Jr The duration of the QT interval as a function of heart rate: a derivation based on physical principles and a comparison to measured values. Am Heart J. 1985;110:872–8. doi: 10.1016/0002-8703(85)90472-7. [DOI] [PubMed] [Google Scholar]
- 88.Rautaharju PM, Zhou SH, Wong S, Calhoun HP, Berenson GS, Prineas R, Davignon A. Sex differences in the evolution of the electrocardiographic QT interval with age. Can J Cardiol. 1992;8:690–5. [PubMed] [Google Scholar]
- 89.Ahnve S. Correction of the QT interval for heart rate: review of different formulas and the use of Bazett’s formula in myocardial infarction. Am Heart J. 1985;109:568–74. doi: 10.1016/0002-8703(85)90564-2. [DOI] [PubMed] [Google Scholar]
- 90.Funck-Brentano C, Kibleur Y, Le Coz F, Poirier JM, Mallet A, Jaillon P. Rate dependence of sotalol-induced prolongation of ventricular repolarization during exercise in humans. Circulation. 1991;83:536–45. doi: 10.1161/01.cir.83.2.536. [DOI] [PubMed] [Google Scholar]
- 91.Ahnve S, Vallin H. Influence of heart rate and inhibition of autonomic tone on the QT interval. Circulation. 1982;65:435–9. doi: 10.1161/01.cir.65.3.435. [DOI] [PubMed] [Google Scholar]
- 92.Sarma JS, Sarma RJ, Bilitch M, Katz D, Song SL. An exponential formula for heart rate dependence of QT interval during exercise and cardiac pacing in humans: reevaluation of Bazett’s formula. Am J Cardiol. 1984;54:103–8. doi: 10.1016/0002-9149(84)90312-6. [DOI] [PubMed] [Google Scholar]
- 93.Simonson E, Cady LD, Jr, Woodbury M. The normal Q-T interval. Am Heart J. 1962;63:747–53. doi: 10.1016/0002-8703(62)90059-5. [DOI] [PubMed] [Google Scholar]
- 94.Adams W. The normal duration of the electrocardiographic ventricular complex. J Clin Invest. 1936;15:335–42. doi: 10.1172/JCI100784. [DOI] [PMC free article] [PubMed] [Google Scholar]
- 95.Ashman R. The normal duration of the QT interval. Am Heart J. 1942;23:522–34. [Google Scholar]
- 96.Rautaharju PM, Zhang ZM. Linearly scaled, rate-invariant normal limits for QT interval: eight decades of incorrect application of power functions. J Cardiovasc Electrophysiol. 2002;13:1211–8. doi: 10.1046/j.1540-8167.2002.01211.x. [DOI] [PubMed] [Google Scholar]
- 97.Malik M. Is there a physiologic QT/RR relationship? J Cardiovasc Electrophysiol. 2002;13:1219–21. doi: 10.1046/j.1540-8167.2002.01219.x. [DOI] [PubMed] [Google Scholar]
- 98.Malik M, Farbom P, Batchvarov V, Hnatkova K, Camm AJ. Relation between QT and RR intervals is highly individual among healthy subjects: implications for heart rate correction of the QT interval. Heart. 2002;87:220–8. doi: 10.1136/heart.87.3.220. [DOI] [PMC free article] [PubMed] [Google Scholar]
- 99.Batchvarov VN, Ghuran A, Smetana P, Hnatkova K, Harries M, Dilaveris P, Camm AJ, Malik M. QT-RR relationship in healthy subjects exhibits substantial intersubject variability and high intrasubject stability. Am J Physiol - Heart Circ Physiol. 2002;282:H2356–H2363. doi: 10.1152/ajpheart.00860.2001. [DOI] [PubMed] [Google Scholar]
- 100.Batchvarov V, Hnatkova K, Camm AJ, Malik M. Long-term stability of the individual QT/RR relationship: Implications for heart rate-correction of the QT interval. Circulation. 2003;108:IV–653–654. [Google Scholar]
- 101.Moss AJ, Zareba W, Benhorin J, Couderc JP, Kennedy H, Locati-Heilbron E, Maison-Blanche P. ISHNE guidelines for electrocardiographic evaluation of drug-related QT prolongation and other alterations in ventricular repolarization: task force summary. A report of the Task Force of the International Society for Holter and Noninvasive Electrocardiology (ISHNE), Committee on Ventricular Repolarization. Ann Noninvasive Electrocardiol. 2001;6:333–41. doi: 10.1111/j.1542-474X.2001.tb00127.x. [DOI] [PMC free article] [PubMed] [Google Scholar]
- 102.Badilini F, Maison-Blanche P, Childers R, Coumel P. QT interval analysis on ambulatory electrocardiogram recordings: a selective beat averaging approach. Med Biol Eng Comput. 1999;37:71–9. doi: 10.1007/BF02513269. [DOI] [PubMed] [Google Scholar]
- 103.Lande G, Maison-Blanche P, Fayn J, Ghadanfar M, Coumel P, Funck-Brentano C. Dynamic analysis of dofetilide-induced changes in ventricular repolarization. Clin Pharmacol Ther. 1998;64:312–21. doi: 10.1016/S0009-9236(98)90180-1. [DOI] [PubMed] [Google Scholar]
- 104.Smetana P, Batchvarov V, Hnatkova K, Camm AJ, Malik M. Sex differences in the rate dependence of the T wave descending limb. Cardiovasc Res. 2003;58:549–54. doi: 10.1016/s0008-6363(03)00319-5. [DOI] [PubMed] [Google Scholar]
- 105.Smith GD, Phillips AN. Inflation in epidemiology: “The proof and measurement of association between two things” revisited. Brit Med J. 1996;312:1659–61. doi: 10.1136/bmj.312.7047.1659. [DOI] [PMC free article] [PubMed] [Google Scholar]
- 106.Smetana P, Batchvarov V, Hnatkova K, Camm AJ, Malik M. Circadian rhythm of the corrected QT interval: Impact of different heart rate correction models. Pacing Clin Electrophysiol. 2003;26:383–6. doi: 10.1046/j.1460-9592.2003.00054.x. [DOI] [PubMed] [Google Scholar]
- 107.Bazett HC. An analysis of the time-relationships of electrocardiograms. Heart. 1920;7:353. [Google Scholar]
- 108.Montanez A, Ruskin JN, Hebert PR, Lamas GA, Hennekens CH. Prolonged QTc interval and risk of mortality in the general population: a qualitative overview of the prospective cohort studies. Arch Int Med 2003; in press. [DOI] [PubMed]
- 109.Laughren, Thomas; Gordon, Maryann. FDA background on Zeldox(TM) (ziprasidone hydrochloride capsules) Pfizer, Inc. [Web Page]; http://www.fda.gov/ohrms/dockets/ac/00/backgrd/3619b1b.pdf [Accessed 2 Mar 2003].
- 110.Dumaine R, Roy ML, Brown AM. Blockade of HERG and Kv1.5 by ketoconazole. J Pharmacol Exp Ther. 1998;286:727–35. [PubMed] [Google Scholar]
- 111.Tomaselli GF, Marban E. Electrophysiological remodeling in hypertrophy and heart failure. Cardiovasc Res. 1999;42:270–83. doi: 10.1016/s0008-6363(99)00017-6. [DOI] [PubMed] [Google Scholar]
- 112.Zareba W, Moss AJ, Schwartz PJ, Vincent GM, Robinson JL, Priori SG, Benhorin J, Locati EH, Towbin JA, Keating MT, Lehmann MH, Hall WJ. Influence of genotype on the clinical course of the long-QT syndrome. International Long-QT Syndrome Registry Research Group. N Engl J Med. 1998;339:960–5. doi: 10.1056/NEJM199810013391404. [DOI] [PubMed] [Google Scholar]
- 113.Abernethy DR, Barbey JT, Franc J, Brown KS, Feirrera I, Ford N, Salazar DE. Loratadine and terfenadine interaction with nefazodone: Both antihistamines are associated with QTc prolongation. Clin Pharmacol Ther. 2001;69:96–103. doi: 10.1067/mcp.2001.114230. [DOI] [PubMed] [Google Scholar]
- 114.Ohnishi K, Satoh H, Ohno R. Prolongation of the QT interval and ventricular tachycardia in patients treated with arsenic trioxide for acute promyelocytic leukemia. Ann Intern Med. 2001;135:881–5. doi: 10.7326/0003-4819-133-11-200012050-00012. [DOI] [PubMed] [Google Scholar]
- 115.Huan SY, Yang CH, Chen YC. Arsenic trioxide therapy for relapsed acute promyelocytic leukemia: an useful salvage therapy. Leuk Lymphoma. 2000;38:283–93. doi: 10.3109/10428190009087019. [DOI] [PubMed] [Google Scholar]
- 116.Barbey JT. Cardiac toxicity of arsenic trioxide. Blood. 2001;98:1632–4. doi: 10.1182/blood.v98.5.1632. [DOI] [PubMed] [Google Scholar]
- 117.Soignet SL, Maslak P, Wang ZG, Jhanwar S, Calleja E, Dardashti LJ, Corso D, DeBlasio A, Gabrilove J, Scheinberg DA, Pandolfi PP, Warrell RP., Jr Complete remission after treatment of acute promyelocytic leukemia with arsenic trioxide. N Engl J Med. 1998;339:1341–8. doi: 10.1056/NEJM199811053391901. [DOI] [PubMed] [Google Scholar]
- 118.McNeil BJ, Weichselbaum R, Pauker SG. Speech and survival: tradeoffs between quality and quantity of life in laryngeal cancer. N Engl J Med. 1981;305:982–7. doi: 10.1056/NEJM198110223051704. [DOI] [PubMed] [Google Scholar]
- 119.US Preventive Services Task Force. Postmenopausal hormone replacement therapy for primary prevention of chronic conditions: recommendations and rationale. Ann Intern Med. 2002;137:834–9. doi: 10.7326/0003-4819-137-10-200211190-00013. [DOI] [PubMed] [Google Scholar]
- 120.Lotronex Tablets (alosetron hydrochloride): Questions and Answers. [Web Page]; http://www.fda.gov/cder/drug/infopage/lotronex/lotronex-qa_0602.htm [Accessed 16 Feb 2003].
- 121.Schulze-Bahr E, Haverkamp W, Hordt M. A genetic basis for quinidine-induced (acquired) long QT syndrome. Eur Heart J. 1997;18 Abstract Suppl 29. (abstract) [Google Scholar]
- 122.Yang P, Kanki H, Drolet B, Yang T, Wei J, Viswanathan PC, Hohnloser SH, Shimizu W, Schwartz PJ, Stanton M, Murray KT, Norris K, George AL, Jr, Roden DM. Allelic variants in long-QT disease genes in patients with drug-associated torsades de pointes. Circulation. 2002;105:1943–8. doi: 10.1161/01.cir.0000014448.19052.4c. [DOI] [PubMed] [Google Scholar]
- 123.Napolitano C, Schwartz PJ, Brown AM, Ronchetti E, Bianchi L, Pinnavaia A, Acquaro G, Priori SG. Evidence for a cardiac ion channel mutation underlying drug-induced QT prolongation and life-threatening arrhythmias. JCardiovasc Electrophysiol. 2000;11:691–6. doi: 10.1111/j.1540-8167.2000.tb00033.x. [DOI] [PubMed] [Google Scholar]
- 124.Donger C, Denjoy I, Berthet M, Neyroud N, Cruaud C, Bennaceur M, Chivoret G, Schwartz K, Coumel P, Guicheney P. KVLQT1 C-terminal missense mutation causes a forme fruste long-QT syndrome. Circulation. 1997;96:2778–81. doi: 10.1161/01.cir.96.9.2778. [DOI] [PubMed] [Google Scholar]
- 125.Piippo K, Holmstrom S, Swan H, Viitasalo M, Raatikka M, Toivonen L, Kontula K. Effect of the antimalarial drug halofantrine in the long QT syndrome due to a mutation of the cardiac sodium channel gene SCN5A. Am J Cardiol. 2001;87:909–11. doi: 10.1016/s0002-9149(00)01538-1. [DOI] [PubMed] [Google Scholar]
- 126.Makita N, Horie M, Nakamura T, Ai T, Sasaki K, Yokoi H, Sakurai M, Sakuma I, Otani H, Sawa H, Kitabatake A. Drug-induced long-QT syndrome associated with a subclinical SCN5A mutation. Circulation. 2002;106:1269–74. doi: 10.1161/01.cir.0000027139.42087.b6. [DOI] [PubMed] [Google Scholar]
- 127.Verduyn SC, Vos MA, van der Zande J, Kulcsar A, Wellens HJ. Further observations to elucidate the role of interventricular dispersion of repolarization and early afterdepolarizations in the genesis of acquired torsade de pointes arrhythmias: a comparison between almokalant and d-sotalol using the dog as its own control. J Am Coll Cardiol. 1997;30:1575–84. doi: 10.1016/s0735-1097(97)00333-1. [DOI] [PubMed] [Google Scholar]
- 128.Van Opstal JM, Leunissen JD, Wellens HJ, Vos MA. Azimilide and dofetilide produce similar electrophysiological and proarrhythmic effects in a canine model of Torsade de Pointes arrhythmias. Eur J Pharmacol. 2001;412:67–76. doi: 10.1016/s0014-2999(00)00943-2. [DOI] [PubMed] [Google Scholar]
- 129.Verduyn SC, Vos MA, van der Zande J, van der Hulst FF, Wellens HJ. Role of interventricular dispersion of repolarization in acquired torsade-de-pointes arrhythmias: reversal by magnesium. Cardiovasc Res. 1997;34:453–63. doi: 10.1016/s0008-6363(97)00067-9. [DOI] [PubMed] [Google Scholar]
- 130.Fridericia LS. Die Systolendauer im Elektrokardiogramm bei normalen Menschen und bei Herzkranken. Acta Med Scand. 1920;53:469–86. [Google Scholar]
- 131.Mayeda I. On time relation between systolic duration of heart and pulse rate. Acta Scholae Med Univ Imp Kyoto. 1934;17:53. [Google Scholar]
- 132.Boudoulas H, Geleris P, Lewis RP, Rittgers SE. Linear relationship between electrical systole, mechanical systole, and heart rate. Chest. 1981;80:613–7. doi: 10.1378/chest.80.5.613. [DOI] [PubMed] [Google Scholar]
- 133.Yoshinaga M, Tomari T, Aihoshi S, Kawashita T, Nishi J, Tanaka Y, Takezaki T, Kono Y, Yuasa Y, Nakamura M. Exponential correction of QT interval to minimize the effect of the heart rate in children. Jpn Circ J. 1993;57:102–8. doi: 10.1253/jcj.57.102. [DOI] [PubMed] [Google Scholar]
- 134.Hodges M. Rate correction of the QT interval. Cardiac Electrophysiology Review. 1997;1:360–3. [Google Scholar]
- 135.Yan GX, Antzelevitch C. Cellular basis for the normal T wave and the electrocardiographic manifestations of the long QT syndrome. Circulation. 1998;98:1928–36. doi: 10.1161/01.cir.98.18.1928. [DOI] [PubMed] [Google Scholar]
- 136.Yan GX, Shimizu W, Antzelevitch C. The characteristics and distribution of M cells in arterially-perfused canine left ventricular wedge preparations. Circulation. 1998;98:1921–7. doi: 10.1161/01.cir.98.18.1921. [DOI] [PubMed] [Google Scholar]