

Summary
Mitochondrial Complex II (succinate:ubiquinone oxidoreductase) is purified in a partially innactivated state, which can be activated by removal of tightly bound oxaloacetate (Kearney, E. B. et al. Biochem Biophys Res Commun 49, 1115–1121). We crystallized Complex II in the presence of oxaloacetate or with the endogenous inhibitor bound. The structure showed a ligand essentially identical to the “malate-like intermediate” found in Shewanella Flavocytochrome c crystallized with fumarate (Taylor, P. et al. Nat Struct Biol 6, 1108–1112.) Crystallization of Complex II in the presence of excess fumarate also gave the malate-like intermediate or a mixture of that and fumarate at the active site. In order to more conveniently monitor the occupation state of the dicarboxylate site, we are developing a library of UV/Vis spectral effects induced by binding different ligands to the site. Treatment with fumarate results in rapid development of the fumarate difference spectrum and then a very slow conversion into a species spectrally similar to the OAA-liganded complex. Complex II is known to be capable of oxidizing malate to the enol form of oxaloacetate (Belikova, Y. O. et al. Biochim Biophys Acta 936, 1–9). The observations above suggest it may also be capable of interconverting fumarate and malate. It may be useful for understanding the mechanism and regulation of the enzyme to identify the malate-like intermediate and its pathway of formation from oxaloacetate or fumarate.
Keywords: membrane protein, protein crystallography, x-ray structure, electron transport, redox enzyme, succinate dehydrogenase
Introduction
Complex II catalyzes one step of the Krebs tricarboxyllic acid cycle, oxidation of succinate to fumarate. This step is unique, among the oxidative steps of the Krebs cycle, in coupling the oxidation to the ubiquinone pool rather than NAD/NADH, and the reason for this is clear if one examines the redox midpoint potentials of the Krebs cycle reactions. The succinate/fumarate couple has a midpoint potential around +25 mv at pH 7, much higher than that of the NADH/NAD+ couple and thus incapable of reducing the latter under normal conditions or at a kinetically competent rate. The other three oxidations of the Krebs cycle have considerably more reducing power: the weakest being the malate/oxaloacetate couple (Em7 = −166 mv). Thus the unique status of complex II, as the only member of the Krebs cycle that is membrane bound and part of the respiratory chain, can be seen as an adaptation to let this weakest step of the cycle make a smaller energetic contribution by bypassing Complex I and coupling site 1. Presumably a pre-existing membrane-bound quinol:fumarate reductase, which served as a terminal oxidase in the pre-aerobic world, was recruited to perform this function in some early aerobic organism, and has been tailored by evolution for its new role by development of a new quinone binding site and the “tunnel diode” effect[1] which inhibits the activity when the Q pool is highly reduced to prevents reversal of the reaction. Covalently attachment of FAD, which raises its potential and allows efficient oxidation of succinate [2] was an essential step in evolution of Complex II but may have occurred earlier as an adaptaion to menaquinone oxidation, because quinone-coupled fumarate reductases share this feature. Soluble fumarate reductases such as flavocytochrome c (FCc, see below) and aspartate oxidase have noncovalently bound FAD.
Early investigators of Complex II found that, in submitochondrial particles, purified Complex II, or soluble succinate dehydrogenase preparations, the enzyme was in a relatively inactivated state. Various seemingly unrelated treatments were developed to bring it to a higher, constant level of activity [3]. Later it was realized that all of these treatments resulted in removal of tightly bound oxaloacetate (OAA) in parallel with activation of the dehydrogenase [4]. Both activation and OAA removal show a high activation energy, proceeding at a negligible rate at 4°C and on a time scale of tens of minutes at room temperature.
OAA binds as a classical competitive inhibitor, with a dissociation constant that can be calculated from the ratio of on and off rate constants [5]. However due to the extremely low dissociation rate (~.02 min−1 [5]) it does not equilibrate on the time-scale of the initial-rate measurements used in classic Michaelis-Menton kinetic studies, and appears more like an noncompetitive inhibitor on this time scale. If the SDH assay is carried out at 20°C or above, gradual activation of the OAA-inhibited enzyme by succinate results in accelerating rates during the course of the assay, making it clear that the initial rate does not reflect the full activity of the enzyme.
The physiological significance of this inhibition by OAA is not clear (at least to the present authors), however it is to be noted that OAA is the end product and the initial substrate of the Krebs cycle, and would be expected to accumulate under conditions where the supply of reduced two-carbon units to acetyl CoA from glycolysis or fatty acid metabolism is interrupted. This may be prevented by its extremely low Kd inhibition of Complex II, involved in its production. The competitive nature of the inhibition allows high concentration of succinate to overcome the inhibition, however the relative affinity of the oxidized enzyme for succinate is ~600 times lower than that for OAA [5].
It has been clearly shown. [6–8] that in addition to oxidizing succinate, Complex II also oxidizes D- or L- malate to (the enol form of) OAA. While this may not seem particularly surprising in light of the structural similarity between succinate and malate or fumarate and enol-OAA, it raises a number of interesting points.
First there is the question of an energetic leak: malate oxidation is normally coupled to the NADH pool by malate dehydrogenase (MDH). The futile cycle that would be expected to result from simultaneous operation of both enzymes becomes irrelevant in light of the low rate of malate oxidation by Complex II- about 8 min−1 at best with L-malate[8], and that under non-physiological conditions.
Another consequence of malate oxidation by complex II, together with the fact that the product OAA is an inhibitor with an extremely low off-rate, is that malate is a suicide inhibitor of complex II. The highly exergonic oxidation of malate by ubiquinone contributes to the driving force for loading the enzyme with OAA despite the low rate. Surprisingly, the Complex-II-catalyzed MDH reaction runs for several turnovers at a rate higher than the dissociation rate of tightly bound OAA. This suggests that the form of the enzyme with tightly-bound OAA is different from the initial product complex from malate oxidation[8]. This seems not to be a matter of tautomerization, as the enol form of OAA which is produced by malate oxidation is the form which most rapidly inhibits succinate oxidation[8].
Crystallographic studies of Complex II have lagged behind those of complexes III and IV. This may seem surprising in that the bottleneck in these studies is preparation of suitable crystals, and it would be expected that Complex II, with a greater proportion of mass in the water-exposed subunits 1 and 2 relative to transmembrane region (subunits 3 and 4) would be relatively easy to crystallize. It may be that the monotopic nature of the protein, with hydrophilic surface on only one side of the membrane, impedes crystallization.
In 1999, the first X-ray structures became available for a number of fumarate reductase (FRD) enzymes with dicarboxylate sites homologous to that of Complex II. The FRD's of E. coli[9] and of Wollinella succinogenes[10] have flavoprotein and iron-protein subunits homologous to those of complex II, and like Complex II have membrane-anchor subunit(s) containing quinone redox sites. The quinone-oxidizing sites of the membrane-bound FRD's is not related to the quinone reduction site of Complex II, involving (at least in the case of the E. coli enzyme) different ligands on different transmembrane helices and a different section of the iron-sulfur protein. On the other hand the flavoprotein and the dicarboxylate site are clearly homologous.
The flavocytochrome c FRD (FCc) of Shewanella [11, 12] is a soluble protein with a single subunit and fumarate reductase activity. Despite being coupled to a cytochrome domain instead of an iron-sulfur protein, the dicarboxylate binding domain of FCc is clearly homologous to that of complex II, and was well ordered in the crystals.
These structures provided the first clear picture of the loaded dicarboxylate binding site. Interestingly, in one of the highest resolution crystals, grown in the presence of fumarate, the active site contained not fumarate but a “malate-like intermediate” which the authors proposed was formed by slow enzymatic hydration of fumarate by FCc[12]. It was suggested by Ackrell[2] that the nature of this intermediate may have a bearing on the extremely tight binding of OAA to mitochondrial Complex II.
The first structure of a “true” Complex II (i.e. succinate ubiquinol oxidoreductase, E.C.1.3.5.1) was not the mitochondrial complex but that of E. coli [13]. The region around the dicarboxylate site, whose ligand was modeled as OAA, was for the most part similar to that in FCc, however the proposed catalytic arginine (R286 in E. coli) was poorly ordered and was modeled in an unusual rotamer with the guanidino group turned away from the active site and toward Glu255. In 2005 – 2006, structures became available for the porcine[14] and avian[15, 16] mitochondrial Complex II. The porcine model had no ligand in the dicarboxylate site, and the catalytic arginine was modeled as in the E. coli structure. However our avian structure was striking in that the dicarboxylate site region superimposed very accurately on that of the Shewanella FCc, including the malate-like ligand. For purposes of discussion in this paper, we refer to this “malate-like ligand” as TEO, the 3-letter ligand ID assigned to it in the PDB. The identity of that ligand is the main subject of ongoing studies of which this paper is a preliminary report.
The possibility that the same “malate-like intermediate” TEO can be obtained starting from fumarate or OAA (and presumably from succinate or malate), and the implications for the catalytic capabilities of the site, are intriguing. Now we have refined a higher-resolution structure (2H88, including data up to 1.74 Å) to obtain an accurate model of the ligand for identification and comparison with that obtained from fumarate in FCc. We also present here the structure of the malonate-bound complex (2H89). Attempts to prepare the fumarate-bound complex resulted in the malate-like intermediate or a mixture of that and fumarate. In addition, we are studying the UV-visible spectral changes in the enzyme occurring upon binding of different ligands, including slow changes taking place after binding, to monitor the contents of the site. Preliminary basis spectra from these studies are presented here.
Materials and Methods
Chicken Complex II was purified and crystallized as described[15]. The enzyme concentration was determined from the dithionite-reduced spectrum using the approximate extinction coefficient of 16.8 mM−1 at 560–542 for the reduced protein [15]. Routinely no attempt was made to adjust the redox state or remove endogenous OAA, and the crystal structure as well as spectral experiments to be described below show that the dicarboxylate site is occupied. Protein purification and crystal growth were carried out at 4°C where the rate of OAA dissociation is extremely slow, however the crystallization setups were done at room temperature, taking about 10 min per tray.
Within either crystal form, crystals were quite isomorphous. This permitted new structures to be solved by rigid-body refinement of the best previous structure of that form against the new data, followed by introduction of any new ligand, and B-factor and positional refinement interspersed with examination and manual rebuilding. In the case of the type 2 (P21, pseudo-orthorhombic) crystals, it was necessary to make a consistent choice of two non-equivalent possibilities for indexing in order for rigid-body refinement to work, as the lattice has higher symmetry than the unit cell contents.
The malonate-loaded crystal was obtained by co-crystallization: 200 μl of 0.42 mM Complex II (in 20 mM TrisHCl pH 7.5, 0.5 mM EDTA, and 10 g/L octyl glucoside) was treated with 2 μl of 0.1 M disodium malonate for a final concentration of 1 mM and stoichiometric ratio of 2.4 to 1. Then 15 μl aliquots of this were mixed with 15 μl of the precipitant and 1 μl of the additive described[15] to give final concentrations of 0.21 mM protein, 10 g/l (34 mM) octyl glucoside, 50 mM HEPES pH 7.5, 10 mM TrisHCl pH 7.5, 1.3 mM MgCl2, 1.6 mM MnCl2, 50 g/l PEG 3350, 15 ml/L PEG 400, 25 ml/L isopropanol, 1.5 mM NaN3, and 0.25 mM EDTA; and equilibrated against the precipitant by vapor diffusion in the sitting drop format. One of the resulting type 1 crystals was used to collect a dataset to 2.4 Å on beamline 5.0.2 at the Advanced Light Source (ALS), Berkeley CA.
The highest resolution structure containing TEO was obtained in an unsuccessful attempt to ensure complete replacement of the endogenous OAA by fumarate. A two-step exchange was carried out: First the protein was treated with 2 mM malonate at room temperature for about three hours to displace OAA, then it was centrifuged through a glycerol density gradient, as in the purification procedure[15] except that the gradient contained 5 mM fumarate. The gradient was fractionated, fractions containing Complex II were pooled, and a sample was saved at this stage for spectral analysis. A portion of the remainder was concentrated and exchanged into the usual buffer for crystallization, except that 5 mM fumarate was present. Crystallization was as above. Type 1 crystals formed and some were frozen 30 days after setup. A diffraction data set was collected and the structure solved to 2.4 Å from one of these. Later type 2 crystals formed, apparently at the expense of the type 1 crystals, in most of the wells. As part of another experiment, some of the wells were treated with short-chain ubiquinone analogs Q1 or Q2 on day 49. It was not noted at the time, but presumably type 2 crystals were already present at this time. Type 2 crystals were frozen at day 54 and 61 after setup, and three of these yielded high resolution (<2.0 Å) datasets. The one selected for refinement and deposition to illustrate the TEO ligand (as 2H88) was from a well treated with Q2, however there is no indication from density at the Q site that Q2 bound there. The dataset was collected at beamline 5.0.2 at the ALS.
UV-Visible spectra were recorded with an Aminco DW2 dual wavelength spectreophotometer, refurbished and equiped for aquisition of digital spectra by OLIS inc., operated in single wavelength, split beam mode. Preliminary standard reference spectra for the unliganded enzyme and for the spectral changes induced by OAA, fumarate, malonate, and 3-nitropropionic acid were obtained as described in Results. Experimental spectra were fit to a linear combination of basis spectra as described [17], using wavelength points at 0.1 or 0.2 nm intervals in the range 360 – 700 nm. In order to allow for baseline drift, two additional spectra consisting of a constant offset and a slanted line were always included in the fitting basis set. In some cases the derivative of the unliganded enzyme spectrum was also included to allow a first-order Taylor's-series correction for slight wavelength miscalibration.
To see the temperature dependence of the OAA dissociation, the cuvet chamber was warmed or chilled with circulating water from a thermostatted water bath. The temperature recorded was that in the water bath, and it is possible that the cuvet reached a temperature a few degrees less extreme at the hottest and coldest temperatures, so this preliminary experiment should not be taken as an accurate determination of the activation energy but rather as evidence for a large temperature dependence.
For recording spectra, Complex II was diluted in a buffer (Buffer A) consisting of 20 mM Na-MOPS pH 7.5, 100 mM NaCl, 0.5 mM Na-EDTA, and 0.1 g/L dodecyl maltoside; supplemented as indicated. Glutamic-oxalacetic transaminase was Type 1, Ammonium Sulfate suspension, from Sigma-Aldrich Research. L-glutamate, L-aspartate, L-malate, fumarate, succinate, and malonate were also obtained from Sigma-Aldrich Research. Other chemicals were obtained from the same source or from Amresco.
Results
A high-resolution structure of the “malate-like intermediate”
As reported [16] crystals of avian complex II from preparations either containing the endogenous inhibitor or treated with OAA both appear to have a ligand in the dicarboxylate site identical to the “malate-like intermediate” TEO seen in high-resolution structures of the Shewanella frigidimarina Fcc FRD [12]. Now we have collected data from two TEO-containing crystals diffracting to 1.7 Å, although due to constraints of detector geometry the data is complete to only 1.9 Å. The structure has has now been refined to a Free R-factor of 20.9 (Table 1) against one of these datasets and is being deposited in the PDB with ID (2H88).
Table 1.
Data processing and refinement statistics for structure 2H88, with TEO at the active site, and 2H89, with malonate.
| PDB ID code | 2H88 | 2H89 |
|---|---|---|
| Ligand modeled | TEO1 | malonate |
| Space Group | P21 | P212121 |
| Cell parameters | 120.1 199.4 68.0 90 90.00 90 70.5 | 84.0 291.6 90 90 90 |
| Resolution range | 45 – 1.74 Å | 50.68 – 2.4 Å |
| (last shell) | (1.70–1.74) | (2.40 – 2.46) |
| Completeness | 87.0% (38.8%) | 85.4% ( 43.8%) |
| # Reflections | 304101 (8542) | 58846 (1881) |
| Cryst. R Value | 0.181 (0.348) | 0.230 (0.38) |
| Free R Value | 0.209 (0.354) | 0.286 (0.44) |
| B Values (Å2): | ||
| From Wilson Plot | 23.8 Å2 | 51.8 Å2 |
| Mean atomic B Val | 32.4 Å2 | 61.7 Å2 |
| RMS Deviations from Ideality (Å): | ||
| Bond Lengths | 0.024 Å | 0.012 Å |
| Bond Angles | 2.0° | 1.6° |
| Dihedral Angles | 22.7° | 22.2° |
| Improper Angles | 1.30° | 0.92° |
TEO- malate-like intermediate described in the Shewanella FCc active site[12].
A stereo illustration of the overall structure is shown in the upper panel of Figure 1, made with coordinates from 2H88. The head group of ubiquinone, which appears not to be present in 2H88, was modeled in for the purpose of this illustration based on structures 1NEK (E. coli Complex II [13]) and on the binding of carboxin in structure 2FBW [16].
Figure 1. Overall view of Complex II, detail of dicarboxylate site.
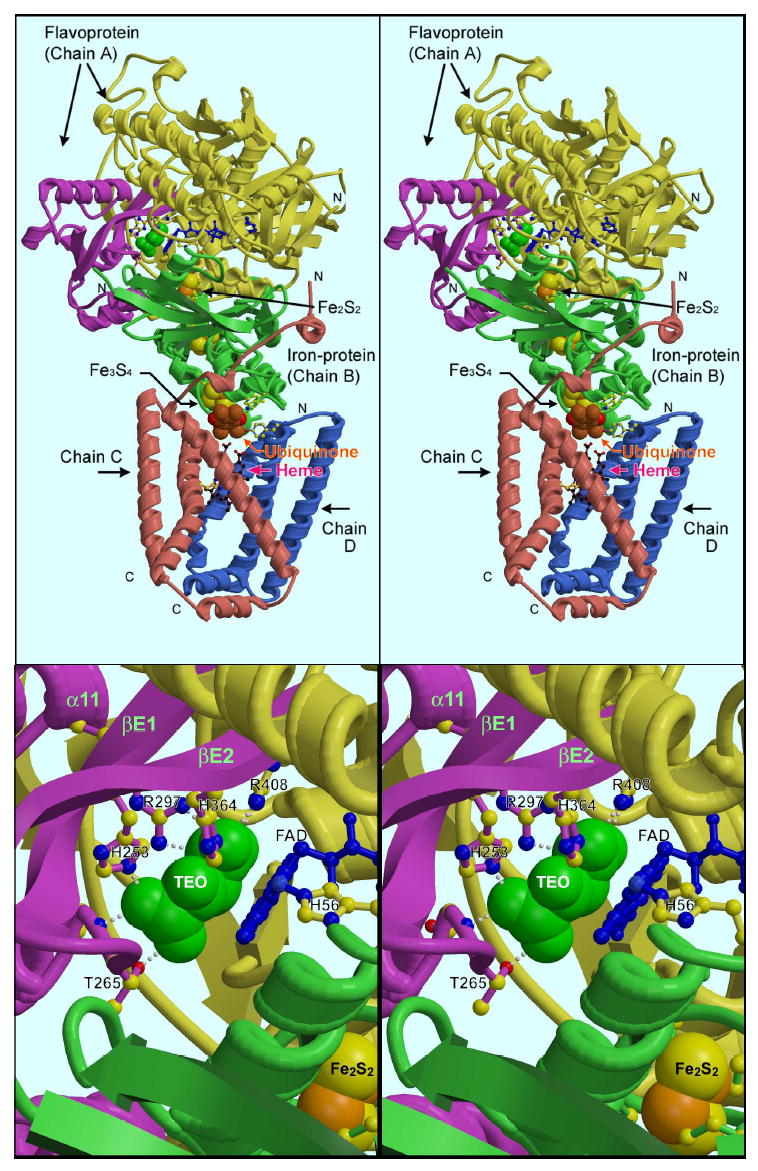
The dicarboxylate site, represented by a green space-filling model of the “malate-like ligand” found in the oxaloacetate-inhibited complex, is in the flavoprotein subunit between the CAP domain (magenta) and the rest of the flavoprotein (yellow). The region around the dicarboxylate site is expanded in the lower panel, and key residues involved in binding TEO are labeled. Returning to the overall structure (upper panel), a series of three iron-sulfur clusters transfers electrons between Flavin (blue) at the dicarboxylate site and the quinone binding site (brown ubiquinone headgroup, labeled). The coordinates are from structure 2H88, except for ubiquinone, which was modeled in for the purpose of this illustration based on structures 1NEK (E. coli Complex II) and on the binding of carboxin in structure 2FBW.
The region around the dicarboxylate binding site, which is the main focus of this report, is enlarged in the same orientation in the lower panel of Figure 1, which can be used to orient the more detailed depictions of Figures 3 and 4 in the overall structure. The ligand, shown as a green space-filling model of TEO, is sandwiched between FAD (blue ball-and-stick) and the CAP domain of the protein, shown in magenta. The neck by which the CAP domain is attached to the rest of the flavoprotein is a pair of long, twisted strands (strands 1 and 2 of sheet E in the PDB secondary structure assignment), also shown in magenta. Histidines 253 and 364 from these strands hydrogen-bond the ligand, as do Thr265 (from the turn between the strand E1 and the first helix of the CAP domain) and Arg297 (from the proximal end of the long helix α11 of the CAP domain). Arg408 from the FAD domain can also be seen H-bonding to TEO on the upper right.
Figure 3. Stereo view of the malate-like ligand in the new high resolution structure.

Note how the C1 carboxylate is twisted out of the plane of the rest of the molecule which lies flat against the FAD isoalloxazine ring. Upper panel: The coordinates from structure 2H88 (monomer 1) are shown together with a 2Fo-Fc map from that structure contoured at 1.7 σ. The view is from the direction of His 364 which has been removed, together with its H-bond to the C2 oxygen. Arg 297 and Arg408 are labeled. His253 can be seen H-bonding TEO from the top. To the left are the backbone N of Glu266 (upper left), Oγ of Thr265, and the backbone N of Gly62. One more H-bond from the backbone N of Ala411 to the carboxylate on the right is not shown. Lower panel: The coordinates of 2H88 (elemental colors) are superimposed on the same region in the Shewanella FCc structure 1QJD (pastel blue) based on aligning 59 Cα atoms in 8 stretches of the FAD and CAP domains of the flavoproteins (rmsd 0.39 Å). Note the general similarity and the close superpositioning of the ligands.
Figure 4.

Stereo view of malonate in the dicarboxylate site of complex II. The protein was crystallized in the presence of malonate. as described in Materials and Methods. Coordinates and 2Fo-Fc map from the structure deposited as 2H89. The view is nearly the same as in Figure 3.
Figure 2 shows the excellent density and clear resolution of the irons and sulfurs in the Fe3S4 cluster of center 3, which are separated by about 2.2 Å. In a similar map made with the model and coordinates of 2FBW, the sulfur atoms appeared as unresolved shoulders on the sides of the iron peaks. Complex II contains one heme moiety (Cytochrome bII, labeled “heme” in Figure 1) with ligation by His98 of chain C and His46 of chain D in the membrane anchor domain. Since there had been some indication from previous structures[14, 16] that the heme axial-ligand bond lengths were unusually long, this distance restraint was dropped during one cycle of refinement (not shown) resulting in bond lengths ranging from 1.99 to 2.04; not significantly different from 2.00 as in many other heme proteins.
Figure 2. Atomic resolution for atoms of the Fe3S4 cluster in structure 2H88.

The 2Fo-Fc map is contoured at 15 σ (magenta) to show the iron atoms, and at 6 σ (cyan) to show the sulfurs as well. The irons and sulfurs, separated by about 2.2 Å, are well resolved in this structure.
Figure 3 shows, in the top panel, a stereo view of the structure around the dicarboxylate site, with the 2Fo-Fc electron density map superimposed. As described at lower resolution for structure 2FBW [16], the ligand lies flat on the plane of the FAD isoalloxazine ring, held in place by numerous H-bonds, but with the C1 carboxylate which extends beyond the edge of the ring twisted about 60° out of the plane of the rest of the molecule.
The binding pocket for dicarboxylate seen in 2H88 (and other structures with closed CAP domain) is extremely tight, with the volume scarcely exceeding the Van-der-Waals surface of the atoms of the ligand (not shown). There are no water molecules directly in the pocket. The closest water to TEO is 6A away and on the other side of the backbone N of Glu266 (the H-bonded backbone N in the upper left corner of Figure 2). On the other side of the Glu266 side chain (not shown) is a string of H-bonded waters, interacting with Arg269, Asp407, and Asn251; and in fact most of the FP is well hydrated except the region around TEO and the FAD isoalloxazine ring. The high-resolution structure of Shewanella FCc E378D mutant 2B7R [18] also has no waters in the dicarboxylate site, suggesting that if fumarate can be hydrated to TEO as suggested [12], the process must involve a transient, infrequent, obstructed diffusion of water into the site to take part in the reaction. Transient opening of the CAP domain might facilitate water entry.
The lower panel of Figure 3 compares the dicarboxylate site of our structure with that of that of Shewanella FCc (PDB ID 1QJD). The structures are superimposed in such a way as to minimize the RMS deviation between the protein backbone in highly conserved regions surrounding the active site. Although the ligands themselves were not used in the structural alignment, their superposition is nearly perfect, with RMS deviations of 0.25 Å for the 9 atoms and maximum displacement of any atom 0.37 Å.
Since the origin of the ligand in 2H88 is somewhat uncertain, and as described below is likely to be fumarate as in the Shewanella structure (because crystallization of the fumarate-loaded complex was being attempted; see materials and methods), we also compared it with our previous structure 2FBW in which the endogenous inhibitor, presumed to be OAA, is present. After superposing the backbones of the flavoprotein subunits, the 18 atoms of the ligands in both monomers superimposed with RMSD 0.21 Å. The conclusion that the same ligand is present in all three structures seems inescapable, that is, the tightly bound inhibitor in the OAA-inhibited enzyme is the same as the “malate-like intermediate” TEO visualized in fumarate-treated Shewanella FCc FRD.
During the last stages of refinement we reduced the topology restraints for the ligand, maintaining the bond definitions to avoid nonbonded repulsion but setting the energy terms for bond lengths, angles, dihedrals, and impropers to zero, thus effectively refining free atoms against the X-ray data. Non-crystallographic positional restraints were enforced for the atoms of the ligand, as there was no indication of or reason to expect asymmetry between the buried ligands in the two monomers of the non-physiological dimer present in the asymmetric unit.
Bond lengths, angles and dihedral angles for the TEO ligand in each monomer of the new structure and in the Shewanella structure are given in Table 2. This not only confirms the similarity to the FCc structure but may be useful in assigning double vs single bonds and sp2 vs sp3 centers, although an unambiguous determination of such details from the x-ray data would require even higher resolution. Care must be taken in not to over interpret the data. Our current analysis will be described in the discussion.
Table 2.
Approximate bonds and angles for TEO from the structures. For each parameter, three values are given: one from Shewanella structure 1QJD, and one from each monomer of Complex II structure 2H88.
| Bond Lengths: | 1QJD | 2H88a | 2H88b | comment: | ||
|---|---|---|---|---|---|---|
| C1 | O1A | 1.178 | 1.259 | 1.263 | ||
| C1 | O1B | 1.216 | 1.293 | 1.278 | ||
| C2 | O2 | 1.318 | 1.438 | 1.360 | C-OH bond, longer than C=O | |
| C2 | C1 | 1.601 | 1.630 | 1.699 | single bond, no resonance | |
| C3 | C2 | 1.376 | 1.332 | 1.376 | double bond? ene-ol? resonance? | |
| C4 | C3 | 1.369 | 1.504 | 1.492 | ||
| C4 | O4A | 1.323 | 1.258 | 1.262 | ||
| C4 | O4B | 1.487 | 1.282 | 1.301 | ||
| Bond Angles | 1QJD | 2H88a | 2H88b | comment: | |||
|---|---|---|---|---|---|---|---|
| O1A | C1 | O1B | 133.01 | 126.78 | 128.97 | ||
| C2 | C1 | O1B | 108.97 | 109.55 | 107.58 | ||
| C2 | C1 | O1A | 116.51 | 123.55 | 123.45 | ||
| C1 | C2 | O2 | 114.66 | 104.20 | 102.69 | ||
| C3 | C2 | O2 | 131.65 | 142.16 | 148.39 | ||
| C1 | C2 | C3 | 109.09 | 113.47 | 108.86 | ||
| C2 | C3 | C4 | 119.47 | 105.55 | 102.17 | ||
| O4B | C4 | C3 | 120.59 | 125.60 | 127.42 | ||
| O4A | C4 | C3 | 130.80 | 106.21 | 105.38 | ||
| O4A | C4 | O4B | 107.31 | 121.24 | 120.96 | ||
| Dihedral angles: | 1QJD | 2H88a | 2H88b | comment: | ||||
|---|---|---|---|---|---|---|---|---|
| O4B | C4 | C3 | C2 | 1.40 | −179.42 | 177.59 | C3-C4 dihedral | |
| C3 | C2 | C1 | O1A | 89.52 | 57.93 | 61.59 | C1-C2 dihedral, measured to c3 | |
| O2 | C2 | C1 | O1B | 56.23 | 65.31 | 63.13 | C1-C2 dihedral, measured to O2 | |
| Improper dihedral angles: | ||||||||
| C4 | O4A | 04B | C3 | 6.238 | 19.079 | 17.838 | C4 Carboxylate slightly dished? | |
| C2 | C3 | C1 | O2 | 11.648 | −2.271 | −1.232 | C2 Center flat? | |
| C1 | C2 | O1A | O1B | −7.287 | 2.371 | −0.295 | C1 Carbox flat. | |
Binding of malonate in the dicarboxylate site
In contrast to the attempt to prepare the fumarate-loaded complex, crystallization in the presence of malonate gave the expected result. Figure 4 shows the dicarboxylate site of a crystal prepared from malonate-treated Complex II. The resolution (2.4 Å, see Table 1) is not as high as the structure described above, but the density is clearly consistent with a shorter dicarboxylate the size of malonate. One carboxylate of malonate is in essentially the same place as the C1 carboxylate of TEO, bonded to Thr265 and the backbone N of Glu266. the difference in length of the ligands thus puts the other carboxylate somewhat short of the position of the C4 carboxylate of TEO. The difference is accommodated partly by movement of the guanidino group of Arg408 towards the ligand and partly by longer H-bonds to that residue. The catalytic residue Arg297 interacts with this carboxylate and with the central carbon, much as it does with TEO in the OAA-loaded structure.
Malonate was also observed and modeled in the dicarboxylate site of Wolinella succinogenes crystallized in the presence of 10 mM malonate ([19], structure 1E7P) with the cap domain in the closed conformation. The new structure here confirms at higher resolution the general position of that structure and the involvement of residues equivalent to Arg408, His253, His364. The most significant difference is the involvement of the residue equivalent to Arg297, which was disordered, in 1E7P. Refinement at zero occupancy left it rather too far from the ligand to be involved in binding.
Spectroscopic analysis of the state of the dicarboxylate site
It has long been known that binding of OAA and other inhibitors is accompanied by subtle but distinct changes in the spectrum of the enzyme. As an aid in characterizing different batches of the enzyme and in studying binding at the dicarboxylate site, we are obtaining spectra of the changes induced by ligand binding. The OAA effect is taken as the negative of the slow change occurring when OAA is removed from the enzyme by treatment with transaminase and 10 mM L-glutamate as described in the legend to Figure 5. Raw difference spectra from such an experiment are shown in Figure 5a, in which isobestic points suggest a single change is taking place. The dissociation was fit well by a single exponential (Figure 5b), allowing extrapolation to infinite time to obtain the spectrum of the unliganded enzyme. The reaction was repeated at different temperatures and the Arrhenius plot (Figure 5b inset) indicates an activation energy of 25.4 kcal/mol, similar to the value obtained by for activation of SDH by anions and pH[20], but lower than the value (33 kcal/mol) found for activation by substrates or ubiquinol[21]. In one case aspartate and α-ketoglutarate were added to regenerate OAA after stripping was nearly complete, and the immediate spectral change induced by rebinding of OAA was indistinguishable from the slow change observed during dissociation (but with greater extent). The same spectral change was also observed (not shown) on treatment with malate; in fact this treatment yielded the largest OAA-effect spectrum, which we assume corresponds to 100% occupancy with the tightly bound ligand. This is consistent with the observation [7] that addition of malate to activated enzyme leads to inactivation and tightly-bound OAA as assayed by perchlorate extraction. Note that although we refer to this spectral change as the “OAA effect”, the precise nature of the bound ligand in the OAA-inhibited enzyme is still open to question.
Figure 5.

(A)The spectral effect of OAA binding was determined by following the dissociation of OAA from Complex II in the presence of OAA transaminase scavaging system [5]. Complex II was diluted to 1 ml in buffer A supplemented with 10 mM glutamate, and two initial spectra were recorded. Then 1 μl of transaminase was added and scans were recorded repeatedly during the stripping process. The average of the spectra of Complex II before adding transaminase was subtracted from all, and spectra before and at 0, 6.8, 28.6, 43.4, and 66 min after the addition are plotted. Then (not shown) dithionite was added to obtain the fully reduced spectrum from which the enzyme concentration was determined. (B). Time course of dissociation of OAA. A spectrum representative of the OAA-induced change was obtained form the spectra of figure 4a. The experiment of (A) was repeated several times, and one of these experiments, in which the decay was slightly faster, was selected for determining the spectrum of the fully-stripped enzyme. The spectra were fit to a linear combination of spectra of the as-purified Complex II and the OAA-induced change. The resulting amplitude of the OAA effect was plotted against time and fit with a single exponential. The t∞ value obtained from the fit was taken as the amount of the OAA-effect spectrum to subtract from the as-purified spectrum to obtain the spectrum of the fully-stripped enzyme, which was scaled to 1 μM based on the concentration determined from the dithionite-reduced spectrum above. The spectrum of the OAA effect was scaled by assuming the site was fully occupied with OAA in the malate-treated enzyme. The spectra were then re-fit using this normalized OAA effect spectrum and the stripped Complex II spectrum, to obtain the data shown, in which the OAA effect decays toward zero. The resulting value for Complex II concentration was constant at 5.7 μM, and the OAA effect before adding transaminase was 2.4 μM. Inset: The experiment was repeated at different temperatures and the log of the first-order rate constant was plotted against reciprocal temperature to obtain an approximate activation energy of 25.4 kcal/mol (106 kJ/mol).
Spectral effects of malonate, fumarate, and 3-nitropropionic acid were obtained by adding the ligands at appropriate concentrations after nearly all the OAA was remove by transamination. Our current set of standard spectra for the ligand-induced changes is shown in Figure 6. The effects of fumarate, malonate, and 3-nitropropionate are similar but distinguishable, and consistent with a perturbation of the spectrum of oxidized flavin in that they do not extend to longer wavelength than about 550 nm. The similarity of the nitropropionate effect with those of fumarate and malonate suggests that on this time scale (10–20 minutes) simple non-covalent binding takes place, and the covalent modification reported [16] requires longer incubation.
Figure 6.

Difference spectra representing the effects of various ligands on the spectrum of fully oxidized Complex II. Preliminary standard spectra for the spectral effects of OAA, malonate, fumarate, and 3-nitropropioninc acid were determined as described in the text. The magnitude is on an arbitrary scale.
The effect of OAA binding is quite different, and involves significant changes over the wavelength range up to 700 nm, where oxidized flavin has little or no absorbance. This long-wavelength absorbance change suggests a long range structural perturbation that affects the iron-sulfur clusters, or a redox effect involving iron-sulfur clusters or perhaps flavin semiquinone.
Ligand-status of the protein sample from which the crystal yielding the high-resolution TEO structure was prepared
As described above, attempts to replace OAA by fumarate for crystallization led to a structure containing the malate-like intermediate TEO in the dicarboxylate site. A portion of the pooled fractions from the fumarate-containing density gradient was taken and the spectrum recorded with no further treatments to evaluate the effectiveness of fumarate exchange. As Figure 7 shows, this spectrum could be fit well using the spectrum of unliganded complex II, the OAA effect, and the fumarate effect. Of the latter, the OAA effect is much more prominent, being present at a higher level relative to the complex II spectrum than in any of our untreated preparations to date. Only a preparation treated with malate showed a higher level of the OAA effect, presumably due to the highly spontaneous if kinetically limited oxidation of malate to OAA by complex II and any endogenous quinone. The molar extinction scale of the OAA effect has been derived assuming that the malate-treated preparation has 100% OAA occupancy, and applying this scale to the experiment of Figure 7 indicates that 78% of complex II has OAA bound. Similarly the amount of fumarate effect corresponds to 22% of complex II having fumarate bound. The fact that these add up to 100% must be largely fortuitous, given the crude state of our normalization, however it would in fact be expected that nearly all sites would be occupied as the fumarate concentration (5 mM) is well above the Kd.
Figure 7. Spectrum of Complex II after exchange into fumarate for crystallization.
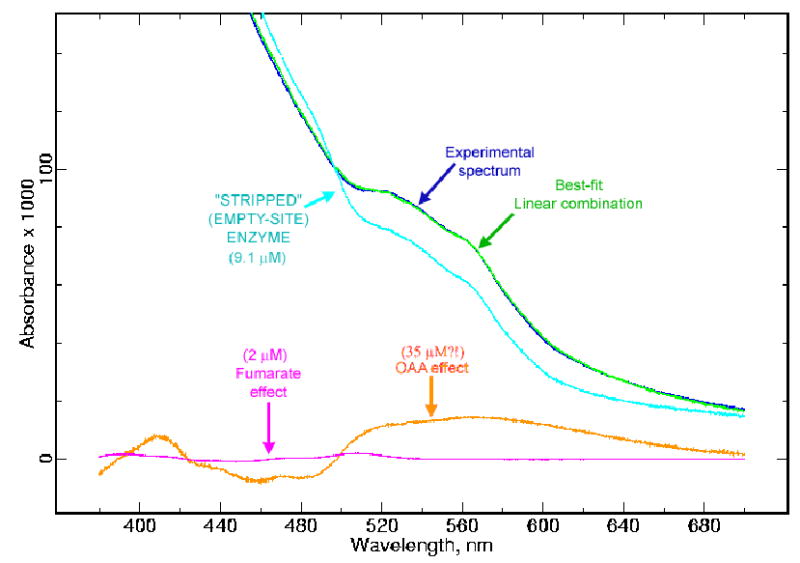
The blue trace is an experimental spectrum of the Complex II preparation from which the crystal leading to the 2H88 structure was grown. It had been treated with malonate at room temperature for 3 hours and sedimented through a gradient containing 5 mM fumarate as described in materials and methods. The green trace is the best fit to the experimental trace using a linear combination of the spectra of Complex II, the fumarate effect, and the OAA effect. The required magnitude of each of these is shown (respectively light blue, magenta, and brown).
Apparent conversion of fumarate to OAA by the Complex II preparation
To test more directly for conversion of fumarate to OAA, a sample of Complex II from a preparation that happened to be relatively depleted in OAA was treated with fumarate and spectra were taken at intervals. The spectra were fit using unliganded complex II and the fumarate and OAA effects from Figure 6. The amount of each required is plotted in Figure 8a as a function of time the spectrum was taken There is a sharp increase in the fumarate effect immediately after addition of fumarate, as expected. However the fumarate effect soon levels off and starts to decrease. The OAA effect was decreasing slightly during this time, perhaps due to re-equilibration after dilution of the enzyme and competition from the fumarate, but starts to increase again after about 20 minutes. The subsequent gradual increase mirrors the decrease in the fumarate effect.
Figure 8. Time course of spectral changes after adding fumarate to Complex II.
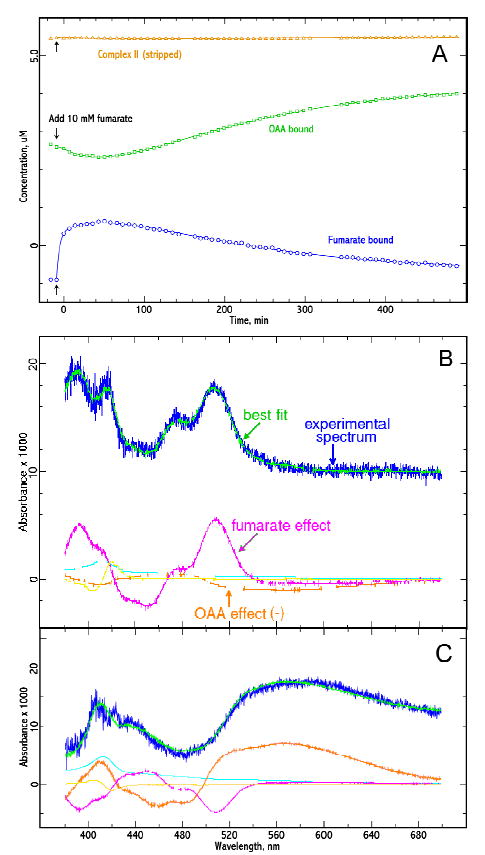
About 5 mM Complex II in buffer a was monitored spectrally before and after addition of 10 mM sodium fumarate. The temperature was 20°C. (A). Time course: Each time point represents one spectrum. Fumarate was added after the second spectrum (arrows). Each spectrum was fit to a linear combination of the empty-site complex, the OAA effect, and the fumarate effect. The amount of each spectrum required to reconstitute the experimental spectrum is plotted against time. Panels B and C show (blue traces) difference spectra: 14 min vs before fumarate (B) and 460 minutes vs 14 min (C). The green curves show the fit to these two spectra and the red and magenta curves show the amount of the OAA and fumarate spectral effects required to fit them. The slow phase (C) consists mainly of disappearance of the fumarate effect and appearance of the OAA effect, suggesting that fumarate is being converted into the tightly-bound ligand of the OAA-inhibited complex.
Difference spectra representative of the fast phase and slow phase are shown in Figure 8B and 8C, together with their composition from the basis spectra. The fast phase consists mainly of fumarate binding, and the slow phase consists of replacement of the fumarate spectral effect by the OAA effect. This appears consistent with the idea that fumarate is being converted to OAA.
Discussion
The experiment of Figure 7, as well as the observation of TEO in 2H88 from material treated with fumarate, suggests that long incubation with fumarate can lead to the same inhibited state of the enzyme as OAA or the endogenous inhibitor. This would explain the observation that after activation by succinate the enzyme eventually returns to a partially inactivated state, whereas activation by malonate is stable for long periods of time. It was reported [7] that fumarate or low concentrations of succinate result in gradual deactivation of the activated enzyme, which was attributed to formation of OAA as a result of fumarase contamination and the MDH activity of complex II. We have not eliminated the possibility that contaminating fumarase is responsible for the apparent conversion we see, but the mechanism proposed by Taylor et al for formation of the malate-like intermediate[12] would also be a reasonable explanation.
If we assume the same tightly bound ligand is present in the inhibited enzyme obtained with fumarate or OAA, the next question is, what is it? Covalently it has the structure of OAA or malate. While we cannot rely too strongly on bond lengths and angles obtained from X-ray diffraction at this resolution, the data of Table 2 can suggest the geometry of the model. The out-of-plane c1 carboxylate and long c1-c2 bond would be consistent with malate or with a distorted OAA in which the conjugation between the keto or enol double bond and the C1 carboxylate has been broken by the torsion. The long bond from C2 to its attached oxygen would be more consistent with -OH as in malate or the enol form of OAA than with a keto group. The short C2–C3 and C3–C4 bonds would be consistent with enol-OAA with the central double bond conjugated with the C4 carboxylate. It would be also consistent with the tautomer of malate depicted in Fig 4b of Taylor et al. [12].
In light of the MDH activity of the complex, and the redox midpoint potential of the malate/OAA couple (~ -166 mv in solution) relative to the Flavin, it would seem that malate could not exist in the binding site with oxidized flavin for long. However it cannot be assumed that the redox potential of the bound malate/OAA couple is the same as in solution. It is quite possible that malate is bound very tightly as Taylor et al.'s tautomer, whereas oxaloacetate is highly destabilized by enforced torsion around the C1–C2 bond, resulting in a much more positive midpoint potential for the bound couple.
The main distinction between malate and OAA is their reduction level. Formation of OAA from fumarate via malate, or removal of malate after conversion to OAA, should involve an oxidation step which would leave two electrons on the enzyme, presumably residing in the high potential ironsulfur centers 1 and 3. While the broad bleaching extending to 700 nm associated with the stripping reaction (Figure 4a) is suggestive of reduction of iron-sulfur centers, the reverse spectrum is obtained on adding OAA to (presumably oxidized) enzyme, in which case it could not be an effect on redox state of the iron-sulfur proteins. Further experiments with electron acceptors (PMS/DCIP) and using transaminase to strip the enzyme after loading from malate or OAA may help resolve the issue.
Although spectral studies indicate our preparation of complex II is less than half loaded with oxalaocetate, the excellent density from the crystals gives no indication of partial occupancy. Assuming occupancy of 1.0, the B-factors are similar to those of the surrounding protein. Alternate refinement of ligand occupancy and B-factors does not lead to decreased occupancy. This suggests that the ligand-bound (OAA or malonate) enzyme may preferentially crystallize in these crystal forms. There is considerable reason to believe [2], other crystal structures have suggested, and the tightly enclosed nature of the bound ligand would seem to make it necessary, that a major conformational change accompanies unbinding of the ligand. However a crosslinking study of the Shewanella FCc failed to demonstrate a requirement for mobility[22].
Our failure so far to obtain crystals of the empty-site or NEM-treated enzyme under these conditions would be consistent with preferential crystallization of the closed, ligand-bound form. Examination of crystal contacts reveals significant involvement of the CAP domain in each monomer of the type 2 crystals, but not in the type one crystal form. Future experiments will be aimed, on one hand, at trying to increase the yield of crystals by loading the enzyme through malate treatment, and on the other, at trying to obtain crystals of the stripped enzyme. It is important to be able to study other conformations crystallographically as well, even if it requires developing new crystal forms.
Acknowledgments
This work was supported by NIH R01 grants GM62563 and DK44842 and was carried out at Lawrence Berkeley National Lab, which is operated by the Department of Energy, contract DE-AC03–76SF00098 to the University of California. Diffraction data were collected at the Advanced Light Source (ALS) at LBNL and at the Stanford Synchrotron Radiation Laboratory, which is operated by the Department of Energy, Office of Basic Energy Sciences. We thank staff at the various beamlines for help and advice in data collection.
Footnotes
Abbreviations used are: OAA, oxaloacetate. MDH, malate dehydrogenase. FCc, flavocytochrome c. TEO, the “malate-like intermediate” found in 1QJD. Complex II, succinate ubiquinone oxidoreductase; E.C. 1.3.5.1. Q1 and Q2, ubiquinol with only 1 or two isoprenoid units in the side-chain. Specific x-ray structures from this and other labs are referred to by their PDB ID codes; literature references if not given are available in the PDB record. The coordinates for the two structures described here have been deposited with the PDB as 2H88 (TEO-containing structure) and 2H89 (malonate-containing structure).
References
- 1.Ackrell BA, Armstrong FA, Cochran B, Sucheta A, Yu T. Classification of fumarate reductases and succinate dehydrogenases based upon their contrasting behaviour in the reduced benzylviologen/fumarate assay. FEBS Lett. 1993;326:92–4. doi: 10.1016/0014-5793(93)81768-u. [DOI] [PubMed] [Google Scholar]
- 2.Ackrell BA. Progress in understanding structure-function relationships in respiratory chain complex II. FEBS Lett. 2000;466:1–5. doi: 10.1016/s0014-5793(99)01749-4. [DOI] [PubMed] [Google Scholar]
- 3.Kearney EB. Studies on succinic dehydrogenase. IV. Activation of the beef heart enzyme. J Biol Chem. 1957;229:363–75. [PubMed] [Google Scholar]
- 4.Kearney EB, Ackrell BA, Mayr M. Tightly bound oxalacetate and the activation of succinate dehydrogenase. Biochem Biophys Res Commun. 1972;49:1115–21. doi: 10.1016/0006-291x(72)90328-2. [DOI] [PubMed] [Google Scholar]
- 5.Kotlyar AB, Vinogradov AD. Interaction of the membrane-bound succinate dehydrogenase with substrate and competitive inhibitors. Biochim Biophys Acta. 1984;784:24–34. doi: 10.1016/0167-4838(84)90168-7. [DOI] [PubMed] [Google Scholar]
- 6.Dervartanian DV, Veeger C. Studies on succinate dehydrogenase. II. On the nature of the reaction of competitive inhibitors and substrates with succinate dehydrogenase. Biochim Biophys Acta. 1965;105:424–36. doi: 10.1016/s0926-6593(65)80228-4. [DOI] [PubMed] [Google Scholar]
- 7.Ackrell BA, Kearney EB, Mayr M. Role of oxalacetate in the regulation of mammalian succinate dehydrogenase. J Biol Chem. 1974;249:2021–7. [PubMed] [Google Scholar]
- 8.Belikova YO, Kotlyar AB, Vinogradov AD. Oxidation of malate by the mitochondrial succinate-ubiquinone reductase. Biochim Biophys Acta. 1988;936:1–9. doi: 10.1016/0005-2728(88)90245-9. [DOI] [PubMed] [Google Scholar]
- 9.Iverson TM, Luna-Chavez C, Cecchini G, Rees DC. Structure of the Escherichia coli fumarate reductase respiratory complex. Science. 1999;284:1961–6. doi: 10.1126/science.284.5422.1961. [DOI] [PubMed] [Google Scholar]
- 10.Lancaster CR, Kroger A, Auer M, Michel H. Structure of fumarate reductase from Wolinella succinogenes at 2.2 A resolution. Nature. 1999;402:377–85. doi: 10.1038/46483. [DOI] [PubMed] [Google Scholar]
- 11.Leys D, Tsapin AS, Nealson KH, Meyer TE, Cusanovich MA, Van Beeumen JJ. Structure and mechanism of the flavocytochrome c fumarate reductase of Shewanella putrefaciens MR-1. Nat Struct Biol. 1999;6:1113–7. doi: 10.1038/70051. [DOI] [PubMed] [Google Scholar]
- 12.Taylor P, Pealing SL, Reid GA, Chapman SK, Walkinshaw MD. Structural and mechanistic mapping of a unique fumarate reductase. Nat Struct Biol. 1999;6:1108–12. doi: 10.1038/70045. [DOI] [PubMed] [Google Scholar]
- 13.Yankovskaya V, Horsefield R, Tornroth S, Luna-Chavez C, Miyoshi H, Leger C, Byrne B, Cecchini G, Iwata S. Architecture of succinate dehydrogenase and reactive oxygen species generation. Science. 2003;299:700–4. doi: 10.1126/science.1079605. [DOI] [PubMed] [Google Scholar]
- 14.Sun F, Huo X, Zhai Y, Wang A, Xu J, Su D, Bartlam M, Rao Z. Crystal Structure of Mitochondrial Respiratory Membrane Protein Complex II. Cell. 2005;121:1043–57. doi: 10.1016/j.cell.2005.05.025. [DOI] [PubMed] [Google Scholar]
- 15.Huang LS, Borders TM, Shen JT, Wang CJ, Berry EA. Crystallization of mitochondrial respiratory complex II from chicken heart: a membrane-protein complex diffracting to 2.0 A. Acta Crystallogr D Biol Crystallogr. 2005;61:380–7. doi: 10.1107/S0907444905000181. [DOI] [PMC free article] [PubMed] [Google Scholar]
- 16.Huang LS, Sun G, Cobessi D, Wang AC, Shen JT, Tung EY, Anderson VE, Berry EA. 3-nitropropionic acid is a suicide inhibitor of mitochondrial respiration that, upon oxidation by complex II, forms a covalent adduct with a catalytic-base arginine in the active site of the enzyme. J Biol Chem. 2006;281:5965–5972. doi: 10.1074/jbc.M511270200. [DOI] [PMC free article] [PubMed] [Google Scholar]
- 17.Sternberg J, Stillo H, Schwendeman R. Spectrophotometric Analysis of Multicomponent Systems Using the Least Squares Method in Matrix Form. Analytical Chemistry. 1960;32:84–90. [Google Scholar]
- 18.Pankhurst KL, Mowat CG, Rothery EL, Hudson JM, Jones AK, Miles CS, Walkinshaw MD, Armstrong FA, Reid GA, Chapman SK. A proton delivery pathway in the soluble fumarate reductase from Shewanella frigidimarina. J Biol Chem. 2006 doi: 10.1074/jbc.M603077200. [DOI] [PubMed] [Google Scholar]
- 19.Lancaster CR, Gross R, Simon J. A third crystal form of Wolinella succinogenes quinol:fumarate reductase reveals domain closure at the site of fumarate reduction. Eur J Biochem. 2001;268:1820–7. [PubMed] [Google Scholar]
- 20.Kearney KB, Ackrell BA, Mayr M, Singer TP. Activation of succinate dehydrogenase by anions and pH. J Biol Chem. 1974;249:2016–20. [PubMed] [Google Scholar]
- 21.Gutman M, Kearney EB, Singer TP. Regulation of succinate dehydrogenase activity by reduced coenzymes Q10. Biochemistry. 1971;10:2726–33. doi: 10.1021/bi00790a011. [DOI] [PubMed] [Google Scholar]
- 22.Rothery EL, Mowat CG, Miles CS, Mott S, Walkinshaw MD, Reid GA, Chapman SK. Probing domain mobility in a flavocytochrome. Biochemistry. 2004;43:4983–9. doi: 10.1021/bi030261w. [DOI] [PubMed] [Google Scholar]