
Figure 7. Signal-specific regulation of NCoR and SUMOylation-dependent transrepression.
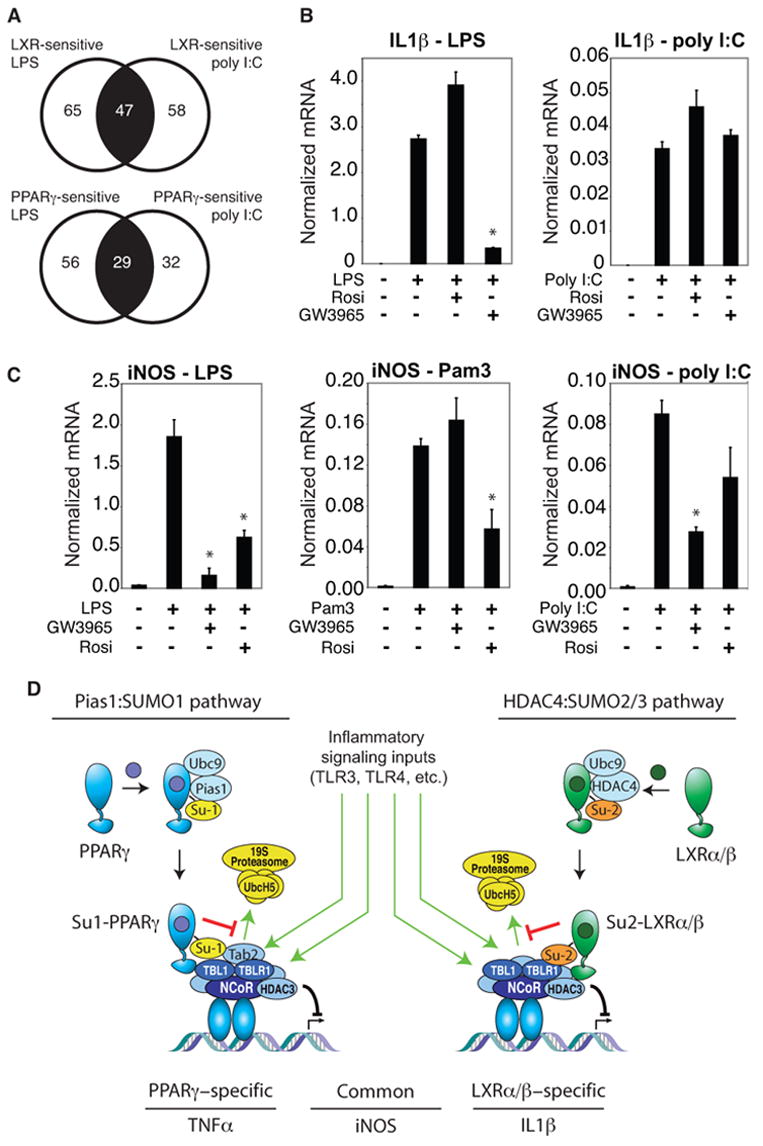
A. Signal-dependence of repression by PPARγ and LXR agonists. Genes in the central sector of each diagram were repressed when induced by either LPS or poly I:C. Genes in the left sector were only repressed when induced by LPS, while genes in the right sector were only repressed when induced by poly I:C. B. The IL-1β gene is induced by both LPS and poly I:C, but is only sensitive to LXR repression when induced by LPS. Primary macrophages were treated with TLR4 specific agonist (LPS,1μg/ml), or TLR3 specific agonist (polyI:C, 50 ng/ml) for 6h with or without PPARγ (Rosiglitazone, 1μM) or LXR ligand (GW3965, 1μM). IL-1β expression was evaluated by QPCR. * p < 0.02 vs LPS. C. Differential transrepression of the iNOS gene by LXR and PPARγ ligands. Primary macrophages were treated with the LPS (1 μg/ml), TLR2-specific agonist (PAM3, 300 ng/ml) or poly I:C (50 ng/ml) for 6h with or without PPARγ (Rosiglitazone, 1μM) or LXR ligand (GW3965, 1μM). iNOS expression was evaluated by real time PCR. * p < 0.02 vs LPS (left), Pam 3 (middle), poly I:C (right). Results are expressed as the average of 2 independent experiments performed in duplicate. Error bars represent standard deviations. D. Model depicting parallel transrepression pathways utilized by PPARγ and LXRs. See text for discussion.