Figure 7.
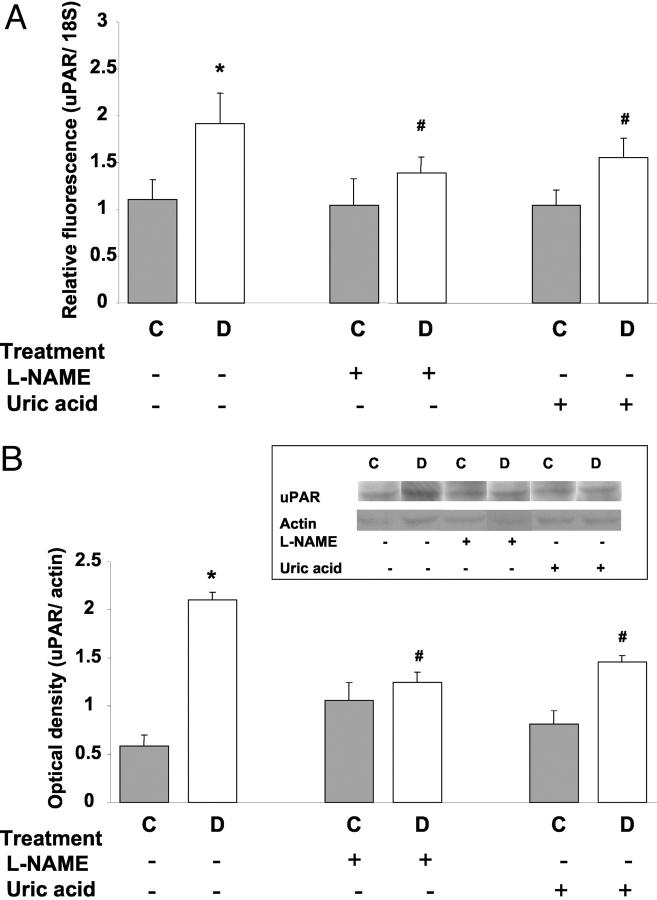
Expression of uPAR mRNA and protein levels in STZ-induced diabetic and control rat retina as determined by real-time PCR and Western blot analysis. A: Diabetic retinas had significant increases in uPAR mRNA expression, which was inhibited by treatment with L-NAME (50 mg/kg/day) or uric acid (160 mg/kg/day). Data shown is the mean ± SEM of three animals in each group. B: Diabetic retinas had significant increases in uPAR protein expression, which was inhibited by treatment with L-NAME (50 mg/kg/day) or uric acid (160 mg/kg/day). Data shown is the mean ± SEM of six animals in each group. C, control; D, diabetic; *, P < 0.01 versus untreated control; #, P < 0.05 versus untreated diabetic.

