


Abstract
The p53 tetramer recognizes specifically a 20-bp DNA element. Here, we examined symmetries encoded in p53 response elements (p53REs). We analyzed base inversion correlations within the half-site, as well as in the full-site palindrome. We found that p53REs are not only direct repeats of half-sites; rather, two p53 half-sites couple to form a higher order 20 bp palindrome. The palindrome couplings between the half-sites are stronger for the human than for the mouse genome. The full-site palindrome and half-site palindrome are controlled by insertions between the two half-sites. The most notable feature is that the full-site palindrome with coupling between quarter-sites one and four (H14 coupling) dominates the p53REs without insertions. The most frequently observed insertion in human p53REs of 3 bp enhances the half-site palindrome. The statistical frequencies of the coupling between the half-sites in the human genome correlate with grouped experimental p53 affinities with p53REs. Examination of known p53REs indicates the H14 couplings are stronger for positive regulation than for negatively regulated p53REs, with repressors having the lowest H14 couplings. We propose that the palindromic sequence couplings may encode such potential preferred multiple binding modes of the p53 tetramer to DNA.
INTRODUCTION
p53 protein operates as a tumor suppressor and helps regulate hundreds of genes in response to various types of stress (1). DNA binding is critical for the biological functions of p53. p53 can recognize specific DNA sequences (2) or geometries (3). The sequence-specific DNA binding mainly relates to the transcription function of p53 to selectively bind its transcription targets. The p53 response element (p53RE) or p53-binding sites have two half-site palindromes. While previously it was suggested that the two palindromes may be consecutive or separated by spacer with 1–14 bp (2), one analysis (4) has indicated that the lengths of the spacers between the two half-sites are predominantly zero. The structure of p53 contains an N-terminal transactivation domain, a DNA-binding core domain, a C-terminal tetramerization and a regulatory domain. Proper p53–DNA binding requires a well-folded DNA-binding domain and a p53 homotetramer. The monomeric p53–DNA interaction is well established (5), and several possibilities for the p53 tetramer–DNA interactions have been discussed (5–8).
Three conventional features are commonly used to describe the p53RE: (1) the half-site palindrome has 10 bp with a consensus sequence of 5′-RRRCWWGYYY-3′, where W can be A or T, and R and Y stand for purine and pyrimidine bases, respectively. Thus, the half-site can be described as two inverted repeats → ←; (2) the two half-sites are highly repetitive; and (3) the symmetric nature of p53RE decides the symmetric binding of the p53 tetramer. In order to maintain genomic stability in response to cellular stress, the p53 protein has to differentiate between hundreds of p53RE to properly perform its functions (9). The differentiation can be achieved by p53 concentration, location and target promoter sequences. Since the consensus-binding site for p53 has been established (2), many p53 target genes have been identified experimentally (10–13). Computational algorithms were also developed to explore the potential p53REs on genomic scale (4,14–16). Currently, there are >100 experimentally verified p53RE sequences, with 542 high-probability p53 loci (4). The computationally identified p53RE sequences are expected to be much larger. Thus, it is natural to ask how the information encoded in p53RE is differentially recognized by p53.
One way to encode binding information is via symmetrically structured DNA motifs (17). The internal symmetry in the full-site is a typical feature of many natural p53REs (18). The full-site p53REs may encode a direct repeat of the half-sites or an inverted (palindromic) repeat of the half-sites. There is evidence that proteins may use different oligomerization states to recognize DNA sequences with different symmetries. The π protein binds a DNA sequence motif arranged in direct repeats or inverted repeats using different oligomerization surfaces (19,20). T-box genes with various possible combinations also selectively bind monomeric or dimeric transcriptional factors (21). It appears that point mutations affecting the translation of direct repeats into inverted repeat response element sequences may lead to a change in the cooperativity of androgen receptor DNA binding (22,23). Alternatively, geometric adaptation of a given oligomeric state may accommodate the binding to alterations in the DNA sequence symmetry. Thus, different p53REs may elicit different p53-binding modes.
In this study, we systematically examined the symmetries encoded in p53REs. We focus on the correlated base inversions within the half-site palindrome, as well as within the full-site palindrome. Three datasets are used, one compiled from known experimentally verified sequences (see Appendix), and two from computationally detected p53-responsive genes using p53MH (datasets of mouse and human genomes, respectively) (14). We found that the sequence of each p53RE is not a simple repeat of its half-site. Rather, in addition, the two half-sites are coupled to form a higher order palindrome of 20 bp. The base pair couplings between the two half-sites are stronger for human genes than for mouse genes. When there is a spacer between the half-sites, the level of coupling between the quarter-sites as compared to that between the half-sites depends on the size of the spacers.
METHODS
Dataset construction
The experimental dataset for p53REs is compiled from four sources of references: (1) p53REs binding to tetrameric p53 construct (residues 94–360) (13); (2): Inga et al.'s work focusing on the differential transactivation by the p53 protein (10); (3) the group of p53 target genes involved in specific p53 downstream effects (11); and (4) the dataset compiled and curated in the p53 knowledge-base (12). Redundant entries from these sources are removed with 100 remaining p53RE sequences (Appendix).
Datasets two and three are the mouse and human p53RE sequences. These are downloaded from the web site of p53MH (http://linkage.rockefeller.edu/p53/). The putative p53 DNA-binding elements in 2583 human genes have 25 840 sequences and in the mouse there are 1713 homologous genes with 17 378 sequences. These sequences were detected by the p53MH algorithm by scanning from the 5′ to 3′ end of each gene with an additional 10-kb nucleotide sequence appended at each end (14). The p53MH algorithm has three basic elements: weighting, scoring and filtering, as described in detail in (14). Here, we only used the putative p53REs detected in (14), and removed a few entries with uncertain ‘N’ in the sequences.
Two artificial random p53REs datasets are generated by: (1) strictly following the p53 consensus binding site sequence with: RRRCWWGYYY- RRRCWWGYYY. The base in each position is randomly selected, as long as it fits the above consensus. For the second artificial dataset, non-consensus bases are introduced into the sequence randomly, however, with the overall percentage exactly the same as that in the native p53REs (Table 1). To generate the artificial p53RE dataset 2, four bins for each position are set for A, T, C and G, respectively. The bin size is identical to the number of counts in Table 1, with a total count of 100. For example, for position one, the A bin is 31 (from 1 to 31); 10 for T (from 32 to 41); 7 for C (from 42 to 48), and 52 for G (from 49 to 100). A random number (ranging from 1 to 100) is generated for each position. If the number is within the bin, the corresponding base is selected.
Table 1.
Counts of bases appearing in the experimentally verified p53 response elements (sequences are listed in the Appendix)
| Position | A | T | C | G |
|---|---|---|---|---|
| 1 | 31 | 10 | 7 | 52 |
| 2 | 28 | 4 | 11 | 57 |
| 3 | 37 | 10 | 14 | 39 |
| 4 | 1 | 3 | 95 | 1 |
| 5 | 55 | 31 | 11 | 3 |
| 6 | 32 | 56 | 2 | 10 |
| 7 | 3 | 0 | 1 | 96 |
| 8 | 7 | 33 | 48 | 12 |
| 9 | 6 | 19 | 69 | 6 |
| 10 | 6 | 37 | 45 | 12 |
| 11 | 27 | 8 | 17 | 48 |
| 12 | 28 | 2 | 8 | 62 |
| 13 | 36 | 3 | 13 | 48 |
| 14 | 1 | 5 | 90 | 4 |
| 15 | 48 | 33 | 12 | 7 |
| 16 | 30 | 55 | 6 | 9 |
| 17 | 4 | 2 | 2 | 92 |
| 18 | 6 | 47 | 41 | 6 |
| 19 | 5 | 32 | 52 | 11 |
| 20 | 5 | 42 | 39 | 14 |
There are total 100 sequences listed in Appendix. Thus the counts in this table are equivalent to percentage. The number of insertion of spacers: Zero spacer: 55; one spacer: 8; two spacers: 8; three spacers: 7; four spacers; 3; five spacers: 3; six spacers: 5; eight spacers: 5; 10 spacers: 3; 11 spacers: 1; 13 spacers: 1; 14 spacers: 1.
Count of couplings in the sequences and datasets
The definitions of various symmetric elements of p53RE are illustrated in Figure 1. We define three types of couplings in p53RE to (1) compare the palindromes for half-sites and for full-site; and (2) to quantitatively classify the two half-sites of p53RE as direct repeats or inverted repeats. For a given dataset, we count the total numbers of the three types of couplings at each of the 20 positions of the p53RE. The first is Q-coupling to measure the half-sites palindrome, which is defined by the total number of inverted bases between Q1 and Q2, and between Q3 and Q4 at the corresponding positions (i to 11 − i, and 10 + i to 21 − i):
| 1 |
where Ni to (11−i ) is the total number of inverted base pairs for the first half-site (between Q1 and Q2 at positions i and 11 − i), and N(10+i) to (21−i) is the total number of inverted base pairs for the second half-site (between Q3 and Q4 at positions 10 + i and 21 − i), for all sequences in a given dataset.
Figure 1.

Definition of symmetric couplings. (a) Q-coupling is defined by the number of inverted bases between Q1 and Q2, and between Q3 and Q4 at each palindrome position in the half-sites. H-coupling measures the number of inverted bases between two half-sites at corresponding palindrome positions. (b) T-coupling describes how many bases are the same in respective positions in the two half-sites. (c) Overlap of three couplings occurs as long as any two of the Q-, H- or T-couplings overlap. The counts of overlapped couplings are removed from the statistics of the contributions of various coupling.
The second is the H-coupling between the two half-sites to measure the full-site palindrome, by counting the number of inverted bases between the two half-sites:
| 2 |
where Ni, (21−i) is the total number of inverted base pairs. The H-coupling measures a correlation between the first half-site and the second half-site at positions i and 21 − i for all sequences in a given dataset. Higher H-coupling implies that the p53REs in a dataset are more likely to be inverted repeats (i.e. they are a full-site palindrome).
The third element, T-coupling, measures direct repeats by counting the number of identical bases at the respective positions in the two half-sites:
| 3 |
where Ni, (10+i) is is the total number of identical base pairs. T-coupling measures a correlation between the first half-site and the second half-site at positions i and 10 + i for all sequences in a given dataset.
For each p53RE sequence, the number of bases involved in the Q-coupling, H-coupling and T-coupling are counted according to the definitions in Equations (1)–(3), respectively. The overall numbers of coupling counts in the datasets are the summations of the individual counts of coupled bases in each position in each sequence.
The overlapping bases simultaneously involved in the Q-, H- and T-couplings are checked and removed prior to the calculation of the coupling frequencies. Due to a symmetrical relationship, a base is involved in all three couplings as long as it is involved in any two of the three couplings (Figure 1c). Therefore, the final statistics of the Q-, H- and T-couplings do not have overlapping contributions.
Fractions of coupling and coupling matrixes
The fraction of the bases involved in specific coupling is calculated as follow:
| 4 |
where Fq(i, j) is the fraction of Q-coupled base i at position j; Nq(i, j) is the number of Q-coupled base i in position j; and N(j) is the overall number of bases in position j in the dataset (total number of sequences). Similarly, the fractions of H-coupled base Fh(i, j) and T-coupled base Fq(i, j) are calculated (Table 2).
Table 2.
Fraction of bases involved in only H-coupling across the half-sites for all potential human p53REs
| Position | Consensus | A | T | C | G | Sum |
|---|---|---|---|---|---|---|
| 1 | A/G | 0.158 | 0.016 | 0.008 | 0.087 | 0.270 |
| 2 | A/G | 0.135 | 0.005 | 0.002 | 0.175 | 0.319 |
| 3 | A/G | 0.130 | 0.007 | 0.006 | 0.152 | 0.297 |
| 4 | C | 0 | 0 | 0.002 | 0 | 0.003 |
| 5 | A/T | 0.186 | 0.157 | 0.000 | 0 | 0.344 |
| 6 | A/T | 0.151 | 0.187 | 0 | 0 | 0.339 |
| 7 | G | 0 | 0 | 0 | 0.003 | 0.003 |
| 8 | T/C | 0 | 0.128 | 0.165 | 0.007 | 0.303 |
| 9 | T/C | 0.006 | 0.139 | 0.121 | 0.003 | 0.271 |
| 10 | T/C | 0.017 | 0.122 | 0.083 | 0.007 | 0.232 |
| 11 | A/G | 0.122 | 0.017 | 0.007 | 0.083 | 0.232 |
| 12 | A/G | 0.139 | 0.006 | 0.003 | 0.121 | 0.271 |
| 13 | A/G | 0.128 | 0 | 0.007 | 0.165 | 0.302 |
| 14 | C | 0 | 0 | 0.003 | 0 | 0.003 |
| 15 | A/T | 0.187 | 0.151 | 0 | 0 | 0.339 |
| 16 | A/T | 0.157 | 0.186 | 0 | 0.000 | 0.344 |
| 17 | G | 0 | 0 | 0 | 0.002 | 0.003 |
| 18 | T/C | 0.007 | 0.130 | 0.152 | 0.006 | 0.297 |
| 19 | T/C | 0.005 | 0.135 | 0.175 | 0.002 | 0.319 |
| 20 | T/C | 0.016 | 0.158 | 0.087 | 0.008 | 0.271 |
Bold fonts are for consensus bases.
In the case of dividing the dataset into subgroups according to the number of inserted base pairs between the half-sites, N(j) refers to the total number of sequences in the subgroup (Table 3). Thus, a coupling matrix is defined by the fraction of a given base in a given position that is involved in the Q-coupling, H-coupling and T-coupling, respectively. In all of the above calculations, bases with overlapped Q-, H- and T-couplings are not counted. Table 3 reports the coupling matrices for the p53REs without insertion.
Table 3.
Fraction of bases involved in various couplings for potential human p53REs without a spacer (insertion) between the two half-sites
| H-coupling only | T-coupling only | Q-coupling only | ||||||||||||
|---|---|---|---|---|---|---|---|---|---|---|---|---|---|---|
| No | Con | A | T | C | G | Sum | A | T | C | G | A | T | C | G |
| 1 | A/G | 0.245 | 0.006 | 0.005 | 0.068 | 0.323 | 0.086 | 0.012 | 0.009 | 0.178 | 0.104 | 0.009 | 0.006 | 0.066 |
| 2 | A/G | 0.095 | 0.004 | 0.003 | 0.492 | 0.594 | 0.090 | 0.005 | 0.001 | 0.096 | 0.097 | 0.006 | 0.004 | 0.086 |
| 3 | A/G | 0.089 | 0.004 | 0.004 | 0.458 | 0.555 | 0.079 | 0.000 | 0.013 | 0.199 | 0.074 | 0.003 | 0.004 | 0.203 |
| 4 | C | 0.000 | 0.000 | 0.002 | 0.000 | 0.002 | 0.000 | 0.000 | 0.000 | 0.000 | 0.000 | 0.000 | 0.002 | 0.000 |
| 5 | A/T | 0.148 | 0.062 | 0.000 | 0.000 | 0.210 | 0.130 | 0.094 | 0.001 | 0.000 | 0.128 | 0.067 | 0.000 | 0.000 |
| 6 | A/T | 0.097 | 0.130 | 0.000 | 0.000 | 0.227 | 0.088 | 0.165 | 0.000 | 0.000 | 0.067 | 0.128 | 0.000 | 0.000 |
| 7 | G | 0.000 | 0.000 | 0.000 | 0.001 | 0.001 | 0.000 | 0.000 | 0.000 | 0.003 | 0.000 | 0.000 | 0.000 | 0.002 |
| 8 | T/C | 0.000 | 0.077 | 0.097 | 0.004 | 0.178 | 0.003 | 0.087 | 0.213 | 0.010 | 0.003 | 0.074 | 0.203 | 0.004 |
| 9 | T/C | 0.006 | 0.085 | 0.091 | 0.004 | 0.186 | 0.007 | 0.092 | 0.080 | 0.004 | 0.006 | 0.097 | 0.086 | 0.004 |
| 10 | T/C | 0.007 | 0.043 | 0.018 | 0.008 | 0.076 | 0.013 | 0.098 | 0.223 | 0.006 | 0.009 | 0.104 | 0.066 | 0.006 |
| 11 | A/G | 0.043 | 0.007 | 0.008 | 0.018 | 0.076 | 0.086 | 0.012 | 0.009 | 0.178 | 0.099 | 0.010 | 0.007 | 0.069 |
| 12 | A/G | 0.085 | 0.006 | 0.004 | 0.091 | 0.186 | 0.090 | 0.005 | 0.001 | 0.096 | 0.087 | 0.004 | 0.001 | 0.080 |
| 13 | A/G | 0.077 | 0.000 | 0.004 | 0.097 | 0.178 | 0.079 | 0.000 | 0.013 | 0.199 | 0.087 | 0.000 | 0.003 | 0.186 |
| 14 | C | 0.000 | 0.000 | 0.001 | 0.000 | 0.001 | 0.000 | 0.000 | 0.000 | 0.000 | 0.000 | 0.000 | 0.001 | 0.000 |
| 15 | A/T | 0.130 | 0.097 | 0.000 | 0.000 | 0.227 | 0.130 | 0.094 | 0.001 | 0.000 | 0.114 | 0.055 | 0.000 | 0.000 |
| 16 | A/T | 0.062 | 0.148 | 0.000 | 0.000 | 0.210 | 0.088 | 0.165 | 0.000 | 0.000 | 0.055 | 0.114 | 0.000 | 0.000 |
| 17 | G | 0.000 | 0.000 | 0.000 | 0.002 | 0.002 | 0.000 | 0.000 | 0.000 | 0.003 | 0.000 | 0.000 | 0.000 | 0.001 |
| 18 | T/C | 0.004 | 0.089 | 0.458 | 0.004 | 0.555 | 0.003 | 0.087 | 0.213 | 0.010 | 0.000 | 0.087 | 0.186 | 0.003 |
| 19 | T/C | 0.004 | 0.095 | 0.492 | 0.003 | 0.594 | 0.007 | 0.092 | 0.080 | 0.004 | 0.004 | 0.087 | 0.080 | 0.001 |
| 20 | T/C | 0.006 | 0.245 | 0.068 | 0.005 | 0.323 | 0.013 | 0.098 | 0.223 | 0.006 | 0.010 | 0.099 | 0.069 | 0.007 |
Evaluation of sequence-dependent quarter-site couplings
For a given sequence, the couplings of two quarter-sites are evaluated by adding the fractions of the coupling of the bases in all positions within the coupled quarter-sites. The weights of five correlation modes are evaluated as the sum of their corresponding quarter-site frequency matrix:
- T13 mode with T-coupling matrix, sum of fraction:

- T24 mode with T-coupling matrix, sum of fraction:

- H14 mode with H-coupling matrix, sum of fraction:

- H23 model with H-coupling matrix, sum of fraction:

- The Q1234 mode with Q-coupling matrix, sum of fraction:
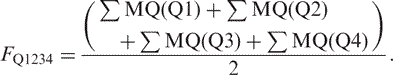
Here, the weight is scaled to be comparable with the other four modes where only two quarter-sites are evaluated. Finally, the probabilities or the populations of a quarter-site coupling mode are normalized as:
| 5 |
| 6 |
| 7 |
| 8 |
| 9 |
In the present study, frequencies based on the human p53REs are used to evaluate the quarter-site couplings.
RESULTS
Definitions and analysis of the symmetry of p53REs
In the case of a perfect palindrome and two exact repeats, the three symmetry elements are tangled together. However, the definition of a consensus site based on purine and pyrimidine bases provides sufficient variation to differentiate between the three couplings, in addition to the consensus rule not followed strictly in most p53REs. Still, ∼25% of the bases are simultaneously coupled by the three couplings (Figure 1c). In order to measure independent coupling, we removed the overlapping counts in the half-site palindrome, full-site palindrome and between the two half-site repeats prior to the calculation of the coupling frequencies.
With the terms defined above, we examine the three p53RE datasets (see Materials and Methods section) to investigate the symmetric nature of p53RE. Dataset one is compiled from known experimentally verified sequences. Datasets two and three are from computationally identified p53-responsive genes using p53MH (in the mouse and human genomes, respectively) (14).
Couplings between two half-sites are not random
Appendix lists the 100 experimentally verified p53REs, compiled from (10–13). In Table 1, we report counts of bases at each of the 20 positions, and the sequence logo corresponding to the 100 p53REs of Figure 2a. Most p53REs have no spacers between the two half-sites (55 of 100), but about half of the p53REs do have insertions with spacers ranging from 1 to 14 (Table 1). As can be seen from the sequence logo, the first half-site is slightly more conserved (Figure 2a).
Figure 2.

Sequence logos for three datasets. (a) Native p53REs (compiled in Appendix). (b) Artificial p53REs with strict consensus distributions in artificial dataset 1. (c) Artificial p53REs dataset 2 with overall base distributions identical to the dataset of native p53REs.
As indicated in Table 1, considerable violations of the consensus sequence rule exist. In a few cases, even the most conserved C and G bases in positions 4, 7, 14 and 17 violate the consensus rule. Even though an insertion in-between quarter-sites within the half-sites inactivates the p53 binding with a designed DNA (25), we observe at least three p53RE sequences with such violation (14-3-3 σ, site 2, GTAGCA TT AGCCC AGACA TGTCC; THBs2(4156): AGCCA G AGGCC AGAAAGTG AGGCT TGCTC; THBs2(3530) AGACT TGCCT GATTCT GGGCT GCC AGATT).
Figure 3a examines the percentage of bases involved in the Q-coupling (within half-sites), H-coupling (across half-sites) and T-coupling (between half-sites) in the datasets of human p53REs. At first glance, we can see that positions 4, 7, 14 and 17, which are the conserved C, G, C and G, respectively, satisfy all symmetry requirements, and thus have the highest possible frequencies (100%). For the others, the percentages of the three couplings fluctuate ∼40%, which means that the average palindromes have ∼4–5 inverted base pairs for each 20 base p53REs (a perfect one should have 10 bp for 20-base full site).
Figure 3.

Frequencies of occurrence of the three couplings in potential p53REs in the human genome (a); the relative abundance of full-site palindrome over half-site palindrome in the potential human p53REs (b), mouse p53REs (c) and in a compiled dataset of known p53REs (d).
Among the base pairs involved in the H-couplings, many are also involved simultaneously in the Q-coupling within the half-site. If we remove the overlap counts between the H-coupling and Q-coupling and only count the bases with H-coupling, as shown in Table 2, still ∼30% of the bases are inverted (coupled) bases across the two half-sites. We further observe more H-couplings (129 694 bp) than Q-couplings (127 826 bp) in the potential human p53REs (258 400 bp). The propensity for a base to have an H-coupling or Q-coupling depends on its position in the full-site p53REs. As shown in Figure 3b, H-couplings between quarter-site 1 (Q1) and quarter-site 4 (Q4) are preferred, while H-couplings between quarter-site 2 (Q2) and quarter-site 3 (Q3) are less preferred. Positions 9–12 are preferred to have Q-couplings.
On the other hand, mouse p53REs (173 780 bp) show lower H-coupling (86 848 bp) than Q-coupling (87 424 bp). There are two conserved features between the human (Figure 3b) and mouse coupling patterns (Figure 3c): the preference for Q-coupling in positions 9–12, and the preference for H-coupling in positions 5, 6, 15 and 16. A/T pairs in these positions have been noted as important for p53 transactivation (10). Figure 3d presents the results for the small dataset of experimentally verified p53REs.
Comparing with Q-couplings or H-couplings, the level of translational T-couplings (base repeat or degeneracy) is also position dependent (Figure 4), with positions 1, 2, 19 and 20 having a lower tendency to repeat the same base, and with the mouse p53REs showing a higher tendency to have T-coupling.
Figure 4.

The relative abundance of degeneracy of the whole site over the half-site palindrome for human p53REs (a) and for mouse p53REs (b). Similarly, the relative abundance of degeneracy of two half-sites over full site palindrome for human p53REs (c) and for mouse p53REs (d) is also compared.
In order to check the statistical significance of these results, we generated two artificial p53REs datasets (Materials and Methods section), each with the same number of sequences as the potential human p53REs (25 840). The first artificial dataset strictly follows the consensus rule, with the sequence logo shown in Figure 2b. This dataset has ∼50% Q-couplings, H-couplings and T-couplings at every position, indicating that a simple consensus rule does not reflect the symmetry codes in p53REs. The second artificial dataset has exactly the same sequence logo as the human potential p53REs (Figure 2c). Violations of the consensus decrease all three couplings to a similar extent as in the potential human p53REs (Figure 5a). However, in the artificial datasets, there are random distributions for the Q-coupling and H-coupling (Figure 5b). Therefore, the difference between the Q-coupling and H-coupling in the datasets of potential p53REs reflects the preferences to have Q-coupling within the half-sites or to have H-coupling across the half-sites.
Figure 5.

(a) Frequencies of occurrence of the three couplings in artificial p53REs; (b) the relative abundance of full-site palindrome over half-site palindrome in the random artificial p53REs. The artificial p53REs satisfy the consensus rule of p53RE however, there is no pattern for the difference between Q-coupling within the half-sites and H-coupling across half-sites.
Base pair insertions between the two half-sites modulate palindrome patterns of p53REs
Previously it was proposed that the spacers between the two half-sites of p53REs can range in size from 0 to 14 nt. Recently, it was observed that the length of the spacers is predominantly zero, although there are p53REs with 1 bp or longer insertions (4). In the experimental dataset compiled in this work, ∼46% of the p53REs have spacers. Here, we found that base pair insertions between the two half-sites modulate the repeat patterns of the p53REs, probably reflecting the need to accommodate the geometrical constraints in the binding of the p53 tetramer to such p53REs.
Insertion of spacers between two half-sites modulates the symmetry couplings in p53REs. We highlight four groups of p53REs in Figure 6, showing the changes in the differences between the two half-sites (H-couplings) and within the half-sites (Q-couplings) with the number of inserted base pairs (for 0, 3, 8 and 14 spacers). We also report the changes of coupling with all insertions in Supplementary Figures 1 and 2 for the human and mouse genomes, respectively. In Figure 6a of human p53REs without base pair insertions, we see the strongest preference for H-coupling. For the details of the coupling, in Table 3 we list the fractions of bases involved only in H-coupling. In position 2, 59.4% of the bases are coupled only across the two half-sites, while 19.3% of the bases are coupled only within the half-sites, leading to 40% preference for a base pair to couple with another base pair in the other half-site, over coupling with another base pair in the same half-site (Figure 6a). Thus, in human p53RE, quarter-sites 1 and 4 are correlated. Mouse p53REs without insertions show a similar coupling pattern as in human, although the preference for quarter-sites 1–4 correlation is not as strong (Figure 6b).
Figure 6.

Changes in the relative abundance of the full-site palindrome over the half-site palindrome for human p53REs (a) and for mouse p53REs (b) with several key insertions are highlighted. (c) Distributions of various insertions in human and mouse p53REs.
For both human and mouse p53REs, insertions of 1 or 2 bp (Supplementary Figures 1 and 2) destroy the dominancy of the quarter-sites 1–4 correlation, while the A/T sites in the two half-sites are still preferred to be coupled. On the other hand, insertion of 3 bp appears to reverse the coupling preferences (Figure 6 and Supplementary Figures 1 and 2), and Q-couplings within the half-site are dominant. Mouse homologs show a similar trend with a less pronounced change (Figure 6b). With 8-bp insertion, mouse p53REs show preferred Q-coupling (Figure 6b). The H–Q coupling pattern for p53REs with an 8-bp spacer for the mouse is similar to that of 3-bp insertion for human. The significance of insertions of 3-and 8-bp spacers is reflected in the coupling pattern, as well as in their frequencies of occurrence, as indicated in Figure 6c. For the human p53REs, the top three frequencies are no insertion, insertion of 3 bp and insertion of 8 bp (Figure 6c). For the mouse p53REs, insertion of 8 bp is the most frequent (Figure 6c). Variation of sequence patterns in promoter regions of different species was recently proposed to have been adopted by evolution to modulate the regulation of gene expression (26).
Figures 6 and Supplementary Figures 1 and 2 indicate that insertions modulate the p53REs’ correlations among the four quarter-sites. Taking insertions of 4–7 and 10–14 bp as examples, we see variability in the coupling trends. Insertions of 10–13 bp affect the modulation to a lesser extent. The preference for long-range quarter-sites 1–4 correlation appears to be restored with 14 bp. Again, the artificial p53RE dataset does not illustrate a variation between the Q-coupling and H-coupling with insertion length.
A/T bases in the WW region might signal a palindrome of p53REs
Examination of Figure 6 reveals that positions 5, 6, 15 and 16 (A/T bases in the WW region) also have different H–Q coupling behavior with the spacer length. Since each half-site has one of the four TA, TT, AT, AA combinations, the two half-sites in the p53REs may have 16 possible combinations in the two WW regions. Figure 7 plots the frequencies for both human and mouse p53REs divided into groups with various spacer lengths between the two half-sites. The X-axis indicates combinations of the two WW regions. For example, TA × AA means that the sequence in positions 5 and 6 is TA, and that in position 15 and 16 is AA. Both human and mouse p53REs show a similar pattern with certain frequently occurring sequences for a given number of base pairs between the half-sites. For the human p53REs, without insertions between half-sites the most frequent sequence is AT × AT. For other spacer lengths, TT × TT and AA × AA have frequent insertions of 4 bp; TA × AT and AT × TA with 3-bp insertions.
Figure 7.

Frequencies of various combinations of consensus A/T bases in the WW region (5, 6, 15 and 16) are related to the number of insertions in human p53REs (a) and in mouse p53REs (b). The most notable feature is the AT × AT combination for the p53REs without insertion. Here, ∼80% of the AT × AT group combination with insertion have full-site palindrome, while <10% have quarter-site palindrome counts (c).
The most noteworthy combination is AT × AT in the p53REs without a spacer. The signal of AT × AT combination could promote H-coupling across the half-sites. As can be seen in Figures 7a and c, the AT × AT combination is enriched by 47% in human p53REs without insertion. This group has the strongest H-coupling between quarter-sites Q1 and Q4. 80% of the sequences with AT × AT combinations show correlations at positions 2–19 and 3–18 (H-coupling), while these sites have little Q-coupling (Figure 7c).
p53REs quarter-site coupling and experimental DNA–p53 tetramer affinities
To probe the implications of the various couplings in each position in p53REs, we look at the quarter-site couplings by adding up the frequencies of Q-, H- and T-couplings in the quarter-sites. There are at least five possible quarter-site correlations. The first is the half-site palindrome: quarter-site one correlates with quarter-site two and quarter-site three correlates with quarter-site four, which we call Q1234. Since the correlation is within each half-site, their frequencies are described by Q-coupling. The rest are couplings across half-sites. Two are translational repetitions, with T13 referring to the correlation of quarter-site 1 and quarter-site 3 and T24 for quarter-sites 2 and 4. The full-site palindrome of p53RE is evaluated by two H-coupling correlations: H14 for quarter-sites 1 and 4 and H23 for quarter-sites 2 and 3.
The weights of five correlation modes are evaluated as the sum of their corresponding quarter-site frequency matrix described in the Materials and Methods section. We show the frequencies of bases involved in the three couplings in Table 3. Taking the human Puma-binding site 2 (GGACAAGTCA GGACTTGCAG) as an example, by adding up the weighted sequence-dependent matrix, we can come up with the sum of the fractions Q1234 = 0.599, T13 = 0.930, T24 = 0.660, H14 = 1.416 and H23 = 0.559. By converting the sum of fractions into percentages, the ratios are 14.4, 22.3, 15.9, 34.0 and 13.4%, for the Q1234, T13, T24, H14 and H23, respectively (Table 4).
Table 4.
Five p53REs and proposed p53 coupling modes examined by an empirical weighting matrix
| Gene | Sequence | Q1234 | T13 | T24 | H14 | H23 | |
|---|---|---|---|---|---|---|---|
| p21-5′ | CTATGAG GAACATGTCC CAACATGTTG AGCTC | Sum of fraction | 0.657 | 0.786 | 0.912 | 0.742 | 0.618 |
| Population% | 17.69 | 21.16 | 24.54 | 19.96 | 16.64 | ||
| Gad45A | TGTACA GAACATGTCT AAGCATGCTG GGGTC | Sum of fraction | 0.821 | 0.983 | 0.912 | 1.110 | 0.698 |
| Population% | 18.15 | 21.73 | 20.14 | 24.55 | 15.43 | ||
| pDINP1 | TTTATA GAACTTGGGG GAACATGTTT ACCAA | Sum of fraction | 0.597 | 0.919 | 0.633 | 0.896 | 0.457 |
| Population% | 17.04 | 26.24 | 18.08 | 25.58 | 13.05 | ||
| p53Aip | TCCTCC TCTCTTGCCC GGGCTTGTCG AGATG | Sum of fraction | 0.624 | 0.674 | 1.024 | 0.814 | 0.642 |
| Population% | 16.52 | 17.83 | 27.11 | 21.54 | 17.0 | ||
| Puma-BS2 | TGCCGC GGACAAGTCA GGACTTGCAG GCGCG | Sum of fraction | 0.599 | 0.930 | 0.660 | 1.416 | 0.559 |
| Population% | 14.38 | 22.33 | 15.86 | 34.00 | 13.42 |
To investigate if the quarter-site coupling modes encoded in the p53REs correspond to p53–DNA interactions, we compare the coupling mode populations with the binding affinities of p53 to various response elements. Weinberg et al. (13) have systematically measured the binding affinities of a tetrameric p53 construct (residues 94–360) with 20 of its response elements from a variety of representative genes. In Table 5, we compare the computed populations for the five coupling modes with experimental binding affinities. We found no correlation with experiment for the Q1234 mode (half-site palindrome), T13 mode and T24 mode. On the other hand, we found that the full-site palindrome correlates with experimental p53 affinities. The correlation between H14 mode with experiments was R2 = 0.23, and that between H23 mode with experiments was R2 = 0.36. Since there are considerable variations in experimental affinities, we grouped the p53REs according to their binding affinities (very strong, strong, weak and very weak; Table 5). While experimental affinities show a clear division into distinct (very strong, strong, weak and very weak) binding affinities, the number of p53REs that experiment observed to fall into the first category versus the other categories varies substantially. We also noticed that the groupings lead to only four data points. Using the average values from these binding groups, we see that there are correlations for modes H14 and H23 with experimental affinities, with R2 = 0.86 and 0.99, respectively (Figure 8). The stronger is the H14 coupling and the weaker H23 coupling mode, the higher the affinity of the p53 tetramer with its response element. This result suggests that the H14 mode contributes the most to the observed p53 tetramer–DNA interactions. Thus, full-site palindrome is important for p53–DNA interactions.
Table 5.
Comparison of computational quarter-site coupling probability and experimental p53–DNA affinity
| Group | P53REs | Q1234 | T13 | T24 | H14 | H23 | Kd (nM)a |
|---|---|---|---|---|---|---|---|
| Very strong binding | 14-3-3 σ s1 | 13 | 13.4 | 20.8 | 44.7 | 8.1 | 9.9 ± 2.1 |
| 14-3-3 σ s2 | 16.1 | 16.7 | 23.6 | 30.5 | 13.1 | 10 ± 2.1 | |
| GADD45 | 18.1 | 21.7 | 20.1 | 24.5 | 15.4 | 7.7 ± 1.2 | |
| Maspin | 18.9 | 18.4 | 22.2 | 22.4 | 18.1 | 9.2 ± 1.7 | |
| MDM2 | 13.7 | 21.8 | 16.5 | 33.6 | 14.4 | 12.3 ± 2.9 | |
| NOXA | 16.3 | 18.8 | 19.9 | 31.3 | 13.8 | 8.6 ± 1.6 | |
| P21-5′ site | 17.7 | 21.2 | 24.5 | 20 | 16.6 | 4.9 ± 0.6 | |
| P21-3′ site | 16.3 | 24.3 | 15.8 | 30.9 | 12.8 | 12 ± 7.0 | |
| P53AIP1 | 16.5 | 17.8 | 27.1 | 21.5 | 17 | 11.0 ± 1.8 | |
| P53R2 | 15.9 | 16 | 21.6 | 33.1 | 13.5 | 5.7 ± 0.8 | |
| PCNA | 17.1 | 26.2 | 20.2 | 21.5 | 15.1 | 6.6 ± 1.4 | |
| PIDD | 19 | 17.2 | 23.9 | 19.8 | 20.1 | 14.7 ± 5.0 | |
| PUMA-BS2 | 14.4 | 14.7 | 24.5 | 33.3 | 13.1 | 7.1 ± 1.8 | |
| Cyclin G | 14.5 | 15.4 | 20.8 | 37.3 | 12 | 7.8 ± 1.6 | |
| Group average | 16.3 | 18.8 | 21.6 | 28.9 | 14.5 | 9.1 | |
| Strong binding | KAI 1 | 18.9 | 19 | 22 | 24.7 | 15.4 | 33 ± 10.9 |
| Group average | 18.9 | 19 | 22 | 24.7 | 15.4 | 33 ± 10.9 | |
| Weak binding | Bax | 18.9 | 18.1 | 22.1 | 19 | 21.8 | 73 ± 33 |
| IGF-BP3 box A | 18.6 | 18.8 | 21.8 | 23 | 17.7 | 81 ± 25 | |
| P53DINP1 | 17 | 26.2 | 18.1 | 25.6 | 13 | 98 ± 23 | |
| Group average | 18.2 | 21 | 20.7 | 22.5 | 17.5 | 84 | |
| Very weak binding | P2XM | 18.7 | 21.3 | 19 | 24.3 | 16.7 | 221 ± 41 |
| PUMA-BS1 | 18.2 | 15.9 | 26.4 | 12.6 | 26.9 | 260 ± 50 | |
| Group average | 18.5 | 18.6 | 22.7 | 18.5 | 21.8 | 241 |
a Reference (13).
Figure 8.

Correlation of five quarter-sites coupling modes with p53-binding affinity shows that the correlation between the H14 mode (correlation between quarter-sites one and four) favors p53 binding while the H23 mode (correlation between quarter-site two and three) interferes and decrease binding affinity.
Insertions between the two half-sites again modulate the coupling mode distributions. We computed the populations of the five modes for all potential p53REs in the mouse and human datasets obtained in p53MH. As can be seen in Table 6, the H14 mode dominates the p53REs without spacer. A single base pair insertion destroyed the H14 dominance. The Q1234 quarter-site coupling is mostly preferred with an insertion of a 3 bp spacer for the human genome and an insertion of an 8 bp spacer for the mouse genome, while it has the least probability for the p53REs without spacer. The H23 coupling is disfavored when there is no spacer. For most spacer lengths, there is a tendency for the T24 mode to dominate.
Table 6.
Quarter-site coupling mode change for human and mouse p53RE with various spacers
| Number of spacer | Q1234 | T13 | T24 | H14 | H23 | Correlation (R2) | |
|---|---|---|---|---|---|---|---|
| 0 | Human | 14.99 | 17.18 | 19.67 | 36.99 | 11.17 | 0.8871 |
| Mouse | 17.88 | 18.28 | 22.40 | 26.37 | 15.06 | ||
| 1 | H | 18.68 | 18.32 | 22.77 | 19.93 | 20.30 | 0.000 |
| M | 20.91 | 20.84 | 20.67 | 16.9 | 20.68 | ||
| 2 | H | 18.54 | 18.58 | 21.77 | 20.35 | 20.75 | 0.5725 |
| M | 18.39 | 19.93 | 22.20 | 20.03 | 19.45 | ||
| 3 | H | 29.80 | 18.08 | 20.15 | 17.60 | 14.36 | 0.0696 (0.3968)a |
| M | 20.02 | 20.71 | 20.23 | 19.66 | 19.38 | ||
| 4 | H | 17.94 | 19.77 | 22.52 | 20.92 | 18.86 | 0.3468 |
| M | 13.90 | 27.77 | 28.40 | 14.10 | 15.84 | ||
| 5 | H | 18.8 | 19.58 | 22.23 | 19.68 | 19.71 | 0.7523 |
| M | 18.26 | 19.87 | 21.72 | 19.39 | 20.76 | ||
| 6 | H | 17.96 | 18.47 | 23.49 | 20.04 | 20.03 | 0.0142 |
| M | 19.94 | 21.40 | 20.95 | 19.13 | 18.60 | ||
| 7 | H | 19.28 | 18.83 | 21.30 | 18.23 | 22.36 | 0.0017 |
| M | 19.03 | 20.67 | 20.75 | 20.01 | 19.54 | ||
| 8 | H | 18.14 | 18.93 | 22.50 | 20.42 | 20.02 | 0.0031 (0.3968)a |
| M | 24.37 | 15.39 | 20.20 | 15.86 | 21.07 | ||
| 9 | H | 19.57 | 18.77 | 21.33 | 20.61 | 19.72 | 0.6537 |
| M | 19.02 | 19.42 | 21.51 | 19.90 | 20.15 | ||
| 10 | H | 18.12 | 19.96 | 22.63 | 19.35 | 20.95 | 0.5816 |
| M | 18.76 | 18.79 | 24.18 | 19.90 | 18.75 | ||
| 11 | H | 18.47 | 20.30 | 21.72 | 19.21 | 20.31 | 0.2669 |
| M | 19.30 | 17.84 | 22.59 | 20.46 | 19.78 | ||
| 12 | H | 18.61 | 19.06 | 21.85 | 19.78 | 20.70 | 0.7691 |
| M | 19.10 | 18.06 | 22.7 | 18.13 | 21.20 | ||
| 13 | H | 18.78 | 18.91 | 21.45 | 20.24 | 20.62 | 0.4743 |
| M | 18.43 | 20.35 | 21.95 | 19.60 | 19.67 | ||
| 14 | H | 18.23 | 16.95 | 21.90 | 24.85 | 18.06 | 0.735 |
| M | 18.80 | 18.80 | 22.22 | 21.31 | 18.89 |
a The correlation coefficient of human p53REs with 3 bp spacer and mouse p53REs with 8 bp spacer is R2 = 0.3968
p53REs quarter-site coupling and transcriptional target functions
In order to perform the complex gene regulation functions, p53 needs to differentiate between hundreds response elements. Thus, the symmetry information encoded in the p53REs may relate to the functions of the genes that p53 activates or represses. Based on the specific experimentally observed p53 downstream effects (11) and on the p53 knowledge-base information resource (12), we grouped the dataset of experimental verified p53REs into several groups (Appendix): cell cycle control, death receptor pathway of apoptosis, DNA repair, apoptosis, positive regulation and negative regulation. Two p53REs (TGFA) are related to growth control, and PLK2 is related to mitosis. We also grouped the p53 human repressors, to see whether there is a difference between gene transactivation and repression. For each of the experimental p53REs, we computed the quarter-site coupling probabilities (Appendix).
In particular, we focus on the H14 and Q1234 couplings in the five groups with sufficient entries (cell cycle, apoptosis, positive regulation, negative regulation and repressors). The full-site palindrome H14 coupling has been shown to correlate with experimental p53-binding affinities in p53REs quarter-site coupling and experimental DNA–p53 tetramer affinities section and the Q1234 is a measure of the half-site palindrome. The average H14 coupling for the cell cycle, apoptosis, positive regulation, negative regulation and repressor groups are 0.28, 0.26, 0.32, 0.25 and 0.20, respectively. The average Q1234 coupling is less sensitive to the function, 0.17, 0.17, 0.15, 0.19 and 0.20 for the cell cycle, apoptosis, positive regulation, negative regulation and repressor groups, respectively. Even though the cell cycle group has higher average H14 couplings than the apoptosis group, both groups have large variations and have mixed strong and weak H14 couplings. But the H14 couplings in the groups of positive regulation, negative regulation and repressor are clearly different. Most p53REs in the positive regulation group (except RGC) have strong H14 coupling (average value 0.32). The negatively regulated group is dominated by p53REs with weak H14 couplings (average value 0.25). The human p53 repressor group genes have the weakest H14 coupling (average value 0.20), suggesting that p53 may activate and repress genes using different mechanisms. The weak H14 couplings in the repressor group results mostly from insertion of spacers; however, it is interesting to see that p22 also has a weak H14 coupling even though its response element has no spacer, suggesting a possible intrinsic requirement for p53-repressed genes. However, additional data is needed to support this conclusion.
DISCUSSION AND CONCLUSIONS
The information encoded in the p53RE is a combination of the half-site palindrome, repeat and the full-site palindrome. This raises the question of which are the dominant coupled elements. Linkage of the two half-sites leads to a full-site palindrome, determining the overall properties of the p53RE. Palindromic DNA sequences have been found to be enriched in binding sites for transcription factors (27,28), since a palindrome increases the productive encounters between transcription factors and DNA (27). One example with a comparable 20 bp palindrome is the T-box genes (29), also with various possible combinations (21). Even though two-palindrome repeats may be characteristic of p53REs, the higher order palindrome in the full-site p53REs highlights the overall consistency of the p53REs with other transcriptional factors. The multiple-palindromic feature of the p53REs may be an elegant way to ensure the overall full-site palindrome, beyond two half-sites. In many cases, natural p53REs have more than two half-sites, yet still maintaining the internal symmetry (18).
The contribution of the coupling between the two half-sites to p53–DNA interactions may explain the cooperative nature of the p53 tetramer–DNA binding. It is well known that p53 dimer–DNA interaction is weak while tetramerization enhances p53-binding affinity significantly (13,30). In the present study, we have shown that coupling between quarter-sites one and four, which are distant from each other, may be responsible for the increase in the p53-binding affinity upon tetramerization. On the other hand, the adjoining H23 coupling appears to decrease p53-binding affinity.
The correlation between DNA-encoded symmetry information and protein interaction reflects a DNA-centric look at protein–DNA complexes. Statistical analysis of protein–protein interactions has revealed protein–protein interaction hot spots (31), which are also important for the interaction of p53 with other cellular proteins (32,33). Here, we noticed ‘hot spot’-like couplings between positions 2 and 19 in p53REs, located in quarter-sites one and four, respectively.
The variations in H14 coupling are also consistent with several other observations related to p53's transactivation activity. We have shown in base-pair insertions between the two half-sites modulate palindrome patterns of p53REs section that positive H14 coupling is enhanced when there are two CATG sequences at the half-sites. Indeed, in their study of native p53 genes, Inga et al. also noticed that p53REs with the two CATG sequences have the strongest transactivation of p21-5′, p53R2, m-FAS and GADD45 and confirmed the trend in their designed artificial sequences (10). Further, in the p53MH database that we have used, while the group of p53REs without spacers occurs most frequently, there was also a sizeable population of p53REs with spacers (Figure 6c). On the other hand, using chromatin immunoprecipitation (ChIP) and paired-end ditag (PET) sequencing strategy, Wei et al. searched for p53 targets in the human genome, observing that 83% (236 of 284) of the motifs had no spacer (4). The enrichment of H14 coupling in the group of p53REs without insertions may explain this preference.
The binding of p53 to its target DNA presents a geometric problem: p53REs may have insertions of variable lengths between the half-site palindromes or they may not have base-pair insertions. Further, p53 has also been shown to bind to three-way and four-way Holliday junctions (34). The question arises as to how p53 is able to bind such a broad spectrum of targets. It is unclear just how would p53 recognize DNA sequence specifically and at the same time recognize different geometries with sequence variability as in the case of the four-way Holliday junction, where two DNA molecules exchange strands (35). Strong binding of p53 to the Holliday and to three-way junctions appears to rely on the p53 core domain with further stabilization of the p53–DNA junction complex by the tetramerization domain (3). Here, we hypothesize that if there are multiple binding modes of the p53 tetramer with the DNA, the palindrome symmetries encoded in p53REs (with and without insertions) may provide some clues. The correlation of quarter-sites one and four is particularly interesting. The structures of the p53 dimer symmetrically positioned on the DNA half-site may explain both the half-site palindrome and the full-site palindrome. On the other hand, the asymmetric p53 dimer DNA recognition in the p53 trimer–DNA complex can discriminate between the half-site and the full-site palindrome. Alternatively, variations of the symmetric positioning such as rotations and shifts may optimize the p53–p53RE interactions accommodating such cases. Additional work is needed to correlate the symmetry information encoded in p53REs with structural features of p53–DNA recognition.
Our results are consistent with available experimental data. In the currently available validated p53REs, most have no spacers. Among those that have spacers, the most frequent spaces that we observe are 3 bp in length. The dominant coupling that we observe for p53REs without spacers is between quarter-sites one and four. Spacers present a mixed coupling picture, with insertions of 3 and to a lesser extent 8 bp strengthening the most the coupling between quarter-sites one and two.
Insertions of a few base pairs are expected to present geometric problems to the p53 tetramer interaction with the DNA, possibly relating to the shift in the dominance of the coupling mode. How do the spacer sizes relate to the actual interaction and the details of the structure of the tetrameric p53–DNA complex with different spacer lengths is a challenging problem. In principle, binding modes may differ from each other to various extents, ranging from minor adjustments, to rotational motions to accommodate the supercoiled DNA with different faces presented to the p53, to more substantial conformational diversity.
The observations made on the mouse genome show consistency and variation compared with those made on the human genome. For p53REs with insertions, the couplings between quarter-sites one and four (H14) are less pronounced than those observed in human analogs. While insertion of 3 bp highlights the half-site palindrome in the human genome, in the mouse genome insertion of an 8 bp spacer leads to such an effect. This apparent difference in the distributions between the human and mouse genomes may reflect adjustment by evolution, probably reflecting the underlying difference in the p53 interaction networks in human and mouse. Although why and how it is actually reflected in the binding remains to be elucidated, it can be inferred that the binding modes in the mouse genome have more of the half-site palindrome character and are more consistent with symmetrical p53 tetramer DNA binding, while the binding modes with preferred H14 coupling may have more significance in human genome. Our results further suggest that the binding modes involved in p53 recognition of positively and negatively regulated genes could be different. The weak H14 coupling in the p53-repressed genes appears to distinguish between the mechanisms of gene repression and activation.
SUPPLEMENTARY DATA
Supplementary Data are available at NAR Online.
ACKNOWLEDGEMENTS
This research was supported (in part) by the US Army Medical Research Acquisition Activity under grant W81XWH-05-1-0002. This project has been funded in whole or in part with Federal funds from the National Cancer Institute, National Institutes of Health, under contract number NO1-CO-12400. The content of this publication does not necessarily reflect the views or policies of the Department of Health and Human Services, nor does mention of trade names, commercial products or organizations imply endorsement by the US Government. This research was supported (in part) by the Intramural Research Program of the NIH, National Cancer Institute, Center for Cancer Research. Funding to pay the Open Access publication charges for this article was provided by Federal funds from NCI.
Conflict of interest statement. None declared.
APPENDIX
Dataset of experimental verified p53 response elements
| Trarget gene and binding site | DNA sequence | Quarter-site coupling probability | Reference | ||||
|---|---|---|---|---|---|---|---|
| Cell cycle | Q1234 | T13 | T24 | H14 | H23 | ||
| 14-3-3 σ-site 2 | GTAGCA tt AGCCCAGACATGTCC | 0.13 | 0.13 | 0.21 | 0.45 | 0.08 | (10,11,13) SFN in (12) |
| 14-3-3 σ -site 1 | AGGCATGTGCCACCATGCCC | 0.16 | 0.17 | 0.24 | 0.31 | 0.13 | (11,13) |
| B99 | GAGCAAGTTGGGGCTTGCCT | 0.15 | 0.21 | 0.15 | 0.39 | 0.10 | (11) |
| Cyclin G | AGACCTGCCCGGGCAAGCCT | 0.15 | 0.15 | 0.21 | 0.37 | 0.12 | (10,13) |
| Cyclin G,C | AGGCT TGCCC GGGCA GGTCT | 0.15 | 0.19 | 0.17 | 0.37 | 0.12 | (10) |
| BTG2 | AGTCCGGGCA g AGCCCGAGCA | 0.21 | 0.22 | 0.17 | 0.19 | 0.22 | (12) |
| gml | ATGCTTGCCCAGGCATGTCC | 0.16 | 0.17 | 0.24 | 0.30 | 0.13 | (12) |
| p21-5′ site | GAACATGTCCCAACATGTTG | 0.18 | 0.21 | 0.25 | 0.20 | 0.17 | (11,13) |
| p21-3′ | GAAGAAGACTGGGCATGTCT | 0.16 | 0.24 | 0.16 | 0.31 | 0.13 | (13) |
| CDKN1a | GAACATGTCCCAACATGTTG | 0.18 | 0.21 | 0.25 | 0.20 | 0.17 | (12) |
| GDF | CATCTTGCCCAGACTTGTCT | 0.16 | 0.13 | 0.27 | 0.28 | 0.16 | (12); PTGF-β, FBS01 in (11) |
| GDF | AGCCATGCCCGGGCAAGAAC | 0.16 | 0.21 | 0.23 | 0.24 | 0.16 | (12); PTGF-β, SBS01 in (11) |
| RB | GGGCGTGCCC cgc GTGCGCGCGC | 0.25 | 0.17 | 0.22 | 0.17 | 0.18 | (11) |
| CCNG1 | GCACAAGCCCAGGCTAGTCC | 0.16 | 0.20 | 0.25 | 0.24 | 0.15 | (12) (cyclin, human) |
| PCBB4 | GGTCTTGGCC ca GACTTAGCAC | 0.18 | 0.19 | 0.21 | 0.19 | 0.22 | (12) |
| Average | 0.17 | 0.19 | 0.21 | 0.28 | 0.15 | ||
| Standard deviation | 0.03 | 0.03 | 0.04 | 0.08 | 0.04 | ||
| Growth | |||||||
| TGFA | AGCCAAGTCTTGGCAAGCGG | 0.16 | 0.18 | 0.16 | 0.34 | 0.15 | (12) |
| TGFA | GGGCAGGCCCTGCCTAGTCT | 0.14 | 0.17 | 0.18 | 0.43 | 0.09 | (12) TGF α in (11) |
| Average | 0.15 | 0.18 | 0.17 | 0.39 | 0.12 | ||
| Death receptor | |||||||
| m-FAS | GGGCATGTACAAACATGTCA | 0.14 | 0.20 | 0.17 | 0.38 | 0.11 | (10); Fas(APO-1/CD95), in (11) |
| TNFRSF | GGGCATGTCCGGGCAAGACG | 0.14 | 0.24 | 0.15 | 0.34 | 0.13 | (12); Killer/DRS in (11) |
| PIDD | AGGCCTGCCT gcgtgctg GGACA AGTCT | 0.19 | 0.17 | 0.24 | 0.20 | 0.20 | (13) PIDD in (11) LRDD in (12) |
| H-FAS,A | TGGCTTGTCAGGGCTTGTCC | 0.14 | 0.19 | 0.18 | 0.36 | 0.12 | (10) |
| Average | 0.15 | 0.20 | 0.18 | 0.32 | 0.14 | ||
| Standard deviation | 0.02 | 0.03 | 0.04 | 0.08 | 0.04 | ||
| DNA repair | |||||||
| GADD45A | GAACATGTCTAAGCATGCTG | 0.18 | 0.22 | 0.20 | 0.25 | 0.15 | (10–13) |
| rrm2b (p53R2) | TGACATGCCCAGGCATGTCT | 0.16 | 0.16 | 0.22 | 0.33 | 0.14 | (10–13) |
| PCNA | ACATATGCCCGGACTTGTTC | 0.17 | 0.26 | 0.20 | 0.22 | 0.15 | (12) |
| Pcna | GAACAAGTCCGGGCATATGT | 0.17 | 0.18 | 0.30 | 0.21 | 0.15 | (10–13) |
| Average | 0.17 | 0.20 | 0.23 | 0.25 | 0.15 | ||
| Standard deviation | 0.01 | 0.06 | 0.05 | 0.06 | 0.01 | ||
| Apoptosis | |||||||
| Bax-A | TCACAAGTTA g AGACAAGCCT | 0.19 | 0.18 | 0.22 | 0.19 | 0.22 | (10–12) |
| BAX-B,A | AGACAAGCCTGGGCGTGGGC | 0.17 | 0.21 | 0.21 | 0.29 | 0.13 | (10) |
| BAX-mouse | AGGCAAGCTT t GAACTTGCGG | 0.19 | 0.21 | 0.20 | 0.19 | 0.22 | (24) |
| BAX-human | GGGCAGGCCCGGGCTTGTCG | 0.15 | 0.23 | 0.17 | 0.37 | 0.10 | (24) |
| IRDD | AAGCTGGGCCGGGCTGACCC | 0.14 | 0.21 | 0.17 | 0.39 | 0.09 | (12) Cathepsin D site 1, (11) |
| IRDD | AACCTTGGTT tg CAAGAGGCTT | 0.19 | 0.19 | 0.22 | 0.19 | 0.22 | (11) |
| ei24/PIG8 | TGGCAGGCCGGAGCTAGTTC | 0.16 | 0.23 | 0.18 | 0.32 | 0.11 | (11) |
| IGFBP3 A,A | AAACAAGCCA c CAACATGCTT | 0.19 | 0.19 | 0.22 | 0.23 | 0.18 | (10–13) |
| IGFBP3 B,A | GGGCAAGACCTGCCAAGCCT | 0.13 | 0.16 | 0.17 | 0.46 | 0.08 | (12) IGF-BP3, Box B in (11) |
| MCG10, RE-1 | GGTCTTGGCC ca GACTTAGCAC | 0.18 | 0.19 | 0.21 | 0.19 | 0.22 | (11) |
| MCG10, RE-1 (PCBB4) | GAACTTAAGA ccgaggctct GGACAAGTTG | 0.18 | 0.24 | 0.17 | 0.21 | 0.20 | (12) |
| NOXA | AGGCTTGCCCCGGCAAGTTG | 0.16 | 0.19 | 0.20 | 0.31 | 0.14 | (10,11,13) |
| p53aip1 | TCTCTTGCCCGGGCTTGTCG | 0.17 | 0.18 | 0.27 | 0.22 | 0.17 | (12,13) |
| PERP, 218 | GCTCAAGTGT agcctt AGCCATGCTC | 0.18 | 0.19 | 0.23 | 0.17 | 0.23 | (11) |
| PERP, 2097 | GCGCTAGTCC acac AGACTAGATT | 0.18 | 0.17 | 0.25 | 0.20 | 0.19 | (11) |
| TP5313 | CAGCTTGCCCACCCATGCTC | 0.16 | 0.13 | 0.30 | 0.30 | 0.11 | (12) PIG3 in (11) |
| bbc3 (puma-bs2) | CTGCAAGTCCTGACTTGTCC | 0.14 | 0.15 | 0.25 | 0.33 | 0.13 | (12,13) |
| PUMA-BS1 | CTCCTTGCCT t GGGCTAGGCC | 0.18 | 0.16 | 0.26 | 0.13 | 0.27 | (13) |
| pDINP1 | GAACTTGGGGGAACATGTTT | 0.17 | 0.26 | 0.18 | 0.26 | 0.13 | (13) |
| p2rx (P2XM) | GAACAAGGGC at GAGCTTGTCT | 0.19 | 0.21 | 0.19 | 0.24 | 0.17 | (11–13) |
| Ctsd | AACCTTGGTT tg CAAGAGGCTT | 0.19 | 0.19 | 0.22 | 0.19 | 0.22 | (12) |
| cFOS,O | AGGCTTGCCCCGGCAAGTTG | 0.16 | 0.19 | 0.20 | 0.31 | 0.34 | (10) |
| fas | GGACAAGCCCTGACAAGCCA | 0.14 | 0.16 | 0.20 | 0.37 | 0.12 | (12) |
| Average | 0.17 | 0.19 | 0.21 | 0.26 | 0.16 | ||
| Standard deviation | 0.02 | 0.03 | 0.03 | 0.08 | 0.05 | ||
| Positive regulation | |||||||
| SCARA | GGGCAAGCCCAGACAAGTTG | 0.16 | 0.21 | 0.19 | 0.30 | 0.14 | (12). CSR in(11) |
| mdm2 | AGTTAAGTCCTGACTTGTCT | 0.14 | 0.22 | 0.17 | 0.34 | 0.14 | (12) |
| MDM2-RE2 | GAGCT a AGTCCTGACATGTCT | 0.14 | 0.13 | 0.20 | 0.41 | 0.12 | (10) |
| mdm2 | GGTCAAGTTGGGACACGTTC | 0.15 | 0.19 | 0.19 | 0.35 | 0.13 | (13) |
| mdr1b | GAACATGTAGAGACATGTCT | 0.16 | 0.21 | 0.17 | 0.33 | 0.14 | (11) |
| PA26 | GGACAAGTCTCCACAAGTTC | 0.16 | 0.19 | 0.22 | 0.29 | 0.14 | (11) |
| PA26,C | GGACATGTCTCAACAAGTTC | 0.16 | 0.19 | 0.22 | 0.27 | 0.16 | (10) |
| RGC,O | GGACTTGCCTGGCCTTGCCT | 0.14 | 0.16 | 0.21 | 0.39 | 0.11 | (10) |
| RGC | TGCCTTGCCT ggact TGCCTGGCCT TGCCT | 0.18 | 0.15 | 0.28 | 0.19 | 0.20 | (11) |
| S100A2 | GGGCATGTGTGGGCACGTTC | 0.16 | 0.26 | 0.16 | 0.30 | 0.13 | (12) |
| mmP2 | AGACAAGCCTGAACTTGTCT | 0.15 | 0.16 | 0.18 | 0.39 | 0.12 | (12); Type IV Collagenase (11) |
| Average | 0.01 | 0.04 | 0.03 | 0.06 | 0.02 | ||
| Standard deviation | 0.17 | 0.21 | 0.23 | 0.22 | 0.17 | ||
| Negative regulation | |||||||
| Bdk | GGAAGTGCCCAGGAGGCTGA | 0.17 | 0.21 | 0.23 | 0.22 | 0.17 | (12), BK2 in (11) |
| GPX | GGGCCAGACCAGACATGCCT | 0.13 | 0.16 | 0.18 | 0.43 | 0.10 | (11) |
| cFOS,O | GGACTTGTCTGAGCGCGTGC | 0.16 | 0.25 | 0.20 | 0.24 | 0.15 | (10) |
| Met | GGACGGACAG cacgcgaggcagac AGACACGTGC | 0.19 | 0.26 | 0.10 | 0.29 | 0.16 | (12) |
| Cytokeratin 8 | CCGCCTGCCT cc ACTCCTGCCT | 0.18 | 0.07 | 0.35 | 0.20 | 0.20 | (11) |
| Dickkopf-1 | AGCCAAGCCT ttaatg AACCAAGTTC | 0.19 | 0.17 | 0.24 | 0.20 | 0.21 | (11) |
| EEf1A1 | GGGCAGACCC ga GAGCATGCCC | 0.19 | 0.21 | 0.19 | 0.22 | 0.19 | (12) EF-1 α E4 in (11) |
| EEf1A1 | GGACACGTAG attc GGGCAAGTCC | 0.19 | 0.22 | 0.19 | 0.19 | 0.21 | (12); EF-1 α, E2 in (11) |
| EEf1A1 | AAACATGATT ac AGGGACATCT | 0.18 | 0.25 | 0.16 | 0.25 | 0.16 | EF-1 α E3 in (11) |
| EGFR | GAGCTAGACG tcc GGGCAGCCCC | 0.31 | 0.22 | 0.14 | 0.19 | 0.15 | (12) |
| CX3 (Fractalkine) | GGGCATGTTC c CAGCTTGTGG | 0.18 | 0.20 | 0.21 | 0.20 | 0.21 | (11,12) |
| HGF | ACACATGTAT ttt CCTGTTTAAA | 0.29 | 0.18 | 0.23 | 0.18 | 0.13 | (11,12) |
| HIC-1 | GGTCTTGTGC ag AGGCATGTGC | 0.19 | 0.20 | 0.20 | 0.18 | 0.24 | (11) |
| M-PGAM | TGCCACTGGTTGCCTGCCTCTGCCT | 0.14 | 0.10 | 0.24 | 0.43 | 0.08 | (11) |
| MCK | GGGCCTGCCTCTCTCTGCCT | 0.14 | 0.10 | 0.22 | 0.47 | 0.08 | (11) |
| SERPine1 | ACACATGCCTCAGCAAGTCC | 0.17 | 0.17 | 0.24 | 0.27 | 0.16 | (12) PAI-1 in (11) |
| Sgk | AACTC AGGCT gcctcctg CGACTTGCCT | 0.21 | 0.16 | 0.29 | 0.20 | 0.14 | (11) |
| sm α actin | AACCATGCCTGCATCTGCCT | 0.16 | 0.12 | 0.24 | 0.39 | 0.10 | (11) |
| TAP1 | GGGCTTGGCC ctgccg GGACTTGCCT | 0.18 | 0.20 | 0.23 | 0.21 | 0.18 | (11,12) |
| THBs2 | AGCCA g AGGCC agaaagtg AGGCTTGCTC | 0.20 | 0.22 | 0.21 | 0.19 | 0.18 | (12); THBS2, 4156 in (11) |
| THBs2 | AGACTTGCCT gattct GGGCT gcc AGATT | 0.18 | 0.20 | 0.23 | 0.19 | 0.21 | (12); THBS2, 3530 in (11) |
| TIMP-3 | GGGCTTGCTT gacgtcca GAACAGGGTC | 0.19 | 0.22 | 0.18 | 0.17 | 0.25 | (11) |
| SERPI (Maspin) | GAACATGTTG g AGGCCTTTTT | 0.189 | 0.184 | 0.222 | 0.224 | 0.181 | (11–13) |
| cds2 | AGGCAAGCTG gggca GCTCAAGCCT | 0.189 | 0.19 | 0.22 | 0.247 | 0.154 | (12) KAI1 in (11,13) |
| Average | 0.19 | 0.19 | 0.21 | 0.25 | 0.17 | ||
| Standard deviation | 0.04 | 0.05 | 0.05 | 0.09 | 0.05 | ||
| Mitosis | |||||||
| PLK2 | GGTCATGATT cct TAACTTGCCT | 0.31 | 0.23 | 0.14 | 0.19 | 0.13 | (12) |
| PLK2 | AAACATGCCTGGACTTGCCC | 0.18 | 0.18 | 0.27 | 0.38 | 0.14 | (12) |
| PLK2 | AGACATGGTG tgt AAACTAGCTT | 0.30 | 0.17 | 0.19 | 0.21 | 0.13 | (12) |
| Average | 0.26 | 0.19 | 0.20 | 0.26 | 0.13 | ||
| Human Repressor | |||||||
| TRPM | GGCCTTGCCT tgctc AGGCCTGCTT | 0.19 | 0.16 | 0.27 | 0.19 | 0.19 | (12) |
| TRPM | TGCCTTGCTCAGGCCTGCTT | 0.16 | 0.13 | 0.27 | 0.32 | 0.12 | (12) |
| TRPM | GAGCAGGTCT gacctgcttccca GGGCCTGCTT | 0.19 | 0.19 | 0.23 | 0.24 | 0.16 | (12) |
| TRPM | TGACCTGCTT ccca GGGCCTGCTT | 0.18 | 0.14 | 0.29 | 0.20 | 0.19 | (12) |
| ODC1 | GGGCTCGCCT tggtacagac GAGCGGGCCC | 0.18 | 0.22 | 0.20 | 0.21 | 0.19 | (12) |
| ODC1 | GGACCAGTTC caggc GGGCGAGACC | 0.19 | 0.19 | 0.23 | 0.18 | 0.22 | (12) |
| CRYZ | CTGCAAGTCC att AAACCTGTTT | 0.27 | 0.15 | 0.26 | 0.17 | 0.14 | (12) |
| slc38 | AACCATGCTG ttacacgcac CAGCTTGTCC | 0.18 | 0.18 | 0.24 | 0.20 | 0.19 | (12) |
| p22/PRG1 | CCACATGCCTCGACATGTGC | 0.19 | 0.16 | 0.30 | 0.16 | 0.19 | (11), IER3 in(12) |
| ANLN | GAACTGGCTT ttctga GGGCCAGGCC | 0.17 | 0.21 | 0.21 | 0.22 | 0.19 | (12) |
| scd | GGGCCGGTCC t GGGCTAGGCT | 0.19 | 0.21 | 0.21 | 0.18 | 0.22 | (12) |
| Hspa8 | GCACTAGTTC tggacctc GCGCGTGCTT | 0.18 | 0.14 | 0.28 | 0.22 | 0.18 | (12) |
| NOS3 | GAGCCTCCCA gcc GGGCTTGTTC | 0.28 | 0.16 | 0.25 | 0.17 | 0.15 | (12) |
| CDC25C | GGGCAAGTCT taccatttcca GAGCAAGCAC | 0.18 | 0.23 | 0.19 | 0.18 | 0.22 | (12) |
| Average | 0.19 | 0.18 | 0.25 | 0.20 | 0.18 | ||
| Standard deviation | 0.03 | 0.03 | 0.03 | 0.04 | 0.03 | ||
REFERENCES
- 1.Vogelstein B., Lane D., Levine A.J. Surfing the p53 network. Nature. 2000;408:307–310. doi: 10.1038/35042675. [DOI] [PubMed] [Google Scholar]
- 2.El-Deiry W.S., Kern S.E., Pietenpol J.A., Kinzler K.W., Vogelstein B. Definition of a consensus binding site for p53. Nat. Genet. 1992;1:45–49. doi: 10.1038/ng0492-45. [DOI] [PubMed] [Google Scholar]
- 3.Janz C., Susse S., Wiesmuller L. p53 and recombination intermediates: role of tetramerization at DNA junctions in complex formation and exonucleolytic degradation. Oncogene. 2002;21:2130–2140. doi: 10.1038/sj.onc.1205292. [DOI] [PubMed] [Google Scholar]
- 4.Wei C.L., Wu Q., Vega V.B., Chiu K.P., Ng P., Zhang T., Shahab A., Yong H.C., Fu Y., et al. A global map of p53 transcription-factor binding sites in the human genome. Cell. 2006;124:207–219. doi: 10.1016/j.cell.2005.10.043. [DOI] [PubMed] [Google Scholar]
- 5.Cho Y., Gorina S., Jeffrey P.D., Pavletich N.P. Crystal structure of a p53 tumor suppressor-DNA complex: understanding tumorigenic mutations. Science. 1994;265:346–355. doi: 10.1126/science.8023157. [DOI] [PubMed] [Google Scholar]
- 6.Kitayner M., Rozenberg H., Kessler N., Rabinovich D., Shaulov L., Haran T.E., Shakked Z. Structural basis of DNA recognition by p53 tetramers. Mol. Cell. 2006;22:741–753. doi: 10.1016/j.molcel.2006.05.015. [DOI] [PubMed] [Google Scholar]
- 7.Ho W.C., Fitzgerald M.X., Marmorstein R. Structure of the p53 core domain dimer bound to DNA. J. Biol. Chem. 2006;281:20494–20502. doi: 10.1074/jbc.M603634200. [DOI] [PubMed] [Google Scholar]
- 8.Ma B., Pan Y., Gunasekaran K., Venkataraghavan R.B., Levine A.J., Nussinov R. Comparison of the protein-protein interfaces in the p53-DNA crystal structures: towards elucidation of the biological interface. Proc. Natl Acad. Sci. USA. 2005;102:3988–3993. doi: 10.1073/pnas.0500215102. [DOI] [PMC free article] [PubMed] [Google Scholar]
- 9.Zhao R., Gish K., Murphy M., Yin Y., Notterman D., Hoffman W.H., Tom E., Mack D.H., Levine A.J. The transcriptional program following p53 activation. Cold Spring Harb. Symp. Quant. Biol. 2000;65:475–482. doi: 10.1101/sqb.2000.65.475. [DOI] [PubMed] [Google Scholar]
- 10.Inga A., Storici F., Darden T.A., Resnick M.A. Differential transactivation by the p53 transcription factor is highly dependent on p53 level and promoter target sequence. Mol. Cell. Biol. 2002;22:8612–8625. doi: 10.1128/MCB.22.24.8612-8625.2002. [DOI] [PMC free article] [PubMed] [Google Scholar]
- 11.Qian H., Wang T., Naumovski L., Lopez C.D., Brachmann R.K. Groups of p53 target genes involved in specific p53 downstream effects cluster into different classes of DNA binding sites. Oncogene. 2002;21:7901–7911. doi: 10.1038/sj.onc.1205974. [DOI] [PubMed] [Google Scholar]
- 12.Lim Y.P., Lim T.T., Chan Y.L., Song A.C., Yeo B.H., Vojtesek B., Coomber D., Rajagopal G., Lane D. The p53 knowledgebase: an integrated information resource for p53 research. Oncogene. 2007;26:1517–1521. doi: 10.1038/sj.onc.1209952. [DOI] [PubMed] [Google Scholar]
- 13.Weinberg R.L., Veprintsev D.B., Bycroft M., Fersht A.R. Comparative binding of p53 to its promoter and DNA recognition elements. J. Mol. Biol. 2005;348:589–596. doi: 10.1016/j.jmb.2005.03.014. [DOI] [PubMed] [Google Scholar]
- 14.Hoh J., Jin S., Parrado T., Edington J., Levine A.J., Ott J. The p53MH algorithm and its application in detecting p53-responsive genes. Proc. Natl Acad. Sci. USA. 2002;99:8467–8472. doi: 10.1073/pnas.132268899. [DOI] [PMC free article] [PubMed] [Google Scholar]
- 15.Miled C., Pontoglio M., Garbay S., Yaniv M., Weitzman J.B. A genomic map of p53 binding sites identifies novel p53 targets involved in an apoptotic network. Cancer Res. 2005;65:5096–5104. doi: 10.1158/0008-5472.CAN-04-4232. [DOI] [PubMed] [Google Scholar]
- 16.Barenco M., Tomescu D., Brewer D., Callard R., Stark J., Hubank M. Ranked prediction of p53 targets using hidden variable dynamic modeling. Genome Biol. 2006;7:R25. doi: 10.1186/gb-2006-7-3-r25. [DOI] [PMC free article] [PubMed] [Google Scholar]
- 17.Favorov A.V., Gelfand M.S., Gerasimova A.V., Ravcheev D.A., Mironov A.A., Makeev V.J. A Gibbs sampler for identification of symmetrically structured, spaced DNA motifs with improved estimation of the signal length. Bioinformatics. 2005;21:2240–2245. doi: 10.1093/bioinformatics/bti336. [DOI] [PubMed] [Google Scholar]
- 18.Kim E., Albrechtsen N., Deppert W. DNA-conformation is an important determinant of sequence-specific DNA binding by tumor suppressor p53. Oncogene. 1997;15:857–869. doi: 10.1038/sj.onc.1201412. [DOI] [PubMed] [Google Scholar]
- 19.Urh M., Wu J., Forest K., Inman R.B., Filutowicz M. Assemblies of replication initiator protein on symmetric and asymmetric DNA sequences depend on multiple protein oligomerization surfaces. J. Mol. Biol. 1998;283:619–631. doi: 10.1006/jmbi.1998.2120. [DOI] [PubMed] [Google Scholar]
- 20.Kruger R., Rakowski S.A., Filutowicz M. Isomerization and apparent DNA bending by pi, the replication protein of plasmid R6K. Biochem. Biophys. Res. Commun. 2004;313:834–840. doi: 10.1016/j.bbrc.2003.12.022. [DOI] [PubMed] [Google Scholar]
- 21.Conlon F.L., Fairclough L., Price B.M., Casey E.S., Smith J.C. Determinants of T box protein specificity. Development. 2001;128:3749–3758. doi: 10.1242/dev.128.19.3749. [DOI] [PubMed] [Google Scholar]
- 22.Verrijdt G., Tanner T., Moehren U., Callewaert L., Haelens A., Claessens F. The androgen receptor DNA-binding domain determines androgen selectivity of transcriptional response. Biochem. Soc. Trans. 2006;34:1089–1094. doi: 10.1042/BST0341089. [DOI] [PubMed] [Google Scholar]
- 23.Callewaert L., Verrijdt G., Haelens A., Claessens F. Differential effect of small ubiquitin-like modifier (SUMO)-ylation of the androgen receptor in the control of cooperativity on selective versus canonical response elements. Mol. Endocrinol. 2004;18:1438–1449. doi: 10.1210/me.2003-0313. [DOI] [PubMed] [Google Scholar]
- 24.Thornborrow E.C., Patel S., Mastropietro A.E., Schwartzfarb E.M., Manfredi J.J. A conserved intronic response element mediates direct p53-dependent transcriptional activation of both the human and murine bax genes. Oncogene. 2002;21:990–999. doi: 10.1038/sj.onc.1205069. [DOI] [PubMed] [Google Scholar]
- 25.Wang Y., Schwedes J.F., Parks D., Mann K., Tegtmeyer P. Interaction of p53 with its consensus DNA-binding site. Mol. Cell. Biol. 1995;15:2157–2165. doi: 10.1128/mcb.15.4.2157. [DOI] [PMC free article] [PubMed] [Google Scholar]
- 26.Fitzgerald P.C., Sturgill D., Shyakhtenko A., Oliver B., Vinson C. Comparative genomics of Drosophila and human core promoters. Genome. Biol. 2006;7:R53. doi: 10.1186/gb-2006-7-7-r53. [DOI] [PMC free article] [PubMed] [Google Scholar]
- 27.FitzGerald P.C., Shlyakhtenko A., Mir A.A., Vinson C. Clustering of DNA sequences in human promoters. Genome. Res. 2004;14:1562–1574. doi: 10.1101/gr.1953904. [DOI] [PMC free article] [PubMed] [Google Scholar]
- 28.McGuire A.M., Hughes J.D., Church G.M. Conservation of DNA regulatory motifs and discovery of new motifs in microbial genomes. Genome Res. 2000;10:744–757. doi: 10.1101/gr.10.6.744. [DOI] [PubMed] [Google Scholar]
- 29.Tada M., Smith J.C. T-targets: clues to understanding the functions of T-box proteins. Dev. Growth Differ. 2001;43:1–11. doi: 10.1046/j.1440-169x.2001.00556.x. [DOI] [PubMed] [Google Scholar]
- 30.Weinberg R.L., Veprintsev D.B., Fersht A.R. Cooperative binding of tetrameric p53 to DNA. J. Mol. Biol. 2004;341:1145–1159. doi: 10.1016/j.jmb.2004.06.071. [DOI] [PubMed] [Google Scholar]
- 31.Ma B., Elkayam T., Wolfson H., Nussinov R. Protein-protein interactions: structurally conserved residues distinguish between binding sites and exposed protein surfaces. Proc. Natl Acad. Sci. USA. 2003;100:5772–5777. doi: 10.1073/pnas.1030237100. [DOI] [PMC free article] [PubMed] [Google Scholar]
- 32.Ma B., Pan Y., Gunasekaran K., Keskin O., Venkataraghavan R.B., Levine A.J., Nussinov R. The contribution of the Trp/Met/Phe residues to physical interactions of p53 with cellular proteins. Phys. Biol. 2005;2:S56–S66. doi: 10.1088/1478-3975/2/2/S06. [DOI] [PubMed] [Google Scholar]
- 33.Lilyestrom W., Klein M.G., Zhang R., Joachimiak A., Chen X.S. Crystal structure of SV40 large T-antigen bound to p53: interplay between a viral oncoprotein and a cellular tumor suppressor. Genes Dev. 2006;20:2373–2382. doi: 10.1101/gad.1456306. [DOI] [PMC free article] [PubMed] [Google Scholar]
- 34.Lee S., Cavallo L., Griffith J. Human p53 binds Holliday junctions strongly and facilitates their cleavage. J. Biol. Chem. 1997;272:7532–7539. doi: 10.1074/jbc.272.11.7532. [DOI] [PubMed] [Google Scholar]
- 35.Holliday R. Mechanism for gene conversion in fungi. Genet. Res. 1964;5:282–304. doi: 10.1017/S0016672308009476. [DOI] [PubMed] [Google Scholar]
Associated Data
This section collects any data citations, data availability statements, or supplementary materials included in this article.