

Abstract
In a prospective study of 152 HIV-1 patients (with and without progression to AIDS) we examined CD28 MoAb costimulation and CD3 MoAb response using whole blood culture at baseline and up to either the time of AIDS diagnosis or the end of the observation period. CD28 antigen expression on both CD4+ and CD8+ T lymphocytes was also studied in both groups of patients. In patients who progressed to AIDS, CD28 MoAb costimulation was found to be decreased. Univariate time-dependent analysis showed that decreases in (i) absolute numbers of either CD4+, CD4+CD28+, CD8+CD28+ T cells, (ii) CD28 MoAb costimulation, and (iii) CD3 MoAb response, and an increase in CD8+CD28− %, are significant predictors for progression to AIDS. In addition, multivariate time-dependent analysis demonstrated that a decrease in CD28 MoAb costimulation (but not a decrease in CD3 MoAb response) was predictive for progression to AIDS, as were decreases in the percentage of CD4+ T cells and the absolute number of CD4+CD28+ T cells. Thus, CD28 MoAb costimulation can be considered a useful assay for monitoring HIV-1 infection. Furthermore, apart from the early increase in the percentage of CD8+CD28− T cells and an increase in the percentage of CD28− on CD8+ T cells in both groups of patients at baseline compared with normal controls, a negative correlation was found to exist between the percentages of CD4+ or CD4+CD28+ T cells and the percentage of CD8+CD28− T cells; this suggests that these cells are probably mutually regulated.
Keywords: HIV-1, CD28 costimulation, CD28 expression, predictive value, correlation
INTRODUCTION
HIV-1 infection produces a prolonged gradually progressive disease. Immune and viral factors [1,2] together with genetic factors (e.g. HLA type) [3] and the recently identified co-receptors for HIV-1 [4,5] influence the clinical course of HIV-1 infection. One of the major characteristics of HIV infection is the progressive depletion of CD4+ T cells [6] which is associated with the development of opportunistic infections. In addition, both CD4+ and CD8+ T cells display phenotypical and functional signs of excessive activation and anergy [7–9]. Functional T cell defects are observed before peripheral blood CD4+ T cell numbers start to decline [10,11]. During the asymptomatic phase, there is a progressive loss of proliferative responses of both CD4+ and CD8+ T cells to soluble CD3 MoAb and pokeweed mitogen (PWM), while responses to phytohaemagglutinin (PHA) are unaffected [12–14]. Shearer et al. [15] demonstrated a progressive loss of T cell reactivity: first in response to recall antigens, followed by decreased responses to alloantigens and finally a decreased response to PHA. In HIV-1-infected subjects, we [16] and others [17–22] have reported decreased CD28 expression on T cells, possibly contributing to the T cell defects in these individuals; it has been demonstrated that CD8+CD28− T cells are unresponsive to in vitro stimulation with mitogens [19]. Furthermore, T cell responses, using cryopreserved peripheral blood mononuclear cells (PBMC), to CD3 MoAb plus CD28 MoAb have been reported to be predictors for AIDS development [23].
Today, despite the decline in HIV-1 RNA levels as a result of highly active anti-retroviral treatment (HAART) [24,25], complete immune reconstitution during HAART has generally not been observed and further understanding is required regarding the current models of HIV pathogenesis and treatment [25,26]. Recently, the recovery of lymphocyte proliferative responses in HIV-1-infected patients has been used as an indicator of successful anti-retroviral treatment [27–30]. Optimal monitoring of the patient requires combined virological and immunological markers, both phenotypic and functional, since patient management and treatment decisions should not be based on viral RNA measurements alone; HIV-1 RNA levels have been shown to be less important in predictive value later in infection [29,30].
The objective of this study was to assess CD28 MoAb costimulation and CD3 MoAb response by the easy-to-use whole blood culture method in two groups of patients: (i) in AIDS-free subjects who later progressed to AIDS, measuring at the first visit (baseline) and up to the time of AIDS diagnosis, and (ii) in subjects who had not progressed to AIDS either at baseline or by the end of the observation period. In both groups we also studied CD28 antigen expression on both CD4+ and CD8+ T lymphocytes as well as the correlation between CD4+ and CD8+ T cell subsets. Furthermore, we investigated the predictive value of these parameters for progression to AIDS.
MATERIALS AND METHODS
Patients
The study population consisted of 152 HIV-1-infected AIDS-free individuals who were classified according to the Centre for Disease Control Classification (CDC 1993) [31] (A1 59 patients, A2 64 patients, B1 one patient, B2 28 patients; males 122, females 30; median age 38 years; homosexuals 101, heterosexuals 51). Mean follow up was 3·4 years. HIV-1 infection was identified by a routine blood screening procedure and confirmed by Western blot analysis. For reasons of comparison, we also studied 100 cases with AIDS (CDC 1993) [31] at the first visit. The study was carried out between January 1992 and July 1998. CD28 MoAb costimulation and CD3 MoAb responses were measured from the end of 1994 onwards. Patients who had progressed to AIDS (n = 15) up to the end of 1994 and patients who had not undergone stimulation tests (n = 7) were not considered in the CD28 costimulation analysis. Clinical data were collected and blood was sampled in the morning of each day at 3–6 monthly intervals. At the end of the study, 106/152 patients had not progressed to AIDS (PWTA) and 46/152 had progressed to AIDS (PWA). One hundred and twenty-nine/152 had not received anti-retroviral treatment prior to their first visit. The remaining patients (23/152) had all received nucleoside analogues (AZT/ddc, ddi, 3TC) and one of the latter patients had also received one protease inhibitor; of these 23 patients, nine progressed to AIDS. After mid-1996 33/106 of the patients who had not progressed to AIDS (7/33 had been pretreated with nucleoside analogues since 1992 and are included in the above-mentioned 23 patients) received triple drug combination therapy (HAART) with the addition of a protease inhibitor (indinavir or saquinavir or ritonavir). Fifteen, 14 and four patients underwent this therapy for < 3, > 6 and > 12 months, respectively. None of the 46 patients who progressed to AIDS had received HAART up to the time of AIDS diagnosis.
Normal controls
Seven hundred and thirty-one healthy controls (males 410, females 321, median age 31 years) were studied in the lymphoproliferative assays (three individuals per day); 38 healthy controls (males 22, females 16, median age 36 years) were also studied in the immunophenotyping and lymphoproliferative assays.
CD28 costimulation
Whole blood cultures, as described in the literature [32,33], were set up to test lymphocyte reactivity to CD28 MoAb. Whole heparinized blood (diluted 1:10 with culture medium) was cultured for 4 days with CD3 MoAb (CLB/T3-4E; CLB, Amsterdam, The Netherlands; final dilution of ascitic fluid was 1:10 000) in the absence or presence of CD28 MoAb (CLB-CD28/1; CLB; final dilution of ascitic fluid 1:5000). For lymphoproliferative responses to CD28 + CD3 MoAbs and CD3 MoAb alone, the method which was used in the European Community Concerted Action on Progression Markers in HIV infection co-ordinated by F. Miedema (Department of Clinical Viroimmunology, CLB) was applied.
The CD3 MoAb response was tested in order to estimate its predictive value in comparison with the predictive value of CD28 MoAb + CD3 MoAb costimulation.
All cultures were set up in triplicate. After 3 days of culture at 37°C in humidified air at 5% CO2, 20 μl tritiated thymidine (3H-TdR), specific activity 6·7 Ci/mmol (ICN Pharmaceuticals, CA) were added to each well, and after a further 24 h cells were harvested onto glassfibre filters by a cell harvester (Skatron Model 11055; Norway). Incorporated radioactivity was measured in a scintillation counter and expressed as ct/min. 3H-TdR uptake in whole blood cultures was corrected for the number of CD3+ T lymphocytes contained in the culture and expressed as ct/min per 103 T cells. T cell responses were also expressed as the percentage ct/min of the median responses of three healthy controls cultured simultaneously (ct/min percentage controls).
Immunophenotyping
Lymphocyte markers were measured in EDTA anti-coagulated whole blood samples by direct double or triple immunofluorescence (CD3, CD8, CD28) using a panel of MoAbs (Becton Dickinson) and flow cytometry (FACScan/FACS Calibur), as described previously [16]. The lymphocyte count and subset evaluation were performed < 3 h after blood collection. Whole blood leucocyte and differential counts were performed using a Sysmex-1000 haematology analyser. The absolute number (T cells/μl) of each subset was also determined. Results were also expressed as the proportion: CD8+CD28−/CD8+× 100 or as the percentage of CD28− on CD8+ T cells (CD8+ T cells which were CD28−).
Statistical analysis
Box and whisker plots were used for the graphical comparison of the distribution of several data groups. The non-parametric Mann–Whitney U-test was used to compare T cell responses in healthy controls and both groups (PWTA and PWA) of HIV-1-infected subjects at the same time point; the Wilcoxon non-parametric test was used to compare data obtained at different time points of the infection in the same subjects. Cox proportional hazards analysis was used to study the predictive value of immunological parameters both at baseline and by time-dependent covariates. An analysis excluding patients on HAART who did not progress to AIDS was also used. Multiple regression analysis was performed. The level of significance was P = 0·05. The analysis was performed using the STATISTICA system. For Cox regression models the SAS system was used.
RESULTS
Loss of CD28 costimulation in HIV-1-infected subjects who progressed to AIDS
Results of HIV-1-infected individuals are shown at baseline and at the end of the study (Fig. 1a). No significant difference was observed between PWTA at baseline and at the end of the observation period, as the T cell responses to CD28 MoAb were well preserved (P = 0·26). However, in PWA there was a significant difference in CD28 MoAb response in ct/min (P < 0·01) and ct/min per 1000 CD3+ T cells (P < 0·01) between baseline and the time of AIDS diagnosis.
Fig. 1.
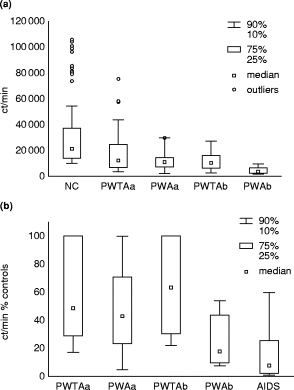
(a) T cell responses to CD28 MoAb in patients without (PWTA) and with (PWA) progression to AIDS at (a) baseline and (b) at the end of the observation period or at time of AIDS diagnosis. (b) T cell reactivity to CD28 MoAb in the above HIV-1+ groups expressed as ct/min % of the median of three controls per day. Patients who presented with AIDS from the time of the first visit are also included.
Figure 1b shows also the response to CD28 MoAb expressed as ct/min percentage of the median value from the controls. T cell responses in PWTA between baseline and the end of the observation period were well preserved (P = 0·31), while the T cell responses of PWA deteriorated further with the development of AIDS (P < 0·01). The differences in T cell responses between the end of the observation period of PWTA and PWA at the time of AIDS diagnosis were significant (P < 0·000 01). There was also a significant difference in T cell responses between PWA at the time of AIDS diagnosis and those patients who had AIDS at the time of the first visit (P < 0·01).
CD28 expression in CD4+ and CD8+ T lymphocytes in HIV-1-infected subjects who progressed to AIDS
There was no statistical difference in the percentages and absolute numbers of CD4+CD28+, CD8+CD28+ and CD8+CD28− T lymphocytes in PWTA, between baseline and the end of the study. PWTA compared with PWA at baseline had higher CD4+ and CD4+CD28+ T lymphocytes both in percentage and absolute numbers (Table 1). In PWA, between baseline and the time of AIDS diagnosis there was a significant difference with regard to almost all T lymphocyte subsets (Table 1). Compared with normal controls (NC) (data not shown) at baseline, both PWTA and PWA showed significant differences in all subsets, including (i) a significant increase in CD8+CD28− % and (ii) an increase in the percentage of CD28− on CD8+ T cells (median NC, 50%, P < 0·0001 versus PWTA, P < 0·000 001 versus PWA).
Table 1.
CD28 antigen expression on CD4+ and CD8+ T lymphocytes in patients without (PWTA) and with (PWA) progression to AIDS
| PWTAa baseline | PWAa baseline | PWTAb End of observation period | PWAb Time of AIDS diagnosis | AIDS§ | |
|---|---|---|---|---|---|
| CD4+ % | 25·5†† | 20·5*** | 25·0†††† | 15·0‡ | 8·0 |
| CD4 an/μl | 478·3†††† | 332·8**** | 491·0†††† | 184·3‡ | 91·0 |
| CD4+CD28+ % | 23·0† | 18·0** | 23·0†††† | 13·0‡ | 6·0 |
| CD4+CD28+ an/μl | 425·0††† | 297·4*** | 442·5†††† | 164·4‡ | 59·0 |
| CD8+ % | 52·0 | 57·0** | 52·0††† | 62·0 | 59·5 |
| CD8+ an/μl | 1066·7 | 1031·4*** | 1070·4†† | 896·8‡‡ | 704·9 |
| CD8+CD28+ % | 21·0 | 22·0 | 21·0 | 18·0‡‡‡‡ | 18·0 |
| CD8+CD28+ an/μl | 404·6 | 326·0*** | 418·0†††† | 251·3‡ | 184·8 |
| CD8+CD28− % | 33·0 | 38·0* | 32·0††† | 42·0 | 41·0 |
| CD8+CD28− an/μl | 628·9 | 654·2** | 674·6† | 546·8‡‡‡ | 437·0 |
| % CD28− on CD8+ | 61·0 | 63·3* | 61·0†† | 67·6‡‡‡‡ | 68·4 |
Data represent median.
an, Absolute numbers.
P, Wilcoxon in paired groups.
P, Mann–Whitney in unpaired groups.
Patients presented with AIDS in the first visit
PWTAa versus PWAa:
P < 0·000 005
P < 0·000 02
P < 0·0007
P <0·006
PWTAb versus PWAb
P <0·000 0001
P <0·0002
P <0·001
P <0·05
PWAa versus PWAb
P <0·000 0001
P <0·0002
P <0·002
P <0·04
PWAb versus AIDS
P <0·000 01
P <0·000 07
P <0·003
P <0·04
Differences were also observed between PWTA at the end of the observation period and PWA at the time of AIDS diagnosis: CD4+CD28+ T lymphocytes in PWTA versus PWA were higher in percentage and in absolute numbers, whereas the CD8+CD28− % and the percentage of CD28− cells on CD8+ T lymphocytes were significantly lower (Table 1). Also PWA at the time of AIDS diagnosis, compared with patients who presented with AIDS at the time of the first visit, showed significant differences with regard to most lymphocyte subsets (Table 1).
Regression analysis showed a significant negative correlation (Table 2) between the percentages of CD4+ or CD4+CD28+ cells compared with the percentage of CD8+CD28− T cells in both groups of patients as well as in NC (except in NC for CD4+CD28+ b = −0·447, P = NS). In the PWA group a positive correlation was seen between the percentages of CD4+ or CD4+ CD28+ cells compared with the percentage of CD8+CD28+ cells.
Table 2.
Derived parameter estimate (b) from simple regression analysis between CD4+ and CD8+ T cell subsets in patients without and with progression to AIDS and normal controls (NC)
| Dependent variable | Predicted variable | PWTA b P value | PWA b P value | NC b P value |
|---|---|---|---|---|
| CD4 % | CD8+CD28+ % | −0·037 | 0·343 | −0·001 |
| NS | P < 0·03 | NS | ||
| CD8+CD28− % | −0·703 | −0·765 | −0·390 | |
| P < 0·000 0001 | P < 0·000 0001 | P < 0·02 | ||
| CD4 an | CD8+CD28+ an | 0·404 | 0·400 | 0·634 |
| P < 0·000 027 | P < 0·01 | P < 0·000 04 | ||
| CD8+CD28− an | 0·091 | −0·156 | 0·412 | |
| NS | NS | P < 0·01 | ||
| CD4+CD28+ % | CD8+CD28+ % | 0·102 | 0·347 | 0·077 |
| NS | P < 0·03 | NS | ||
| CD8+CD28− % | −0·717 | −0·753 | −0·447 | |
| P < 0·000 0001 | P < 0·000 0001 | NS | ||
| CD4+CD28+ an | CD8+CD28+ an | 0·440 | 0·237 | 0·716 |
| P < 0·000 005 | NS | P < 0·0008 | ||
| CD8+CD28− an | −0·002 | −0·338 | 0·371 | |
| NS | P < 0·03 | NS |
PWTA, Patients at baseline not progressing to AIDS; PWA, patients at baseline progressing to AIDS; NS, not significant.
With regard to absolute numbers of cells, there was a significant positive correlation between CD4+ and CD8+CD28+ cells in NC and both groups of patients. A similar correlation existed between CD4+CD28+ cells and CD8+CD28+ cells in NC and PWTA. However, the correlation between CD4+ or CD4+CD28+ and CD8+CD28− cells was positive in NC and negative in the patients who progressed to AIDS. Similar results were obtained by correlation coefficient analysis (data not shown).
Furthermore, in patients who had not progressed to AIDS at baseline, regression analysis demonstrated a significant positive correlation between CD28 MoAb costimulation and CD4+ (b = 0·593, P < 0·03) or CD4+CD28+ (b = 0·606, P < 0·02) absolute numbers, and a significant negative correlation between CD28 MoAb costimulation and CD8+CD28+ % (b = −0·561, P < 0·04) or CD8+CD28− % (b = −0·563, P < 0·04).
Relative hazard for progression to AIDS for individual markers at the baseline level
Table 3 shows the relative hazard determinations for the actual increments of each parameter from baseline. Both the CD4+ and the CD4+CD28+ percentages and absolute numbers were predictors for progression to AIDS. CD8+CD28+ and CD8+CD28− percentages and absolute numbers at baseline were not predictive for AIDS occurrence. However, when the percentages of all the above parameters were included in a multivariate model, only the CD4 % was found to have predictive value for AIDS occurrence. When the same model was used with absolute numbers, only CD4+CD28+ out of all the above parameters was predictive for progression to AIDS.
Table 3.
Relative hazards (RH) and 95% confidence intervals (95% CI) for progression to AIDS derived from Cox regression model at baseline
| Variable | Increment | RH | 95% CI | P |
|---|---|---|---|---|
| Univariate model | ||||
| CD4+ % | 5% less | 1·56 | 1·24 1·97 | 0·0001 |
| CD4+ an | 100 units less | 1·50 | 1·22 1·85 | 0·0001 |
| CD4+CD28+ % | 5% less | 1·41 | 1·07 1·87 | 0·014 |
| CD4+CD28+ an | 100 units less | 1·79 | 1·34 2·39 | 0·0001 |
| CD8+CD28+ % | 5% less | 1·04 | 0·67 1·40 | 0·85 |
| CD8+CD28+ an | 100 units less | 1·08 | 0·86 1·36 | 0·52 |
| CD8+CD28− % | 5% more | 1·15 | 0·98 1·34 | 0·08 |
| CD8+CD28− an | 100 units more | 1·04 | 0·94 1·15 | 0·44 |
| CD28 MoAb ct/min | 3000 units less | 1·03 | 0·85 1·25 | 0·77 |
| CD28 MoAb ct/min per 1000 CD3+ cells | 3000 units less | 1·04 | 0·82 1·32 | 0·76 |
| CD28 MoAb ct/min % controls | 10 units less | 1·10 | 0·85 1·44 | 0·43 |
| CD3 MoAb ct/min | 500 units less | 1·05 | 0·67 1·64 | 0·85 |
| Multivariate model | ||||
| Model 1: % | ||||
| CD4+ | 5% less | 2·77 | 1·16 6·63 | 0·02 |
| CD4+CD28+ | 5% less | 0·63 | 0·26 1·53 | 0·31 |
| CD8+CD28+ | 5% less | 1·25 | 0·83 1·87 | 0·29 |
| CD8+CD28− | 5% more | 0·88 | 0·71 1·09 | 0·25 |
| Model 2: an | ||||
| CD4+ | 100 units less | 0·88 | 0·50 1·55 | 0·65 |
| CD4+CD28+ | 100 units less | 2·44 | 1·21 4·96 | 0·01 |
| CD8+CD28+ | 100 units less | 0·81 | 0·58 1·14 | 0·23 |
| CD8+CD28− | 100 units more | 1·00 | 0·86 1·15 | 0·96 |
an, Absolute number.
On exclusion of patients who received HAART, the analysis yielded similar results except for a CD8+CD28− % increase which was found to be statistically significant (relative hazards (RH) 1·22, P < 0·01).
With regard to CD28 MoAb costimulation, no significant results were found, as the observations at the baseline level were limited.
Relative hazards for progression to AIDS by time-dependent covariates
Relative hazards were also determined by time-dependent covariates (Table 4). Univariate analysis demonstrated that CD4+ and CD4+CD28+ percentages and absolute numbers were predictors of progression to AIDS. A decrease in CD8+CD28+ absolute numbers was also predictive, as was a CD8+CD28− % increase. CD8+CD28− absolute numbers were found to be significantly protective, due to the fact that in patients who progressed to AIDS there was a great difference in the absolute numbers of such lymphocytes between baseline and the time of AIDS diagnosis (PWA at baseline 1828 versus PWA at the time of AIDS diagnosis 1377; P < 0·003); therefore, although the CD8+CD28− % was increased, the absolute number was decreased.
Table 4.
Relative hazards (RH) and 95% confidence intervals (95% CI), for progression to AIDS derived from Cox regression models by time-dependent covariates
| Variable | Increment | RH | 95% CI | P |
|---|---|---|---|---|
| Univariate model | ||||
| CD4+ % | 5% less | 2·77 | 2·05 3·74 | 0·0001 |
| CD4+ an | 100 units less | 4·78 | 2·91 7·87 | 0·0001 |
| CD4+CD28+ % | 5% less | 2·41 | 1·74 3·34 | 0·0001 |
| CD4+CD28+ an | 100 units less | 9·71 | 5·70 16·43 | 0·0001 |
| CD8+CD28+ % | 5% less | 1·14 | 0·83 1·56 | 0·43 |
| CD8+CD28+ an | 100 units less | 1·95 | 1·52 2·51 | 0·0001 |
| CD8+CD28− % | 5% more | 1·25 | 1·09 1·45 | 0·002 |
| CD8+CD28− an | 100 units more | 0·90 | 0·81 0·99 | 0·03 |
| CD28 MoAb ct/min | 3000 units less | 1·45 | 1·20 1·74 | 0·0001 |
| CD28 MoAb ct/min per 1000 CD3 | 3000 units less | 1·34 | 1·11 1·62 | 0·002 |
| CD28 MoAb ct/min % controls | 10 units less | 1·40 | 1·20 1·63 | 0·0001 |
| CD3 MoAb ct/min | 500 units less | 1·33 | 1·05 1·70 | 0·02 |
| Multivariate model | ||||
| Model 1: % | ||||
| CD4+ | 5% less | 3·51 | 1·98 6·20 | 0·0001 |
| CD4+CD28+ | 5% less | 0·85 | 0·45 1·61 | 0·63 |
| CD8+CD28+ | 5% less | 1·10 | 0·80 1·50 | 0·56 |
| CD8+CD28− | 3000 units less | 0·87 | 0·75 1·01 | 0·06 |
| Alternatively introduced | ||||
| additional variable | ||||
| CD28 MoAb ct/min | 5% more | 1·36 | 1·11 1·66 | 0·003 |
| CD28 MoAb ct/min per 1000 CD3 | 3000 units less | 1·12 | 0·91 1·38 | 0·29 |
| CD28 MoAb % ct/min controls | 10 units less | 1·32 | 1·12 1·55 | 0·001 |
| CD3 MoAb ct/min | 500 units less | 1·15 | 0·89 1·49 | 0·29 |
| Model 2: an | ||||
| CD4+ | 100 units less | 0·96 | 0·52 1·78 | 0·91 |
| CD4+CD28+ | 100 units less | 11·90 | 5·98 23·94 | 0·0001 |
| CD8+CD28+ | 100 units less | 0·99 | 0·73 1·35 | 0·97 |
| CD8+CD28− | 100 units more | 0·86 | 0·76 0·97 | 0·01 |
| Alternatively introduced | ||||
| additional variable | ||||
| CD28 MoAb ct/min | 3000 units less | 1·30 | 1·05 1·62 | 0·01 |
| CD28 MoAb ct/min per 1000 CD3 | 3000 units less | 1·26 | 1·02 1·57 | 0·03 |
| CD28 MoAb ct/min % controls | 10 units less | 1·22 | 1·08 1·93 | 0·005 |
| CD3 MoAb ct/min | 500 units less | 1·28 | 0·98 1.66 | 0·07 |
an, Absolute number.
With regard to data obtained from lymphoproliferative assays, CD28 MoAb costimulation was found to be predictive for progression to AIDS both in ct/min, in ct/min per 1000 CD3+ T cells, and ct/min percentage of controls. The CD3 MoAb response was also predictive for progression to AIDS.
However, in the multivariate analysis (Table 4) (model 1: percentages of lymphocyte subsets), when the percentage of all the lymphocyte subsets was used, only CD4+ % was predictive for progression to AIDS. With the addition of each parameter from the functional assays, only CD28 MoAb costimulation was found to be predictive (ct/min and ct/min % of controls) for AIDS development. In the multivariate analysis (model 2: absolute numbers), only a decrease in CD4+CD28+ absolute numbers was predictive for AIDS progression. CD8+CD28− absolute numbers were found to be protective, as in the univariate analysis and probably for the same reason as mentioned above. Furthermore, with the addition of each parameter from the functional assays, the decrease in CD28 MoAb costimulation was found to be a predictor of progression to AIDS both in ct/min, ct/min per 1000 CD3+ T cells, and ct/min percentage of controls. In contrast, the CD3 MoAb response (ct/min) was found not to be predictive.
On exclusion of patients who received HAART, similar results were obtained except that the absolute number of CD8+CD28− T cells, as determined by univariate analysis, and the number of CD8+ CD28− T cells, as determined by multivariate analysis, were no longer found to be significant for progression to AIDS (uni‐variate analysis for CD28+CD28− absolute number, RH 0·92, P < 0·10; multivariate model 1 for CD8+CD28− %, RH 0·93, P < 0·36; model 2 for CD8+CD28− absolute number, RH 0·90, P < 0·11).
DISCUSSION
In HIV-1 patients who progressed to AIDS and in those patients presenting with AIDS from the time of the first visit, T cell reactivity to CD28 MoAb by whole blood culture was very low; this has been confirmed in the literature [33,34]. However, using time-dependent univariate Cox models, a decrease in the ct/min of CD28 MoAb costimulation and a decrease in CD3 MoAb reactivity were found to be significantly predictive for progression to AIDS. Using multivariate time-dependent Cox models, only a decrease in CD28 MoAb costimulation and a decrease in CD4 % were found to be predictive for AIDS occurrence in model 1 (percentages of lymphocyte subsets). In model 2 (absolute numbers) a decrease in CD28 MoAb costimulation and a decrease in CD4+CD28+ absolute numbers were found to be predictive for AIDS development. These results confirm and expand previous data related to PBMC [23] and whole blood culture [34] which report that low T cell reactivity, together with low CD4+ absolute numbers, is a predictor for progression to AIDS.
Studies have been published showing that low CD4+ absolute numbers and diminished T cell function, as assessed by the CD3 MoAb response, have predictive importance, whereas HIV-1 RNA levels become less important as a predictor of AIDS progression as the time from HIV-1 infection increases [29,30]. Evaluation of CD28 MoAb costimulation using an easy-to-use whole blood culture method is a reliable and better assay than CD3 MoAb response (or other functional assays such as the response to PWM and PHA, data not shown) in the follow up of the functional status of these patients, and it may also possibly be useful in monitoring the effect of anti-retroviral therapy.
To our knowledge, this is the first time that a decrease in CD4+CD28+ absolute numbers has been documented as a better predictor for AIDS than a decrease in CD4+ absolute numbers. This might be expected, since CD4+ T cell changes are essential components in the pathogenesis of AIDS and it has been reported [16, 20, 22] that the CD28 antigen in CD4+ T lymphocytes is down-regulated in HIV-1 infection.
We believe that this is also the first time that a decrease in CD8+CD28+ absolute numbers and an increase in CD8+CD28− % have been reported to be predictors of AIDS development. In previous studies we [16] and other researchers [17,18,19,20,21,22,23] have reported an expansion of CD28− T cells in HIV-1-infected adults. The increase in CD8+CD28− % T cells (and percentage CD28− on CD8+ T cells), which had already been observed in both PWTA and PWA at baseline (compared with NC), remained at a high level for the whole observation period. This suggests that both groups have an early initial increase of CD28− T cells, probably due to the HIV-1 infection itself by analogy with other viral infections [35,36]. In some viral infections, however, CD28− T cells may diminish in number soon after the infection. An early increase in CD28− T cells has also been reported in vertically HIV-1-infected children early in life [37] and in primary HIV-1 responses [38]. This increase in CD8+CD28− T cells has been reported to be disease stage-related [16, 20, 22] and has been associated with functional defects in CD8+ cells by some researchers [19, 20, 22, 39]. There are however experimental data showing that CD8+ T cell ‘anergy’ might be reversible when an appropriate stimulus is used [22]. The mechanism eliciting the expansion of CD28− T cells remains obscure, although excessive activation in vivo in HIV-1 infection is associated with the increased expression of HLA-DR and CD38 on both CD28+ and CD28− subsets [8,22]. Alternatively, changes in the CD8+ T cells may be a general defence mechanism arising from the activation of cell-mediated immunity, since the largest expansion of CD8+CD28− T cells has been found in healthy ageing people [40,41] who probably benefit from a well-equipped immune system [42]. Furthermore, cytomegalovirus (CMV)-infected patients without CD8+CD28− sustained lymphocytosis develop severe disease [43].
In addition, the negative correlation that exists between percentages of CD4+ or CD4+CD28+ T cells and the percentage of CD8+CD28− T cells suggests that, whatever mechanism might be responsible for the generation of CD28− T cells, it seems to affect CD4+ and CD4+CD28+ T cells simultaneously, while contributing to CD3+ T cell homeostasis. This suggests that these cells may be mutually regulated. Our data concur with those of Caruso et al. [44] with regard to individual measurements of the above subsets in HIV-1+ patients. In contrast, the positive correlation that we have demonstrated between CD4+ or CD4+CD28+ T cell absolute numbers and CD8+CD28+ absolute numbers confirms previous data [44], where it has been shown that variations in the absolute number of CD4+ T cells closely matched the variations in the absolute number of CD8+CD28+ T cells in all HIV-1+ patients tested.
In conclusion, on the basis of a multivariate time-dependent Cox model, we show that the absolute number of CD4+CD28+ T cells was found to be a better predictor for AIDS progression than the absolute number of CD4+ T cells. Additionally, the lymphoproliferative response to CD28 MoAb costimulation (but not to CD3 MoAb) was also a predictor for AIDS progression, thus making it a good candidate for optimal disease staging in HIV-1 infection and possibly useful for monitoring anti-retroviral therapy. Furthermore, the negative correlation that was found between the percentages of either CD4+ or CD4+CD28+ T cells and CD8+CD28− T cells probably contributes to T cell homeostasis. Further studies to determine the mechanism and its significance in immunopathology are required.
Acknowledgments
We would like to thank Dr A. Loutradi, Head of the Department of Thalassemia, who kindly provided control blood samples, and Dr P. Stamboulidis for his help with the STATISTICA System. We are also indebted to Mrs D. Karsa and Mrs L. Sergiani for their excellent technical assistance. This work was supported by a grant from Hellenic Ministry of Health.
References
- 1.Pantaleo G, Fauci AS. New concepts in the immunopathogenesis of HIV infection. Ann Rev Immunol. 1995;13:487–12. doi: 10.1146/annurev.iy.13.040195.002415. [DOI] [PubMed] [Google Scholar]
- 2.Miedema F, Tersmette M, Van Lier RAW. AIDS pathogenesis: a dynamic interaction between HIV and the immune system. Immunol Today. 1990;11:293–7. doi: 10.1016/0167-5699(90)90116-q. [DOI] [PubMed] [Google Scholar]
- 3.Klein MR, Keet IPM, D’Amaro J, et al. Associations between HLA frequencies and pathogenic features of human immunodeficiency virus type 1 infection in seroconverters from the Amsterdam Cohort of homosexual men. J Infect Dis. 1994;169:1244–9. doi: 10.1093/infdis/169.6.1244. [DOI] [PubMed] [Google Scholar]
- 4.Dean M, Carrington M, Winkler C, et al. Genetic restriction of HIV-1 infection and progression to AIDS by a deletion allele of the CCR5 structural gene. Science. 1996;273:1856–62. doi: 10.1126/science.273.5283.1856. [DOI] [PubMed] [Google Scholar]
- 5.De Roda Husman AM, Koot M, Cornelissen M, et al. Association between CCR5 genotype and the clinical course of HIV-1 infection. Ann Intern Med. 1997;127:882–90. doi: 10.7326/0003-4819-127-10-199711150-00004. [DOI] [PubMed] [Google Scholar]
- 6.Pantaleo G, Graziosi C, Fauci AS. The immunopathogenesis of Human Immunodeficiency Virus infection. N Engl J Med. 1993;328:327–35. doi: 10.1056/NEJM199302043280508. [DOI] [PubMed] [Google Scholar]
- 7.Prince HE, Jensen ER. Three-color cytofluorometric analysis of CD8 cell subsets in HIV-1 infection. J Acquir Immun Defic Syndr. 1991;4:1227–32. [PubMed] [Google Scholar]
- 8.Kestens L, Vanham G, Gigase P, et al. Expression of activation antigens, HLA-DR and CD38 on CD8 lymphocytes during HIV-1 infection. AIDS. 1992;6:793–7. doi: 10.1097/00002030-199208000-00004. [DOI] [PubMed] [Google Scholar]
- 9.Kestens L, Vanham G, Vereecken C, et al. Selective increase of activation antigens HLA-DR and CD38 on CD4+CD45RO+ T lymphocytes during HIV-1 infection. Clin Exp Immunol. 1994;95:436–41. doi: 10.1111/j.1365-2249.1994.tb07015.x. [DOI] [PMC free article] [PubMed] [Google Scholar]
- 10.Clerici M, Stocks NI, Zajac RA, et al. Detection of three distinct patterns of T helper cell dysfunction in asymptomatic, human immunodeficiency virus-seropositive patients. J Clin Invest. 1989;84:1892–9. doi: 10.1172/JCI114376. [DOI] [PMC free article] [PubMed] [Google Scholar]
- 11.Gruters RA, Terpstra FG, De Jong R, et al. Selective loss of T cell functions in different stages of HIV infection. Eur J Immunol. 1990;20:1039–44. doi: 10.1002/eji.1830200514. [DOI] [PubMed] [Google Scholar]
- 12.Schellekens PTA, Roos MTL, De Wolf F, et al. Low T-cell responsiveness to activation via CD3/TCR is a prognostic marker for AIDS in HIV-1 infected men. J Clin Immunol. 1990;10:121–7. doi: 10.1007/BF00918194. [DOI] [PubMed] [Google Scholar]
- 13.Roos MTL, Miedema F, Koot M, et al. T-cell function in vitro is an independent progression marker for AIDS in human immunodeficiency virus (HIV)-infected asymptomatic individuals. J Infect Dis. 1995;171:531–6. doi: 10.1093/infdis/171.3.531. [DOI] [PubMed] [Google Scholar]
- 14.Hofmann B, Orskov , Lindhardt B, et al. Lymphocyte transformation response to pokeweed mitogen as a marker for the development of AIDS and AIDS related symptoms in homosexual men with HIV antibodies. BMJ. 1987;295:293–6. doi: 10.1136/bmj.295.6593.293. [DOI] [PMC free article] [PubMed] [Google Scholar]
- 15.Shearer GM, Bernstein DC, Tung KSK, et al. A model for the selective loss of major histocompatibility complex self-restricted T cell immune responses during the development of acquired immune deficiency syndrome (AIDS) J Immunol. 1986;137:2514–21. [PubMed] [Google Scholar]
- 16.Choremi-Papadopoulou H, Viglis V, Gargalianos P, et al. Downregulation of CD28 surface antigen on CD4+ and CD8+ T lymphocytes during HIV-1 infection. J Acquir Immun Defic Syndr. 1994;7:245–53. [PubMed] [Google Scholar]
- 17.Saukkonen JJ, Kornfeld H, Berman JS. Expansion of a CD8+CD28− cell population in the blood and lung of HIV-positive patients. J Acquir Immun Defic Syndr. 1993;6:1194–204. [PubMed] [Google Scholar]
- 18.Landay AL, Mackewicz CE, Levy JA. An activated CD8+ T-cell phenotype correlates with anti-HIV activity and asymptomatic clinical status. Clin Immunol Immunopathol. 1993;69:106–16. doi: 10.1006/clin.1993.1157. [DOI] [PubMed] [Google Scholar]
- 19.Borthwick NJ, Bofill M, Gombert WM, et al. Lymphocyte activation in HIV-1 infection. 2. Functional defects of CD28− T-cells. AIDS. 1994;8:431–41. doi: 10.1097/00002030-199404000-00004. [DOI] [PubMed] [Google Scholar]
- 20.Brinchmann JE, Dobloug JH, Heger BH, et al. Expression of costimulatory molecule CD28 on T cells in human immunodeficiency virus type 1 infection: functional and clinical correlations. J Infect Dis. 1994;169:730–8. doi: 10.1093/infdis/169.4.730. [DOI] [PubMed] [Google Scholar]
- 21.Lewis DE, Tang DSN, Aduoppong A, et al. Anergy and apoptosis in CD8+ T cells from HIV-infected persons. J Immunol. 1994;153:412–20. [PubMed] [Google Scholar]
- 22.Vingerhoets JH, Vanham GL, Kestens LL, et al. Increased cytolytic T lymphocyte activity and decreased B7 responsiveness are associated with CD28 down-regulation on CD8+ T cells from HIV-infected subjects. Clin Exp Immunol. 1995;100:425–33. doi: 10.1111/j.1365-2249.1995.tb03717.x. [DOI] [PMC free article] [PubMed] [Google Scholar]
- 23.Roos MTL, Miedema F, Meinesz AAP, et al. Low T cell reactivity to combined CD3 plus CD28 stimulation is predictive for progression to AIDS: correlation with decreased CD28 expression. Clin Exp Immunol. 1996;105:409–15. doi: 10.1046/j.1365-2249.1996.d01-794.x. [DOI] [PMC free article] [PubMed] [Google Scholar]
- 24.Valentine FT, De Gruttola V, Kaplan M, et al. Effects of HAART compared to HAART plus an inactivated HIV immunogen on lymphocyte proliferative responses (LPR) to HIV antigens; 12th World AIDS Conference, Geneva, 28 June–3 July. Conference Supplement; 1998. Abstr. 31227. [Google Scholar]
- 25.Roederer M. Getting to the HAART of T cell dynamics. Nature Med. 1998;4:145–6. doi: 10.1038/nm0298-145. [DOI] [PubMed] [Google Scholar]
- 26.Pantaleo G. Unraveling the strands of HIV’s web. Nature Med. 1999;5:27–28. doi: 10.1038/4706. [DOI] [PubMed] [Google Scholar]
- 27.Pakker NG, Notermans DW, De Boer RJ, et al. Biphasic kinetics of peripheral blood T cells after triple combination therapy in HIV-1 infection: a composite of redistribution and proliferation. Nature Med. 1998;4:208–14. doi: 10.1038/nm0298-208. [DOI] [PubMed] [Google Scholar]
- 28.Li TS, Tubiana R, Katlama C, et al. Long-lasting recovery in CD4 T-cell function and viral load reduction after highly active antiretroviral therapy in advanced HIV-1 disease. Lancet. 1998;351:1682–6. doi: 10.1016/s0140-6736(97)10291-4. [DOI] [PubMed] [Google Scholar]
- 29.Spijkerman IJB, Prins M, Goudsmit J, et al. Early and late HIV-1 RNA level and its association with other markers and disease progression in long-term AIDS-free homosexual men. AIDS. 1997;11:1383–8. doi: 10.1097/00002030-199711000-00013. [DOI] [PubMed] [Google Scholar]
- 30.De Wolf F, Spijkerman I, Schellekens P, et al. AIDS prognosis based on HIV-1 RNA, CD4 + T-cell count and function: markers with reciprocal predictive value over time after seroconversion. AIDS. 1997;11:1799–806. doi: 10.1097/00002030-199715000-00003. [DOI] [PubMed] [Google Scholar]
- 31.Center for Disease Control. 1993 Revised classification system for HIV infection and expanded surveillance definition for AIDS among adolescents and adults. MMWR. 1992;41:1–1. RR – 17. [PubMed] [Google Scholar]
- 32.Bloemena E, Roos MT, Van Heijst JL, et al. Whole-blood lymphocyte cultures. J Immunol Methods. 1989;122:161–7. doi: 10.1016/0022-1759(89)90260-3. [DOI] [PubMed] [Google Scholar]
- 33.Carlesimo M, Pontesilli O, Varani AR, et al. CD28 costimulation and T lymphocyte proliferative responses in HIV-1 infection. Clin Exp Immunol. 1997;109:406–11. doi: 10.1046/j.1365-2249.1997.4721370.x. [DOI] [PMC free article] [PubMed] [Google Scholar]
- 34.Roos MTL, Prins M, Koot M, et al. Low T-cell responses to CD3 plus CD28 monoclonal antibodies in whole-blood lymphocyte culture are predictive for development of AIDS. AIDS. 1998;12:1745–51. doi: 10.1097/00002030-199814000-00005. [DOI] [PubMed] [Google Scholar]
- 35.Labalette MF, Salez FR, Pruvot C, et al. CD8 lymphocytosis in primary cytomegalovirus (CMV) infection of allograft recipients: expansion of an uncommon CD8+CD57− subset and its progressive replacement by CD8+CD57+ T cells. Clin Exp Immunol. 1994;95:465–71. doi: 10.1111/j.1365-2249.1994.tb07020.x. [DOI] [PMC free article] [PubMed] [Google Scholar]
- 36.Borthwick NJ, Bofill M, Hassan I, et al. Factors that influence activated CD8+ T cell apoptosis in patients with acute herpesvirus infection: loss of costimulatory molecules CD28, CD5 and CD6 but relative maintenance of Bax and Bcl-X expression. Immunology. 1996;88:508–15. [PMC free article] [PubMed] [Google Scholar]
- 37.Brugnoni D, Airo P, Timpano S, et al. CD8+CD28− T cells in vertically HIV-infected children. Clin Exp Immunol. 1997;109:412–5. doi: 10.1046/j.1365-2249.1997.4871386.x. [DOI] [PMC free article] [PubMed] [Google Scholar]
- 38.Brugnoni D, Prati E, Malacarne F, et al. The primary response to HIV infection is characterized by an expansion of activated CD8+CD28− cells. AIDS. 1996;10:104–6. doi: 10.1097/00002030-199601000-00017. [DOI] [PubMed] [Google Scholar]
- 39.Vingerhoets J, Kestens L, Penne G, et al. CD8+ T cells and not CD4+ T cells are hyporesponsive to CD28− and CD40L-mediated activation in HIV-infected subjects. Clin Exp Immunol. 1997;107:440–7. doi: 10.1046/j.1365-2249.1997.d01-964.x. [DOI] [PMC free article] [PubMed] [Google Scholar]
- 40.Fagnoni FF, Vesconini R, Mazzola M, et al. Expansion of cytotoxic CD8+CD28− T cells in healthy ageing people, including centenarians. Immunology. 1996;88:501–7. doi: 10.1046/j.1365-2567.1996.d01-689.x. [DOI] [PMC free article] [PubMed] [Google Scholar]
- 41.Merino J, Martinez-Gonzalez MA, Rubio M, et al. Progressive decrease of CD8 high+ CD28+CD57− cells with ageing. Clin Exp Immunol. 1998;112:48–51. doi: 10.1046/j.1365-2249.1998.00551.x. [DOI] [PMC free article] [PubMed] [Google Scholar]
- 42.Rothstein G. Hematopoiesis in the aged: a model of hematopoietic dysregulation. Blood. 1993;82:2601–4. [PubMed] [Google Scholar]
- 43.Reusser P, Riddel SR, Meyers JD, et al. Cytotoxic T-lymphocyte response to cytomegalovirus after human allogeneic bone marrow transplantation: pattern of recovery and correlation with cytomegalovirus infection and disease. Blood. 1991;78:1373–80. [PubMed] [Google Scholar]
- 44.Caruso A, Licenziati S, Canaris AD, et al. Contribution of CD4+, CD8+CD28− and CD8+CD28− T cells to CD3− lymphocyte homeostasis during the natural course of HIV-1 infection. J Clin Invest. 1998;101:137–44. doi: 10.1172/JCI195. [DOI] [PMC free article] [PubMed] [Google Scholar]