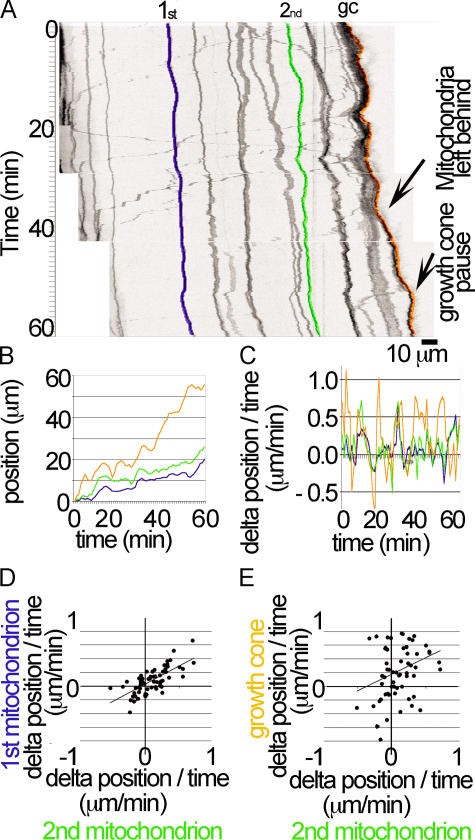
Figure 2.
Low velocity mitochondrial movements are highly correlated along the axon. (A) High resolution kymograph of mitochondrial transport from a single neuron followed for 1 h, with frames acquired every 2 s. Translucent colored lines illustrate the positions of two mitochondria along the axon and the most distal mitochondrion in the growth cone. Examples where the growth cone advances rapidly, leaving mitochondria from the growth cone behind in the axon shaft and a growth cone pause, are pointed out with arrows to illustrate that LVT is not tightly linked to growth cone advance (Video 2). (B) The relative positions over time of two mitochondria along the axon and the most distal mitochondria in the growth cone. The positions of the three mitochondria highlighted in A are shown, with the initial positions of the mitochondria centered at the origin. (C) Change in mitochondrial position over time. A rolling 30-s average of position was used to smooth the data, and then the minute-to-minute change in the position of the mitochondria was determined for the correlation analysis (n = 62 points). (D) Back-and-forth movements of docked mitochondria along the axon shaft are highly correlated. This is a plot showing the relative minute-to-minute change in the positions of two mitochondria along the axon shaft (r2 = 0.51; n = 62; P < 0.001). (E) Movements of mitochondria in the growth cone are less correlated with movements of mitochondria along the axon. This is a plot showing the minute-to-minute change in the position of a mitochondrion along the axon shaft and a mitochondrion in the growth cone (r2 = 0.08; n = 62; P = 0.03). Video 2 is available at http://www.jcb.org/cgi/content/full/jcb.200510097/DC1.

