
Figure 6.
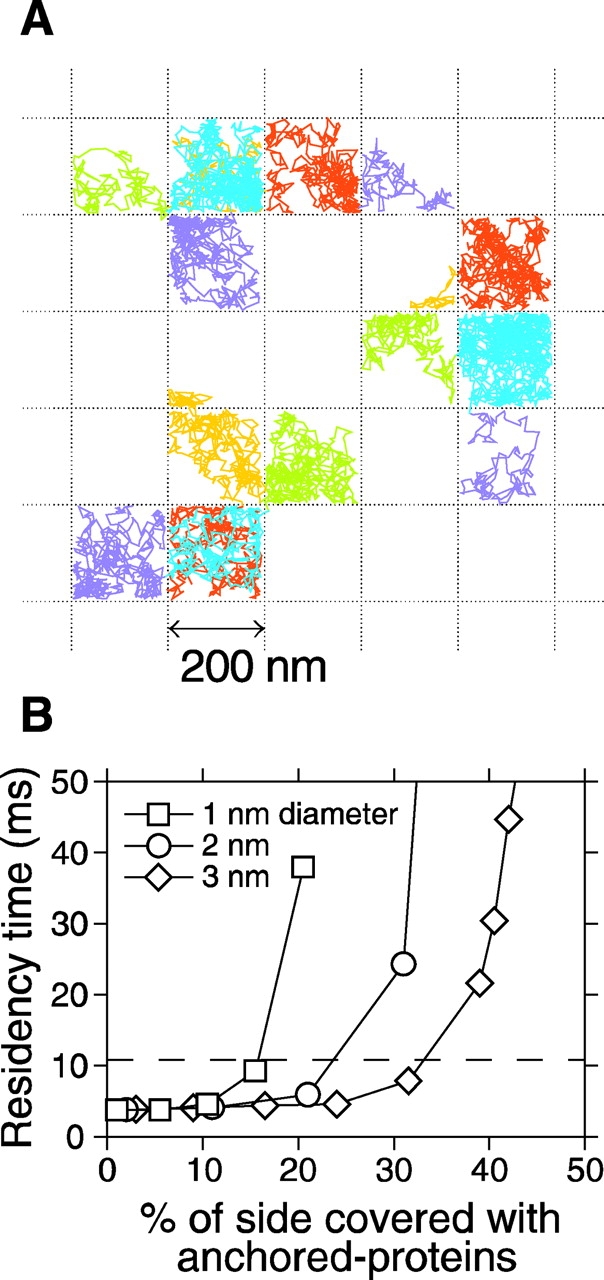
A series of Monte Carlo simulations support the anchored-protein picket model. (A) Typical trajectories of test particles (2,250 steps with 25-μs intervals) bounded by immobile obstacles as observed in Monte Carlo simulations. Stationary barrier obstacles of set hard-core radius were placed along the edges of a square grid (200 nm × 200 nm) such that there were a set number of barriers per unit cell. The effects of steric hindrance and circumferential slowing due to anchored proteins are included. (B) Plot of residency time versus percent of the side of the compartment boundary covered with anchored membrane proteins (1, 2, or 3 nm in diameter). 100 trajectories were generated and the mean D 50ms (50-ms time window) was obtained for each condition. The mean residency time was determined as (200 nm)2/4D 50ms. The dashed line shows the experimentally determined 11-ms residency time for 230-nm compartments. About 16, 24, and 34% coverage of the boundary (31, 24, and 23 protein molecules on a given 200-nm barrier) with 1-, 2-, and 3-nm-φ anchored proteins, respectively, was required to obtain the residency time similar to the experimental value.