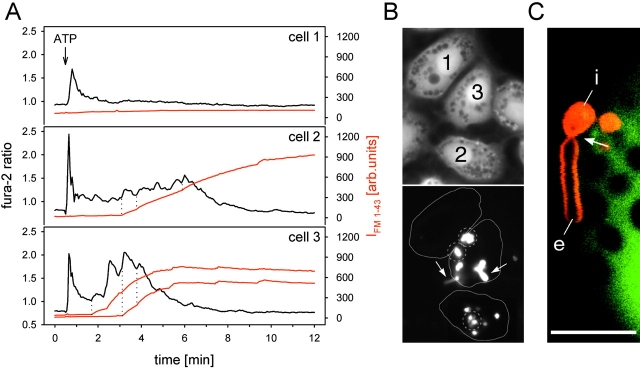
Figure 7.
Differential cellular responses to ATP. (A) The fura-2 ratios (black lines) were determined from the respective areas shown by the continuous lines in B (bottom), and simultaneously, the FM 1-43 signals (red lines) were measured over the smaller encircled areas (dotted lines) in B (bottom), containing several fused LBs. (B) Top, 350 nm; bottom, 480-nm excitation image captured at 0.3 and 5 min after addition of ATP. Arrows indicate two (among several) floating LB protrusions from fused vesicles. Cell 1 has no [Ca2+]i plateau and no fused vesicles; cell 2 shows intermediate [Ca2+]i elevations and intermediate exocytotic response, but no protrusions; and cell 3 has marked [Ca2+]i oscillations, a high exocytotic activity with fast staining rates, and many LB protrusions. This example demonstrates that the course of the Ca2+ signal determines both fusion activity and occurrence of LB protrusions. The dotted lines in A (cells 2 and 3) denote individual fusion events coinciding with rising phases of [Ca2+]i oscillations. (C) Higher magnification view of LB protrusion by LSM. The floating extracellular portion of LB material (e) is still attached to the intravesicular, immobile portion (i), separated by a lace (arrow), presumably representing the site of the fusion pore. The image was captured at 488 nm excitation, and at emission settings of >515 nm (FM 1-43, red) and 510–525 nm (calcein, green), causing nonfused vesicles to appear as dark inclusions within the cytosol. Bar, 15 μm.

