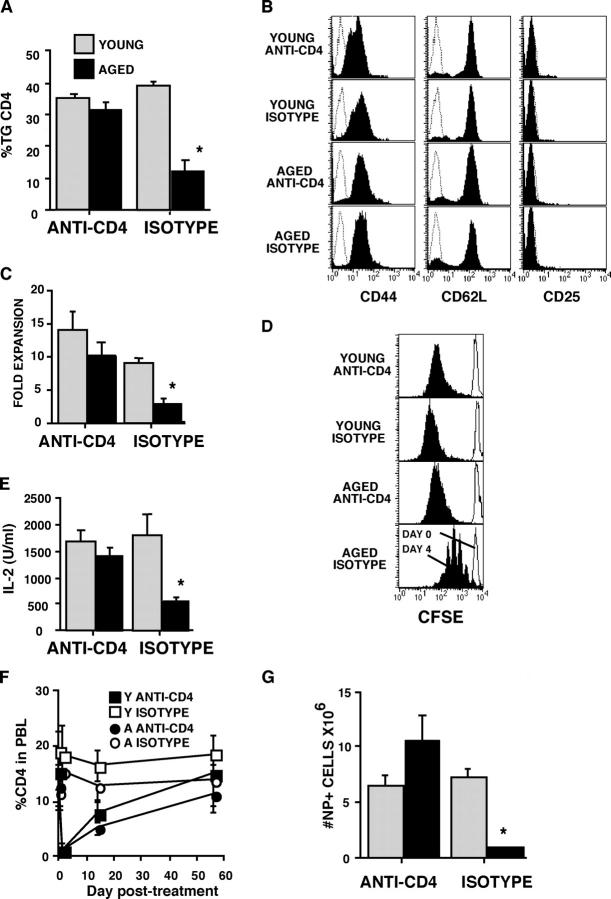
Figure 2.
Responses following anti-CD4 Ab treatment of young and aged AND Tg mice. Young (gray) and aged (black) Tg mice were treated with 200 μg anti-CD4 (GK1.5) or isotype control antibody. (A) Repopulation of the Tg CD4 compartment was monitored by tail bleeding, and Tg (Vβ3) CD4 T cells were identified by flow cytometry. The percent Tg CD4 T cells within the total PBL population at day 59 after treatment is shown. (B) Cell surface phenotype of lymphocytes pooled from spleens and LNs on day 59 after antibody treatment. Flow cytometry histograms are gated on Tg (Vβ3) CD4 lymphocytes. Dotted histograms represent isotype control staining. (C) Lymphocytes from each group were enriched for naive CD4 T cells, CFSE labeled, and stimulated with antigen/APC at 2 × 10⁵/ml. Fold expansion was determined over the 4-d culture. (D) Flow cytometry histograms are gated on Tg (Vβ3) CD4 T cells and show representative CFSE profiles on day 0 (open) and after 4 d (shaded) of culture. (E) Supernatants were collected from the T cell cultures described in C after 1 d and assayed for IL-2. (F) Young and aged B10.BR mice were treated with anti-CD4 or isotype control antibody. Over a period of 8 wk, the percent CD4 T cells in peripheral blood was determined by flow cytometry. (G) The young and aged mice described in F were immunized with NP-PCC/alum 8 wk after Ab treatment. The number of NP-binding B splenocytes in each animal was determined by flow cytometry after being stained with NP-APC. For all experiments, data shown are mean ± SE, with n = 3 to 5 mice/group; *, P < 0.05.

