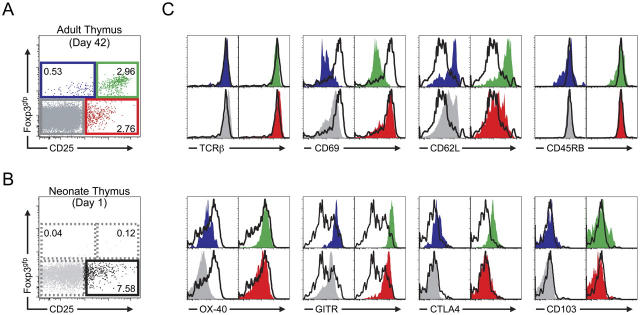
Figure 2.
Phenotypic analysis of neonatal and adult CD4 SP thymocytes. (A) Representative flow cytometric analysis of CD25 and Foxp3gfp expression on CD4 SP thymocytes from a 6-wk-old mouse. The numbers indicate the percentage of cells in each gate. (B) Representative flow cytometric analysis of CD25 and Foxp3gfp expression on CD4 SP thymocytes from a 1-d-old mouse. The numbers indicate the percentage of cells in each gate. (C) Comparison of the indicated cell surface marker expression on postnatal day 1 CD25+Foxp3gfp− CD4 SPs with adult Foxp3/CD25-expressing subpopulations. Closed colored histograms are shown for cells from each of the adult Foxp3 × CD25 subpopulations and correspond to the gated population of the same color and position in the plot in A (blue, CD25lo/negFoxp3gfp+; green, CD25hiFoxp3gfp+; red, CD25+Foxp3gfp−; gray, CD25−Foxp3gfp−). In every case, the open histogram overlay (black) shows the corresponding marker expression by the postnatal day 1 CD25+Foxp3gfp− CD4 SP population as defined by the bottom right gate in B.

