FIG. 6.
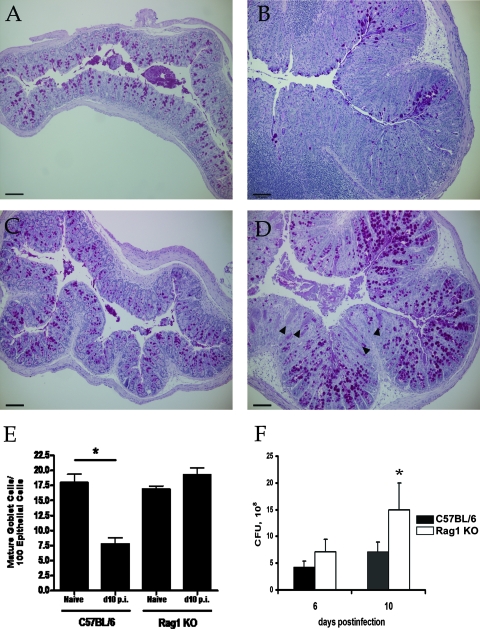
C. rodentium infection does not result in goblet cell depletion phenotype in Rag1 KO mice. (A to D) Histology of PAS- and hematoxylin-stained distal colonic sections taken from (A) naïve C57BL/6 mice, (B) C57BL/6 mice at day 10 p.i., (C) naïve Rag1 KO mice, and (D) Rag1 KO mice at day 10 p.i. The mature PAS-positive cell population is still large in Rag1 KO mice at day 10 p.i. Heavily infected mucin-depleted atrophic crypts are indicated by arrowheads. Original magnification, ×100. Bar = 100 μm. (E) Quantitation of goblet cells in distal colons from naïve C57BL/6 and Rag1 KO mice or from infected mice at day 10 p.i. The bars indicate the mean numbers of goblet cells per 100 epithelial cells counted in PAS- and hematoxylin-stained sections of the distal colon. The error bars indicate standard errors of the means for at least three independent infections with one to three mice per time point. Asterisk, P < 0.05. (F) Comparison of numbers of bacteria in whole colons of C57BL/6 mice (filled bars) and Rag1 KO mice (open bars) at day 10 p.i. The bars indicate the means from three independent infections, each with two or three mice per time point. The error bars indicate the standard deviations. Asterisk, P < 0.05, as determined by the Mann-Whitney t test.

