

Abstract
Dual whole-cell voltage recordings were made from synaptically connected layer 5 (L5) pyramidal neurones in slices of the young (P14-P16) rat neocortex. The Ca2+ buffers BAPTA or EGTA were loaded into the presynaptic neurone via the pipette recording from the presynaptic neurone to examine their effect on the mean and the coefficient of variation (c.v.) of single fibre EPSP amplitudes, referred to as unitary EPSPs.
The fast Ca2+ buffer BAPTA reduced unitary EPSP amplitudes in a concentration dependent way. With 0.1 mm BAPTA in the pipette, the mean EPSP amplitude was reduced by 14 ± 2.8% (mean ±s.e.m., n = 7) compared with control pipette solution, whereas with 1.5 mm BAPTA, the mean EPSP amplitude was reduced by 72 ± 1.5% (n = 5). The concentration of BAPTA that reduced mean EPSP amplitudes to one-half of control was close to 0.7 mm.
Saturation of BAPTA during evoked release was tested by comparing the effect of loading the presynaptic neurone with 0.1 mm BAPTA at 2 and 1 mm[Ca2+]o. Reducing [Ca2+]o from 2 to 1 mm, thereby reducing Ca2+ influx into the terminals, decreased the mean EPSP amplitude by 60 ± 2.2% with control pipette solution and by 62 ± 1.9% after loading with 0.1 mm BAPTA (n = 7).
The slow Ca2+ buffer EGTA at 1 mm reduced mean EPSP amplitudes by 15 ± 2.5% (n = 5). With 10 mm EGTA mean EPSP amplitudes were reduced by 56 ± 2.3% (n = 4).
With both Ca2+ buffers, the reduction in mean EPSP amplitudes was associated with an increase in the c.v. of peak EPSP amplitudes, consistent with a reduction of the transmitter release probability as the major mechanism underlying the reduction of the EPSP amplitude.
The results suggest that in nerve terminals of thick tufted L5 pyramidal cells the endogenous mobile Ca2+ buffer is equivalent to less than 0.1 mm BAPTA and that at many release sites of pyramidal cell terminals the Ca2+ channel domains overlap, a situation comparable with that at large calyx-type terminals in the brainstem.
Release of transmitter in synapses is dependent on Ca2+ influx into the nerve terminals (Katz, 1969) and the binding of Ca2+ to a putative Ca2+ sensor on synaptic vesicles which in turn controls the exocytosis of a vesicle. The free cytoplasmic Ca2+ concentration ([Ca2+]i) in the vicinity of the Ca2+ sensor depends on the magnitude and time course of the Ca2+ influx into the terminal during an action potential and on the distance between the Ca2+ sensor and the site of Ca2+ entry. Fixed and mobile Ca2+ buffers affect the size and time course of the [Ca2+]i transient, depending on their concentration, association and dissociation kinetics and their mobility (Sala & Hernandez-Cruz 1990; Nowycky & Pinter, 1993; Roberts, 1994; Neher, 1995).
Exogenous Ca2+ buffers, which compete for free Ca2+ with the endogenous buffers and the vesicular Ca2+ sensor, were used previously to examine the coupling between presynaptic [Ca2+]i transients and transmitter release. The lack of effect of presynaptic EGTA (80 mm), a slowly binding Ca2+ buffer, on phasic release in the squid giant synapse indicated a very fast rise of [Ca2+]i near the sensor and suggested that the distance between Ca2+ channels and the Ca2+ sensor was short (Adler et al. 1991). In contrast, at the calyx-type giant synapse of the rat medial nucleus of the trapezoid body (MNTB) relatively low concentrations of EGTA (1 mm) were sufficient to reduce phasic transmitter release (Borst & Sakmann, 1996) indicating a longer diffusional distance of Ca2+ between the Ca2+ channel and the Ca2+ sensor. In terminals of retinal bipolar neurones, EGTA and BAPTA differentially affected two phases of transmitter release which presumably represent two pools of vesicles (Mennerick & Matthews, 1996). Adding exogenous Ca2+ buffers to terminals was also used to estimate the concentration of endogenous mobile Ca2+ buffers. This yielded estimates of endogenous buffers being equivalent to 1.6 mm and 50 μm in inner ear cells and the calyx-type synapse, respectively (Roberts, 1993; Borst et al. 1995). In addition, exogenous Ca2+ buffers were used for elucidating the function of [Ca2+]i transients in short- and long-term changes in synaptic efficacy (Delaney et al. 1991; Bain & Quastel, 1992; Van der Kloot & Molgo 1993; Winslow et al. 1994; Kobayashi et al. 1995; Tank et al. 1995; Bao et al. 1997).
We examined the effect of exogenous fast and slow Ca2+ buffers on evoked transmitter release in terminals of the axodendritic synaptic contacts between neighbouring pyramidal neurones in layer 5 (L5) of rat neocortex (Markram et al. 1997). Simultaneous pre- and postsynaptic whole-cell voltage recordings (WCR) from L5 pyramidal neurones were made and multiple, sequential WCRs from the same presynaptic neurone with different pipette solutions containing either the fast binding Ca2+ buffer BAPTA or the slow binding buffer EGTA or with control solution. The mean EPSP amplitudes were measured before, during and after buffer loading of the presynaptic neurone. The results show that both the slow and the fast binding buffers, at relatively low concentrations, reversibly reduced the evoked transmitter release comparable with the results obtained at the axosomatic synapse of the MNTB.
METHODS
Electrophysiology
Slice preparation and electrical recordings are described in detail in Markram et al. (1997). Briefly, Wistar rats (14–16 days) were decapitated and neocortical slices (sagittal; 300 μm thick) were cut on a vibratome in ice-cold extracellular solution. Slices were incubated for 30 min at 37°C and then stored at room temperature (20–22°C) prior to transferring to the recording chamber (32–34°C). All experiments were performed within 6 h after transfer to room temperature. The extracellular solution contained (mm): 125 NaCl, 2.5 KCl, 25 glucose, 25 NaHCO3, 1.25 NaH2PO4, 2 CaCl2 and 1 MgCl2. In some experiments the extracellular solution contained 1 mm CaCl2and 2 mm MgCl2. All extracellular solutions were continously bubbled with a mixture of 95% O2-5% CO2 throughout the slice preparation, in the slice maintenance chamber and in the recording chamber. L5 pyramidal neurones from the somatosensory cortical area were identified using infrared differential interference contrast (IR-DIC, Stuart et al. 1993) video-microscopy system mounted on an upright microscope (Zeiss-Axioplan, fitted with × 40 W/0.75 NA objective). Somatic whole-cell recordings (2–4 MΩ pipette resistance; 4–15 MΩ access resistance) were made using Axoclamp-2B (Axon Instruments, Foster City, CA, USA) and EPC-9 (List Electronic, Darmstadt, Germany) amplifiers. Control pipette solution contained (mm): 105 potassium gluconate, 30 KCl, 4 Mg-ATP, 10 sodium phosphocreatine, 0.3 GTP, 10 Hepes (pH 7.2, 290 mosmol l−1), BAPTA or EGTA were added to the pipette solution substituting an equivalent concentration of potassium gluconate. Data acquisition was done on-line with a Macintosh computer through the EPC-9 AD converter at a sampling rate of 5 kHz after filtering at 3 kHz. The sampling rate was somewhat lower than required, however the estimates of EPSP peaks were obtained from the mean of at least 10 points (1 ms) reducing possible errors. Action potential waveform measurements were done at either 5 kHz or 50 kHz sampling rate. Resting membrane potentials (Vm) were −60 ± 4 mV. Data are presented as means ±s.e.m., unless indicated otherwise. The cell input resistance (Rin) and the access resistance (Rac) were monitored throughout the experiments, typically, Rin was 80–120 MΩ and did not significantly change during dialysis. Maintaining a low access resistance below 10 MΩ for at least 15 min after break in of the seal was a prerequisite for achieving fast loading. Unitary EPSPs were evoked by injecting 5–10 ms current pulses into the presynaptic neurone at a rate of 0.25 Hz.
Buffer loading
After 10–20 min control WCR the recording pipette was retracted from the presynaptic neurone usually forming an outside-out patch and a new pipette, filled with BAPTA- or EGTA-containing solution was used to establish a second WCR. In some of the experiments, following loading, a third WCR was established on the same presynaptic neurone with control intracellular solution to test the reversibility of the buffer effect.
Anatomy
Neurones were loaded with 0.5% biocytin (Sigma, Munich, Germany) for 40 min to 1 h at the end of an experiment with buffer loading. The tissue was fixed and processed for light microscopy as described in Markram et al. (1997). Reconstruction of connected pairs of neurones was done with the aid of the Neurolucida tracing system (BioMetric System, VT, USA). Potential sites of synaptic contacts were marked according to the criteria given in Markram et al. (1997).
Analysis
Analysis of the mean and the coefficient of variation (c.v). of unitary EPSP amplitudes was made using a set of programs written in IGOR (WaveMetrics, Lake Oswego, OR, USA). EPSP amplitudes were measured as the mean of ten sampling points around the peak. Coefficient of variation was corrected for the baseline noise (Korn et al. 1981; Markram et al. 1997) and calculated as described in the Appendix eqn (A2). The mean EPSP amplitude and the c.v. of the EPSP amplitudes were calculated from 100–150 sweeps for the control period and from 100–250 sweeps acquired after the effect of BAPTA or EGTA reached a steady state when the mean EPSP amplitude did not change further.
Simulations
Time course of axonal diffusion
Simulation of buffer diffusion in the axonal arbor was made using NEURON (Hines & Carnevale, 1997). A model of linear diffusion from a source point was used for the presynaptic axonal arbor of two pairs of reconstructed neurones for which the axonal locations of the boutons of putative synaptic contacts had been determined. The time required for filling the soma was not taken into account. This may add approximately 5 min for reaching the time of saturation, as was observed in somata filled with fura-2. The value for the diffusion constant of BAPTA was 200 μm2 s−1 (Neher, 1986) and the BAPTA concentration at the source point was 0.5 mm.
Branch point failures
For calculating the possible contribution of failures in action potential propagation at axonal branch points (BPF) to the rate of failures observed in unitary EPSPs during dialysis with BAPTA we made a simple simulation for one specific experiment. In this experiment we had made pre- and postsynaptic recordings, before and during BAPTA dialysis of the presynaptic neurone and had also reconstructed neurones after biocytin filling. Based on the reconstruction of the presynaptic axonal arbor the order of the axonal branch of each putative presynaptic bouton was determined. The assumptions underlying this calculation were: (a) a binomial model for the release probability of the connection (described in Appendix, eqns (A1) to (A4)). It assumed that the release probability (pr) and quantal size (q) at each of the four synaptic contacts were equal. (b) The failure probability of action potential propagation in a branch (pf) is the same for all branches. The somatically recorded unitary EPSP is the sum of the depolarization from the four individual synaptic contacts. Estimating the effect of BPF on the mean EPSP amplitude would require a very complex simulation. Instead we calculated the expected failure probability pF of unitary EPSPs, i.e. the probability that a presynaptic action potential initiated at the soma would fail to evoke an EPSP. The calculation of pf at each axonal branch point preceeding the location of each of the four contacts was based on the assumption that the ability of an action potential to propagate into a branch was independent of what happens at the other branch points (Appendix, eqns (A5a), (A5b) and (A5c)). Equation (A5c) describes pF in terms of pf and pr. The value of pF was calculated from the number of EPSP failures in this experiment. The value of pr was calculated from the measured EPSP amplitudes (eqns (A1) to (A4)). Equation (A5c) was solved for pf using Mathematica.
RESULTS
Anatomy of axon collaterals
Figure 1A illustrates the somata of a pair of unidirectionally connected thick tufted L5 pyramidal neurones. The cell on the left was the projecting neurone, the cell on the right the target. Whole-cell voltage recording from the soma of the projecting neurones was established and discontinued three times. Each WCR was made with a new pipette containing a different solution, first without BAPTA serving as control, then with 1 mm BAPTA included and finally again without BAPTA as a control. During this sequence of successive recordings from the same neurones no major changes in the appearance of the cell soma and the proximal apical dendrite in the IR-DIC video image or their electrophysiological properties (membrane potential, input resistance) were detected.
Figure 1. Anatomy of pyramidal cell pairs in neocortical L5 used for presynaptic Ca2+ buffer dialysis.
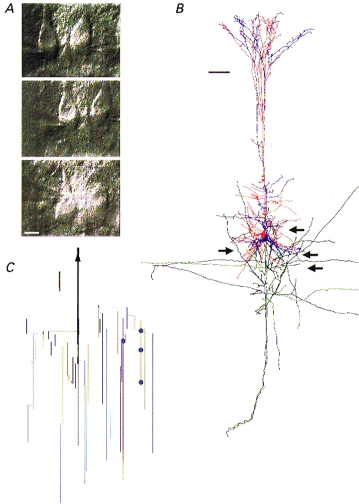
A, IR-DIC video images of the somata of a pair of neurones connected unidirectionally. Soma of projecting pyramid cell is shown on the left with the tips of three different recording pipettes sealed sequentially to the soma (pipettes 1, 2, and 3 are shown in this order from uppermost to lowest image). The soma of the target neurone is shown on the right and is continuously recorded with the same pipette throughout the experiment. Scale bar: 15 μm. B, reconstruction of another unidirectionally connected pair of pyramidal cells. The soma and axon of the projecting neurone are shown in red and black, respectively, and those of the target neurone in blue and green, respectively. The arrows point towards the locations of putative synaptic contacts. The projecting neurone was dialysed with control solution first, then with solution containing 0.5 mm BAPTA and a third time with control solution. At the end of the experiment both cells were filled with biocytin. Scale bar: 100 μm. C, geometric axonogram of the projecting neurone. Same presynaptic cell as shown in B. The locations of four putative synaptic boutons are indicated by blue dots. The axonal arbor was truncated at 838 μm from the soma. The distance of the putative synaptic boutons from the soma is 235, 270, 302 and 406 μm, the mean geometric distance is 303 ± 74 μm (± s.d.), the number of axonal branch points is 5 for each contact. Scale bar: 65 μm.
A reconstruction of a different pair of connected neurones shows the dendrite and axon arbor anatomy and the location of putative synaptic contacts (Fig. 1B). Four putative synaptic contacts (arrows) for this connection were determined from light microscopy (according to the criteria described in Markram et al. 1997). Figure 1C shows the geometric axonogram of the presynaptic cell shown in Fig. 1B. The locations of the four putative contacts are represented by blue dots. The mean distance of the boutons on the axon collaterals of the projecting neurone, when measured from the soma, was 303 ± 74 μm (±s.d.) for the pair shown in Fig. 1B and 258 ± 70 μm (±s.d., n = 5 boutons) for another reconstructed pair (not shown). These values are comparable to the value reported by Markram et al. (1997).
BAPTA dialysis and unitary EPSP amplitudes
The mean unitary EPSP amplitude before, during and following WCR with a pipette solution containing BAPTA (1.5 mm) is shown in Fig. 2A. The upper panel illustrates action potentials evoked in the presynaptic neurone and the corresponding mean unitary EPSPs recorded during an initial control period with control pipette solution, during BAPTA loading and after dialysis with control pipette solution. The lower panel of Fig. 2A illustrates that the mean EPSP amplitude decreased by 56% after 15 min of dialysing the presynaptic neurone with BAPTA containing pipette solution. The effect of 1.5 mm BAPTA on EPSP amplitudes was reversed during the third WCR with control pipette solution (96% of control). This indicates that intracellular BAPTA does not have a toxic effect and reduced transmitter release primarily via buffering of [Ca2+]i. In most experiments the decrease in mean EPSP amplitude was relatively rapid, with a mean decay time constant of 10 ± 8 min (±s.d.; range 4–39 min; n = 17).
Figure 2. Effect of dialysing a projecting neurone with BAPTA on unitary EPSP amplitudes.

A, effect of 1.5 mm BAPTA in presynaptic recording pipette. Aa, presynaptic action potentials, representative of the three different whole-cell recordings (WCR), each a mean of sixty responses. Ab, the mean EPSP amplitudes are 2.94, 1 and 2.8 mV. Ac, unitary EPSP amplitudes before (WCR1), during (WCR2) and after (WCR3) dialysis of the projecting neurone with 1.5 mm BAPTA. Here and in subsequent figures, arrows indicate ‘break in’ of the seal for WCR with each presynaptic recording pipette. P1 and P3 contained control solution, P2 contained in addition 1.5 mm BAPTA. Calibration bar represents 25 mV for Aa and 1 mV for Ab. B, EPSP amplitudes as a function of BAPTA concentration in the presynaptic recording pipette. The mean EPSPs at steady-state effect of BAPTA during the second WCR were normalized to the mean EPSP amplitude during the first WCR done with control pipette solution (defined in the ordinate as control). The points in the graph represent the means of several experiments with the following concentrations of BAPTA in the presynaptic pipette solution during the second WCR (mm): 0, 0.1, 0.5, 0.75, 1, 1.5, 4 and 5 (n equalled 4, 7, 9, 2, 7, 5, 2 and 4, respectively). The point at 0 mm BAPTA represents the mean EPSP amplitude during a second WCR performed with a control pipette solution, normalized to the mean EPSP amplitude during the first WCR done with the same control pipette solution. Each symbol represents the mean ± s.e.m. At the BAPTA concentrations of 0.5 and 1.5 mm the s.e.m. values were smaller than the symbol size. For the measurements with 0.75 and 4 mm, the means of two measurements are given. The dotted line represents a fit to a single exponential function, the half-maximal effect, obtained from the fit is indicated by the dashed lines, the x-axis intercept is at 0.7 mm.
When WCRs were established with 100 μm BAPTA in the pipette solution a mean reduction of 14 ± 2.8% (n = 7) in EPSP amplitude was detected, whereas 1.5 mm BAPTA decreased the mean EPSP amplitude by 72 ± 1.5% (n = 5). Figure 2B shows the concentration dependence of the effect of presynaptic BAPTA dialysis on the mean unitary EPSP amplitude. The steepest region was between 0.2 and 0.7 mm BAPTA, the concentration where the effect was half-maximal was 0.7 mm.
BAPTA saturation
Low concentrations of BAPTA could be locally saturated in the vicinity of open Ca2+ channels during phasic transmitter release (Stern, 1992; Naraghi & Neher, 1997) depending strongly on the submembranous [Ca2+]i (Roberts, 1994). The effect of low concentrations of presynaptic BAPTA on the EPSP amplitude may be underestimated due to partial saturation of the buffer around the Ca2+ sensor for release. We tested for this possibility by comparing the effect of reducing [Ca2+]o from 2 to 1 mm first during a control paired recording and after dialysis of the presynaptic neurone with 0.1 mm BAPTA. Figure 3 shows that during the first WCR with control pipette solution reducing [Ca2+]o from 2 to 1 mm decreased the mean EPSP amplitude by 63%. Dialysis of the presynaptic cell with 0.1 mm BAPTA decreased the mean EPSP amplitude by 24%. The reduction of [Ca2+]o from 2 to 1 mm further reduced the mean EPSP amplitude by 68%. If, with 0.1 mm BAPTA buffering were reduced due to saturation of the buffer, one would expect that in low [Ca2+]o, the Ca2+ influx into the terminal during an action potential would be smaller and the effect of 0.1 mm BAPTA on release would be larger. In the experiment shown in Fig. 3, the dialysis with BAPTA was slightly more effective at low [Ca2+]o. In seven experiments the mean EPSP amplitude at 1 mm[Ca2+]o was reduced by 60 ± 1.9% in presynaptic control solution and by 62 ± 2.3% in a presynaptic solution containing 0.1 mm BAPTA, not significantly different (paired t test, P = 0.6). Comparison of the effect of 0.1 mm BAPTA on the EPSP amplitude in 2 and 1 mm[Ca2+]o (84 ± 3.1 and 82 ± 1.8%, respectively) clearly shows that the effect of 0.1 mm BAPTA on the EPSP amplitude was not changed after the reduction of the calcium influx into the terminals.
Figure 3. BAPTA effects at different extracellular Ca2+ concentrations.
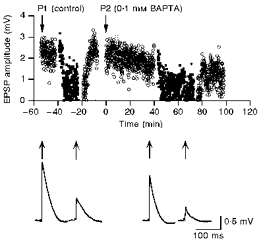
Time course of changes in the unitary EPSP amplitude during an individual experiment. First [Ca2+]o was changed from 2 mm (○) to 1 mm (▪) and then back to 2 mm (○) during a control recording (P1). The same sequence of changes in [Ca2+]o was performed 40 min after establishment of a second WCR on the presynaptic cell with 0.1 mm BAPTA (P2) included in the pipette solution. Reducing [Ca2+]o from 2 mm to 1 mm decreased the mean EPSP amplitude by 63% in the control WCR and by 68% after BAPTA dialysis, respectively. The traces below the graph show the mean EPSPs at 2 and 1 mm [Ca2+]o during the first WCR (left, amplitudes 2.2 and 0.82 mV) and the second WCR with 0.1 mm BAPTA (right, amplitudes 1.35 and 0.63 mV) in the presynaptic recording pipette. The arrows above each mean EPSP point to the time during which the unitary EPSPs were acquired. The traces represent means of sixty sweeps each.
EGTA dialysis and unitary EPSP amplitudes
The slow binding Ca2+ buffer EGTA has a dissociation constant comparable with that of BAPTA but its rate of Ca2+ binding is about two orders of magnitude smaller (Tsien, 1980; Naraghi, 1997). The lack of effect of intracellular EGTA on transmitter release in some synapses has been taken as evidence for a very short (i.e. molecular) distance between the cytoplasmic mouth of voltage-gated Ca2+ channels (referred to as a Ca2+ domain) and the Ca2+ sensor at the vesicle release site (Schweizer et al. 1995; for review). To establish whether by this criterion the axodendritic synapses resemble the squid giant synapse or more the large calyx-type synapse in the mammalian MNTB (Borst & Sakmann, 1996), we also measured unitary EPSPs during loading of presynaptic neurones with EGTA.
Figure 4A illustrates an experiment with 10 mm EGTA where EPSP amplitudes were reduced by 50% after 15 min of loading. Following formation of a third WCR with control pipette solution the mean EPSP amplitude recovered to 80% of its initial value. Figure 4B summarizes the effect of dialysing presynaptic neurones with 1 or 10 mm EGTA. Unitary EPSP amplitudes were reduced by 56 ± 2.3% with 10 mm EGTA (n = 4) whereas 1 mm EGTA reduced the size of unitary EPSPs by 15 ± 2.5% (n = 5). The effects of 10 and 1 mm EGTA were comparable in size to the effects of 1 mm and 0.1 mm BAPTA, respectively. The effect of 1 mm EGTA was comparable in size to the initial effect of forming a second WCR with a control solution (Fig. 4B, no buffer). This decrease with control solution was, however, transient and 15 min after formation of the second WCR, the EPSP amplitude had recovered. With 1 mm EGTA the decrease was stable and persisted more than 25 min after break in of the recording pipette.
Figure 4. Effect of dialysing a projecting neurone with EGTA on unitary EPSP amplitudes.

A, changes in the unitary EPSP amplitude during EGTA dialysis. Aa, representative presynaptic action potentials and Ab, the resulting mean unitary EPSP from three consecutive WCR. Each action potential (AP) and EPSP represents the mean of sixty consecutive sweeps. During the first WCR and the third WCR the presynaptic pipette contained no Ca2+ buffer. During the second WCR the presynaptic pipette contained 10 mm EGTA. The mean AP and EPSP of the second WCR are means of sixty stimuli given 20 min after break in of the seal. The amplitudes of the averaged EPSPs were (left to right): 2.75, 1.38 and 2.2 mV. Ac, unitary EPSP peak amplitudes as a function of time during first recording with control solution (P1), second recording with 10 mm EGTA added to the pipette solution (P2) and third recording with control solution in the presynaptic recording pipette (P3). B, effect of 1 and 10 mm EGTA included in the presynaptic pipette solution on the mean EPSP amplitude. For comparison, the effect of forming a second WCR with no Ca2+ buffer included in the presynaptic pipette solution (n = 4) and the effect of 1 mm BAPTA (n = 7) are also shown. Results are shown as bars ± s.e.m. The number of experiments with EGTA was five at 1 mm and four at 10 mm.
Binding of EGTA to Ca2+ is coupled to deprotonation of EGTA. At higher pH the binding rate of EGTA would increase, therefore we tested whether the effect of 10 mm EGTA on the EPSP amplitude was caused by an increase of the binding rate of EGTA due to pH differences in the terminal. The presynaptic pipette solution contained 10 mm EGTA and 30 mm Hepes. The EPSP amplitude was reduced by 50% in this experiment (data not shown), similar to the reduction of 56% observed with 10 mm EGTA and 10 mm Hepes.
The high calcium binding ratio of 10 mm EGTA may reduce resting [Ca2+]i and thereby affect transmitter release. We tested this possibility by making experiments in which the presynaptic neurone was loaded with a pipette solution containing 16 mm EGTA and 6 mm CaCl. In this solution the concentration of free EGTA is 10 mm and the free concentration of Ca2+ is 70 nM. The mean EPSP amplitude was reduced by 64 ± 6.1% (n = 4, ±s.d. data not shown) compared with 56 ± 6.9% reduction observed with 10 mm EGTA and no additional Ca2+. These effects of the two buffer solutions were not significantly different, indicating that the strong effect of EGTA on the mean unitary EPSP amplitude is not mediated via reducing the resting [Ca2+]i.
Control experiments
The experiments with BAPTA and EGTA included in the presynaptic recording pipette suggested that the buffers primarily reduced action potential evoked [Ca2+]i transients in the terminals. However, calcium buffers may also affect ionic conductances in the presynaptic neurone resulting in changes of the action potential waveform and propagation. In addition, if the buffers were released from the presynaptic cell they could also affect the action of transmitter on the postsynaptic neurone.
Unitary EPSPs in reciprocally connected neurones
To account for possible changes in electrical excitability or responsiveness to the transmitter in the postsynaptic neurone that were unrelated to transmitter release, the effect of BAPTA on unitary EPSPs was measured in reciprocally connected neurones. Action potentials were alternately evoked in the two neurones via brief somatic current injections. In Fig. 5A the pipette which recorded from cell A contained 0.75 mm BAPTA while the pipette recording from cell B contained control solution. The EPSPs recorded from cell B, the target neurone of cell A, decreased rapidly in amplitude. In comparison, the EPSPs recorded from cell A, the target neurone of cell B, remained constant (Fig. 5A). In six pairs of reciprocally connected pyramidal cells the effect of postsynaptic dialysis of BAPTA (0.5–1.5 mm) on unitary EPSPs was 104 ± 3% of control (Fig. 5B). This was significantly different from the blocking effect of presynaptic BAPTA dialysis and indicated that the effect of BAPTA is specific for the dialysed presynaptic neurone. Postsynaptic BAPTA at these concentrations did not affect mean EPSP amplitudes.
Figure 5. Effect of dialysing the postsynaptic cell with BAPTA and the effect of consecutive WCR formation on EPSPs.
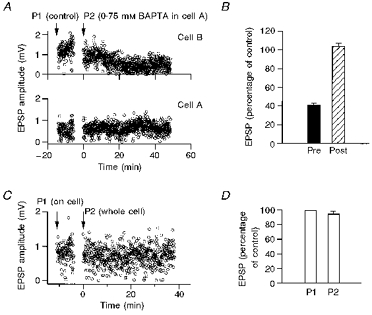
A, example of a reciprocally connected pair of pyramidal neurones, referred to as cell A and cell B. Unitary EPSP amplitudes were recorded from cell A and cell B, alternately. Upper panel, unitary EPSP peak amplitudes recorded from cell B, during loading of cell A with control solution (P1) and with solution containing 0.75 mm BAPTA (P2). Recording from cell B was done throughout the experiment with a control pipette solution. Lower panel, peak amplitudes of unitary EPSPs recorded from cell A. B, effect of dialysing BAPTA into one cell of reciprocally connected pairs (n = 6). When action potentials were evoked in the cell dialysed with BAPTA the EPSPs were recorded from the target cell dialysed with control solution. Amplitude changes were assumed to be the effect of presynaptic BAPTA (▪). When action potentials were evoked in the cell recorded with a control pipette solution, EPSPs were recorded from the cell dialysed with BAPTA and the effect of BAPTA was assumed to be postsynaptic ( ). Mean EPSPs during BAPTA dialysis were normalized to the mean EPSP amplitude in control. The BAPTA concentrations used in these experiments ranged between 0.5 and 1.5 mm. Bars represent the BAPTA effect as percentage of control EPSP ± s.e.m. C effect of break in of the presynaptic seal to a WCR on unitary EPSP amplitudes in the target cell. First, a loose cell-attached seal was established on the presynaptic neurone (left arrow) and action potentials were evoked by extracellular current stimulation (P1, on cell). Subsequent to this, a whole-cell recording was established on the same projecting neurone (right arrow) with a pipette containing control solution (P2, whole cell) and action potentials were evoked by intracellular current injection. D, the effect of forming a second WCR from the same projecting neurone on the EPSP amplitude was tested in two types of experiments. In one experiment (Fig. 5C) the first recording was performed with a loose cell-attached pipette sealed to the soma of the presynaptic neurone and the second recording was performed in whole-cell configuration with a control pipette solution without Ca2+ buffer. In three other experiments the first recording was performed in the whole-cell configuration with a control pipette solution and the second WCR was performed with the same control pipette solution. We averaged the effects of the second WCR with control pipette solution from the ‘on cell’ experiment (n = 1) and the experiments with two sequential WCRs with control pipette solution. P1 represents the mean EPSP amplitude of the first WCR as control. P2 represents the normalized mean EPSP amplitudes during the second recording with a control WCR pipette solution. The effect at P2 was measured 20 min after formation of the second WCR.
Effect of pipette ‘break in’ on unitary EPSPs
Successive whole-cell recordings from the same presynaptic neurone could have an effect on EPSP amplitude that is unrelated to Ca2+ buffering in the terminal, for example, by washout of cytoplasmic constituents essential for vesicle fusion. To evaluate the effect of establishing WCR on release, a loose seal ‘on cell’ recording was made on the presynaptic neurone and a WCR was made from the postsynaptic neurone. EPSPs were evoked by brief depolarizing current pulses that initiated action potentials in the soma of the presynaptic cell. After 15 min control recording, the pipette tip was retracted from the presynaptic cell and a WCR was established with a new pipette-containing control solution. Figure 5C illustrates an experiment where the mean EPSP amplitude decreased by 18% during the first 10 min following WCR and recovered to baseline within 20 min. In addition, in three successive WCR experiments were made from the same presynaptic neurone, each time with the same control pipette solution. Following the second WCR the mean EPSP amplitude decreased first by 12% and then recovered within 15 min (Fig. 5D).
The initial reduction of the mean unitary EPSP amplitude may arise from the depolarization of the presynaptic cell upon approaching the soma with the recording pipette, presumably due to K+ leakage from the pipette.
Action potential time course during BAPTA dialysis
Comparison of the time course and amplitude of somatic action potentials during BAPTA dialysis did not reveal significant changes in half-width or in peak amplitude. The peak amplitude of the action potentials was 80 ± 16 and 87 ± 8 mV (n = 8, ±s.d.) during control recordings and following presynaptic dialysis with BAPTA, respectively. The somatic action potential half-width was 1.35 ± 0.35 ms during control and 1.35 ± 0.49 ms following BAPTA dialysis. Neither the peak amplitude of somatic action potentials nor the half-width changed significantly (paired t test, P > 0.05). The peak amplitude of the intermediate afterhyperpolarization (AHP), observed in most L5 pyramidal neurones, was reduced from 4.2 ± 2 mV in control to 2.1 ± 1.4 mV during BAPTA dialysis (n = 8, P < 0.05). The AHP was not completely abolished during dialysis of the neurones with up to 1.5 mm BAPTA or 10 mm EGTA.
Variability of unitary EPSP amplitudes
Reduction of EPSP amplitudes following presynaptic dialysis with Ca2+ buffers presumably reflects a reduction of the quantal content of unitary EPSPs. We therefore measured the coefficient of variation (c.v.) of unitary EPSP peak amplitudes before and during BAPTA dialysis.
In all experiments where the presynaptic cell was dialysed with BAPTA (0.5–1.5 mm) or EGTA (1 or 10 mm), the decrease in the peak EPSP amplitudes was accompanied by an increase of their c.v. Figure. 6A shows consecutive sweeps from an experiment in which the presynaptic neurone was dialysed with control solution (left panel) and then with 1.5 mm BAPTA (right panel). The mean EPSP amplitude during BAPTA dialysis was reduced and the number of failures increased. The EPSP amplitude histograms (Fig. 6B) from the control recording (left panel) and during BAPTA dialysis (right panel) indicate that in this experiment the mean amplitude was reduced from 3.1 to 1.1 mV, the c.v. increased from 18.5 to 75.6%, the percentage of EPSP failures increased from 0 to 16%. Figure 6C shows a graphical analysis of the changes in the mean amplitudes and the c.v.2 (Faber & Korn, 1991) following loading with BAPTA (filled circles) or EGTA (open circles). This analysis is based on a binomial model of release and predicts that greater changes in the normalized squared c.v. of the EPSPs compared with changes in the normalized mean EPSP amplitude will arise from a presynaptic mechanism. In all experiments (n = 27), the data points were located below the identity line, suggesting that a presynaptic mechanism could account for the reduction in unitary EPSP amplitude.
Figure 6. Effect of BAPTA or EGTA dialysis of the projecting neurone on EPSP amplitude fluctuation.

A, consecutive sweeps of unitary EPSPs from a recording with control solution (left) and following loading of presynaptic neurone with 1.5 mm BAPTA (right). The mean presynaptic action potential of each recording is shown above the EPSP traces. Arrows indicate the time of the action potential peak. B, amplitude histograms of 180 responses to single presynaptic action potentials. Control recording (left) and recording following dialysis of the presynaptic neurone with 1.5 mm BAPTA (right), same experiment as in A. The mean EPSP amplitude was reduced from 3.1 to 1.1 mV following loading with BAPTA, the percentage of failures increased from 0 to 16%. C, plot of the normalized c.v.2 ratio (c.v.2 during control to c.v.2 during loading with buffer, ordinate) versus normalized mean EPSP amplitude ratio (mean amplitude during loading with buffer to mean amplitude during control, abscissa). Points represent twenty experiments with BAPTA (•) and seven experiments with EGTA (○).
Branch point failures
Propagation of the action potential in the main axon and into its collaterals to different presynaptic boutons depends on the geometry of the axonal arbor and on the ion conductances in axon collaterals. Since BAPTA and EGTA may affect Ca2+ dependent membrane conductances we tried to evaluate whether an increased number of branch point failures (BPF) could account for the observed decrease in EPSP amplitude following loading with BAPTA. In one experiment for which the geometry of the axon collaterals and locations of boutons was reconstructed (Fig. 1B and C) the mean EPSP amplitude was reduced by about 25% following loading with 0.5 mm BAPTA. Of the 300 sweeps of action potentials and evoked EPSPs recorded after 30 min of dialysis not a single action potential failed to evoke an EPSP. Four putative synaptic contacts were identified in this connection, three of which were made by the same fifth-order axonal branch. The fourth contact was located on a different fifth-order axonal branch but shared the first two branches with the other three contacts.
The probability of a complete failure of action potential propagation (pF) in this particular cell is given by eqn (A5c) in the Appendix. The release probability (pr) was calculated from the c.v. and the mean amplitude of the unitary EPSPs according to a binomial model. The value of pr, calculated from eqn (A4), was 0.76. Accordingly (1 - pr) was 0.24, which represents the probability that release failure occurred in this synapse. We solved eqn (A5c) for 0 < (1 - pr) < 0.24.
The observed value of pF was smaller than 0.0034 because no failures were detected in response to 300 presynaptic action potentials. We considered two boundary cases for the contribution of BPF to the fluctuations in the EPSP amplitudes. Firstly, the case when failures of the EPSP amplitudes were due to branch point failures alone (pr = 1). Solution of eqn (A5c) for pr = 1 yielded a value for the action potential failure in a branch point (pf) of 0.0017. Secondly, when there are no BPF and the variation in EPSP amplitudes was entirely due to release failures, in this case pr = 0.76 and pf = 0. The variation of pf between 0 and 0.0017 means that an increase in branch point failures after BAPTA loading, which would account for the failure rate pF of the EPSPs, could not account for the 25% reduction of the EPSP amplitude observed in this experiment.
DISCUSSION
Loading of L5 pyramidal neurones with the Ca2+ buffers BAPTA or EGTA was shown to reversibly reduce unitary EPSPs in connections between neighbouring L5 pyramidal cells. The concentration dependence of the effects suggests that the endogenous mobile Ca2+ buffer in nerve terminals is equivalent to less than 0.1 mm BAPTA and that at many release sites the Ca2+ domains are overlapping. These conclusions assume, however, that the added exogenous buffers replaced the endogenous mobile buffer, that both buffers affected release by interfering with Ca2+ diffusion in the terminals active zones and that the Ca2+ concentration in the microdomains around Ca2+ channels are in their extent mainly restricted by the mobile buffer (Roberts, 1994; Naraghi & Neher, 1997).
Time course of Ca2+ buffer effects and buffer mobility
The EPSP amplitude vs. time relation after establishing presynaptic WCR with a buffer-containing pipette indicated an approximately exponential decay with a time constant of about 10 min. This means that within about 15–20 min after membrane break in, the buffer diffusing out of the pipette reached a concentration in nerve terminals which resulted in a stable reduction of evoked release. The small diameter of the axon collaterals and the long axonal distance from soma to the boutons (range, 112–438 μm; 250 ± 69 μm, mean ±s.d.; Markram et al. 1997) raised the question as to whether the terminals were indeed loaded to reach a steady-state buffer concentration. We reconstructed two pairs of unidirectionally connected L5 neurones and determined the locations of their putative synaptic contacts. For both connections, the simulation of buffer diffusion indicated that the buffer concentration would reach a steady state within 15–25 min after break in and a concentration higher than 90% of the pipette-buffer concentration. Thus, the buffer concentrations given for the pipette solutions represent probably a slight overestimate of those in the terminals. The similarity between the time course of the effects of buffer loading on EPSPs of the effects and that of simulated buffer diffusion suggests that the buffer diffuses within the axon collaterals without encountering significant diffusion barriers. Such barriers, if they exist (e.g. at axonal branch points), may affect diffusion of molecules larger than BAPTA or EGTA.
Effects of exogenous buffers not related to evoked transmitter release such as non-specific, toxic effects seem unlikely because of the reversibility of the buffer effects. Also effects on resting [Ca2+]i which could reduce the mobilization of releasable vesicles are unlikely because when the [Ca2+]i was kept constant close to 70 nm by loading the neurone with a mixture of EGTA and Ca2+ similar effects on phasic release were observed.
Action potentials and branch point failures
Following loading of neurones with BAPTA at concentrations of up to 4 mm, which resulted in a 88% reduction of the unitary EPSP amplitude, no significant changes in the peak amplitude or the half-width of somatic action potentials were observed. However, axonal BAPTA may affect the conduction of the action potential in the axonal arbor and the waveform in the terminals. These possibilities cannot be excluded, but most of the effects of BAPTA on the action potential waveform (Jackson et al. 1991; Robitaille & Charlton, 1992; Bacskai et al. 1995) indicate that BAPTA would block the activation of Ca2+ dependent K+ channels. Such an effect, if present, would lengthen the action potential and would increase transmitter release, whereas a decrease was observed. Moreover, Mackenzie et al. (1996) measured Ca2+ transients in the axonal arbor of cortical neurones in culture in response to evoked somatic action potentials and found that in the presence of 0.75 mm intracellular fura-2 (a BAPTA based Ca2+ indicator), more than 95% of the somatic action potentials propagated to the boutons throughout the axonal arbor. Similar results were reported for basket cells in cerebellar slices (Llano et al. 1997).
However, if failures occur selectively in certain axonal branches (Lüscher & shiner, 1990a, b), the model would not predict the minimal number of EPSP failures. In this case the effect of the Ca2+ buffers would strongly depend on the spatial distribution of the contacts along the axonal arbor. The consistency of the effect of Ca2+ buffers on EPSP amplitude in different experiments argues, however, against this view. Secondly, a graphical analysis (Faber & Korn, 1991) of the EPSP amplitude factor versus c.v. factor before and following presynaptic loading with buffer indicated that in all experiments, a presynaptic mechanism could account for the reduction of mean EPSP amplitude. According to the binomial model, changes in the number of release sites due to BPF would be indicated in the graphical analysis as postsynaptic. Thus, the buffer effects were most probably due to restricting the diffusion of free Ca2+ in the cytoplasm of nerve terminals and not to an increased failure rate of axonal action potential propagation into axon collaterals.
Concentration dependence of fast and slow Ca2+ buffers on release
Unitary EPSP amplitudes were reduced to one-half by BAPTA at about 0.75 mm. This value is in the range found for BAPTA effects in other synapses such as the giant synapse of squid (0.73 mm; Adler et al. 1991) and the calyx-type synapse of the MNTB (< 1 mm; Borst et al. 1995), but it is lower than that estimated for outer hair cells (> 1.6 mm; Roberts 1993). The effect of exogenously added mobile buffers on release is predominantly due to their restriction of the extent of Ca2+ domains in active zones (Roberts 1994; Naraghi & Neher, 1997). Because 0.1 mm BAPTA produced a small but significant decrease in EPSP amplitude, the endogenous mobile Ca2+ buffer in pyramidal cell nerve terminals is equivalent to less than 0.1 mm BAPTA. This conclusion assumes, however, that BAPTA replaced the endogenous mobile buffer.
Low mobility of the endogenous mobile buffer would slow its washout from terminals and could explain the lack of ‘run-up’ of EPSP amplitudes during control dialysis. The endogenous mobile buffer could be a Ca2+ binding protein (CaBP) which has a molecular mass of the order of several tens of kilodaltons (kDa), such as calbindin or calmodulin. However, in bovine chromaffin cells (Zhou & Neher, 1993) the endogenous slow mobile buffer had a diffusion time constant in the range of 2–5 min which was ∼3 times that of BAPTA, that was used for calculating a molecular mass of the endogenous buffer of 7–20 kDa. In some of the present experiments, control WCR lasted for up to 3 h without detectable change in the EPSP amplitude, indicating that a slow mobile endogenous buffer would have to have a molecular mass in the order of hundreds of kilodaltons to diffuse from the terminals with a time constant of hours.
The blocking effect of 1 and 10 mm EGTA suggests that the average diffusional distance of Ca2+ between the inner mouth of Ca2+ channels and the Ca2+ sensor for phasic release is longer than, for example, in the squid giant synapse. A longer diffusional distance implies that, at variance with the squid nerve terminal, at many release sites the Ca2+ domains of several channels are likely to overlap to trigger fusion of a vesicle (Borst & Sakmann, 1996; Klingauf & Neher, 1997). The observation that after loading with a high BAPTA concentration (5 mm) some ‘residual’ release could be evoked indicates, however, that some Ca2+ channels are coupled tightly to Ca2+ sensors.
We could not determine the Ca2+ binding ratio of the endogenous buffer of L5 pyramidal cell terminals. This ratio is important for the redistribution of calcium ions after the Ca2+ domains have collapsed. At the large, calyx-type synapse of the MNTB the Ca2+ binding ratio was low (around 40, Helmchen et al. 1997). The similarity of the effects of added buffers on release in the MNTB synapses and in pyramid-to-pyramid synapses could suggest that the Ca2+ binding ratio in the terminals of pyramidal cells is also low, comparable with that of the calyx. In support of this view for the apical dendrite of L5 pyramidal cells, Helmchen et al. (1996) showed that the Ca2+ binding ratio was about 100 and that cytoplasmic buffers were relatively immobile.
Relative effectiveness of BAPTA and EGTA
EGTA has an affinity for Ca2+ similar to that of BAPTA (Tsien, 1980; Adler et al. 1991) but its binding rate constant for Ca2+ is about 100–160 times lower (Smith et al. 1984; Kao & Tsien, 1988; Naraghi, 1997). The effects of 1 and 10 mm EGTA were comparable with the effects of 0.1 mm and 1 mm BAPTA, respectively. The ratio in the effectiveness of BAPTA and EGTA to reduce transmitter release is thus smaller than the ratio expected from the difference in the binding rate constants. Ionic strength, temperature and pH may affect the kinetics of the buffers under our experimental conditions, However, a recent study (Naraghi, 1997) shows that in solution of comparable ionic strength and pH as used here for dialysis, the kinetics of EGTA or BAPTA do not change significantly. Our results are therefore unlikely to be due to different kinetics of the buffers when they are inside a neurone.
One possible explanation for the effects of low BAPTA concentration could be that BAPTA (0.1 mm) is locally saturated by a large Ca2+ influx. The extent of buffer saturation depends on [Ca2+]i, the buffer kinetics and concentration (Naraghi & Neher, 1997). Using indirect measurements of [Ca2+]i at release sites in terminals of goldfish retinal bipolar cells, the minimal Ca2+ concentration required for exocytosis was reported to be 50 μm (Von Gersdorff & Matthews, 1994) and 10 μm (Heidelberger et al. 1994). If such a high [Ca2+]i is required for phasic release in terminals of pyramidal neurones, then BAPTA could be partially saturated at 0.1 mm. In the case of saturation, an initial less sensitive component would be expected in the relation between BAPTA concentration and EPSP amplitude. Furthermore, BAPTA reduced transmitter release 10-fold more effectively than EGTA, both at low (0.1 mm) and high (1 mm) concentrations. If 0.1 mm BAPTA were saturated due to its high binding rate, at high concentrations of BAPTA less saturation would occur and the ratio of effectiveness of BAPTA to EGTA would be larger than at 0.1 mm BAPTA. Finally, 0.1 mm BAPTA had the same effect on release at low and high [Ca2+]o. Thus there is no clear evidence to suggest that the exogenously added BAPTA was saturated by the Ca2+ influx. In a recent simulation study (Naraghi & Neher, 1997) the effects of 1 mm BAPTA and 10 mm EGTA on transmitter release at the MNTB calyx synapse (Borst & Sakmann, 1996) were studied with a diffusional model in which multiple channels contributed to Ca2+ domains triggering release and where 1 mm BAPTA was partially saturated. Under the assumption of small buffer saturation the model predicted an effectiveness ratio of BAPTA to EGTA of 150.
Acknowledgments
We thank Dr E. von Kitzing for formulating the BPF model and A. Roth for simulation of buffer diffusion and constructive reading of the manuscript. We thank Dr J. Lübke for his expert help in detecting putative synaptic contacts. We thank Drs E. Neher and J. G. G. Borst for helpful discussion and critical reading of the manuscript. We also thank M. Kaiser for expert technical assistance. O. Ohana was supported by the Minerva Foundation.
APPENDIX
From the binomial model of release, the following relations can be written:
| (A1a) |
| (A1b) |
| (A1c) |
where q is the quantal size, N is the number of contacts and pr is the release probability at each contact.
The coefficient of variation (c.v.) is calculated according to:
 |
(A2) |
We introduced the coefficient of skewness (c.s.) which is calculated according to (E. von Kitzing, personal communication):
 |
(A3) |
From the above equations directly follows the relationship between the c.v., c.s. and pr:
| (A4) |
The probability pA of transmitter release failure in all contacts on path A (Fig. 7) is given by:
 |
(A5a) |
where pf is the probility of an action potential failure in a single branch, pr is the release probability at each contact.
Figure 7. Schematic drawing of the presynaptic axonal branching pattern used for calculating branch point failures.

Schematic drawing of the presynaptic axonal branching pattern with four putative synaptic contacts between the pair of cells shown in Fig. 1B and C. Each numbered line (1–5) represents a branch. The squares connecting the lines represent branch points. Filled circles represent the synaptic boutons. The axonal branches 3A, 4A and 5A are referred to as path A, the axonal branches 3B, 4B and 5B are referred to as path B. The initial branches are branches 1 and 2. Branch 1 is the first branch emerging from the main axon (i.e. the first axon collateral).
The probability pB of transmitter release failure in all contacts on path B (Fig. 7) is given by:
 |
(A5b) |
The probability pF of a complete failure of release in all contacts at the same time due to failures in the initial branches (1 and 2) or in the branches A and B yields:
 |
(A5c) |
References
- Adler EM, Augustine GJ, Duffy SN, Charlton MP. Alien intracellular calcium chelators attenuate neurotransmitter release at the squid giant synapse. Journal of Neuroscience. 1991;11:1496–1507. doi: 10.1523/JNEUROSCI.11-06-01496.1991. [DOI] [PMC free article] [PubMed] [Google Scholar]
- Bacskai BJ, Wallen P, Lev-Ram V, Grillner S, Tsien RY. Activity-related calcium dynamics in lamprey motoneurons as revealed by video-rate confocal microscopy. Neuron. 1995;14:19–28. doi: 10.1016/0896-6273(95)90237-6. [DOI] [PubMed] [Google Scholar]
- Bain AI, Quastel DMJ. Multiplicative and additive Ca2+-dependent components of facilitation at mouse endplates. The Journal of Physiology. 1992;455:383–405. doi: 10.1113/jphysiol.1992.sp019307. [DOI] [PMC free article] [PubMed] [Google Scholar]
- Bao J-X, Kandel ER, Hawkins RD. Involvement of pre- and postsynaptic mechanisms in posttetanic potentiation at Aplysia synapses. Science. 1997;275:969–972. doi: 10.1126/science.275.5302.969. [DOI] [PubMed] [Google Scholar]
- Borst JGG, Helmchen F, Sakmann B. Pre- and postsynaptic whole-cell recordings in the medial nucleus of the trapezoid body of the rat. The Journal of Physiology. 1995;489:825–840. doi: 10.1113/jphysiol.1995.sp021095. [DOI] [PMC free article] [PubMed] [Google Scholar]
- Borst JGG, Sakmann B. Calcium influx and transmitter release in a fast CNS synapse. Nature. 1996;383:431–434. doi: 10.1038/383431a0. [DOI] [PubMed] [Google Scholar]
- Delaney K, Tank DW, Zucker RS. Presynaptic calcium and serotonin-mediated enhancement of transmitter release at crayfish neuromuscular junction. Journal of Neuroscience. 1991;11:2631–2643. doi: 10.1523/JNEUROSCI.11-09-02631.1991. [DOI] [PMC free article] [PubMed] [Google Scholar]
- Faber DS, Korn H. Applicability of the coefficient of variation method for analyzing synaptic plasticity. Biophysical Journal. 1991;60:1288–1294. doi: 10.1016/S0006-3495(91)82162-2. [DOI] [PMC free article] [PubMed] [Google Scholar]
- Heidelberger R, Heinemann C, Neher E, Matthews G. Calcium dependence of the rate of exocytosis in a synaptic terminal. Nature. 1994;371:513–515. doi: 10.1038/371513a0. 10.1038/371513a0. [DOI] [PubMed] [Google Scholar]
- Helmchen F, Borst JGG, Sakmann B. Calcium dynamics associated with a single action potential in a CNS presynaptic terminal. Biophysical Journal. 1997;72:1458–1471. doi: 10.1016/S0006-3495(97)78792-7. [DOI] [PMC free article] [PubMed] [Google Scholar]
- Helmchen F, Imoto K, Sakmann B. Ca2+ buffering and action potential-evoked Ca2+ signaling in dendrites of pyramidal neurons. Biophysical Journal. 1996;70:1069–1081. doi: 10.1016/S0006-3495(96)79653-4. [DOI] [PMC free article] [PubMed] [Google Scholar]
- Hines ML, Carnevale NT. The NEURON simulation environment. Neural Computation. 1997;9:1179–1209. doi: 10.1162/neco.1997.9.6.1179. [DOI] [PubMed] [Google Scholar]
- Jackson MB, Konnerth A, Augustine GJ. Action potential broadening and frequency-dependent facilitation of calcium signals in pituitary nerve terminals. Proceedings of the National Academy of Sciences of the USA. 1991;88:380–384. doi: 10.1073/pnas.88.2.380. [DOI] [PMC free article] [PubMed] [Google Scholar]
- Kao JPY, Tsien R. Ca2+ binding kinetics of Fura-2 and azo-1 from temperature-jump relaxation measurements. Biophysical Journal. 1988;53:635–639. doi: 10.1016/S0006-3495(88)83142-4. [DOI] [PMC free article] [PubMed] [Google Scholar]
- Katz B. The Release of Neural Transmitter Substances. Springfield, IL, USA: Thomas; 1969. [Google Scholar]
- Klingauf J, Neher E. Modeling buffered Ca2+ diffusion near the membrane: implications for secretion in neuroendocrine cells. Biophysical Journal. 1997;72:674–690. doi: 10.1016/s0006-3495(97)78704-6. [DOI] [PMC free article] [PubMed] [Google Scholar]
- Kobayashi K, Sakaba T, Tachibana M. Potentiation of Ca2+ transients in the presynaptic terminals of goldfish retinal bipolar cells. The Journal of Physiology. 1995;482:7–13. doi: 10.1113/jphysiol.1995.sp020495. [DOI] [PMC free article] [PubMed] [Google Scholar]
- Korn H, Triller A, Mallet A, Faber DS. Fluctuating responses at a central synapse: n of bimomial fit predits number of stained presynaptic boutons. Science. 1981;213:898–901. doi: 10.1126/science.6266015. [DOI] [PubMed] [Google Scholar]
- Llano I, Tan YP, Caputo C. Spatial heterogeneity of intracellular Ca2+ signals in axons of basket cells from rat cerebellar slices. The Journal of Physiology. 1997;502:509–519. doi: 10.1111/j.1469-7793.1997.509bj.x. [DOI] [PMC free article] [PubMed] [Google Scholar]
- Lüscher H-R, Shiner JS. Computation of action potential propagation and presynaptic bouton activation in terminal arborizations of different geometries. Biophysical Journal. 1990a;58:1377–1388. doi: 10.1016/S0006-3495(90)82484-X. [DOI] [PMC free article] [PubMed] [Google Scholar]
- Lüscher H-R, Shiner JS. Simulation of action potential propagation in complex terminal arborizations. Biophysical Journal. 1990b;58:1389–1399. doi: 10.1016/S0006-3495(90)82485-1. [DOI] [PMC free article] [PubMed] [Google Scholar]
- Mackenzie PJ, Umemiya M, Murphy TH. Ca2+ imaging of CNS axons in culture indicates reliable coupling between single action potentials and distal functional release sites. Neuron. 1996;16:783–795. doi: 10.1016/s0896-6273(00)80098-7. 10.1016/S0896-6273(00)80098-7. [DOI] [PubMed] [Google Scholar]
- Markram H, Lübke J, Frotscher M, Roth A, Sakmann B. Physiology and anatomy of synaptic connections between thick tufted pyramidal neurones in the developing rat neocortex. The Journal of Physiology. 1997;500:409–440. doi: 10.1113/jphysiol.1997.sp022031. [DOI] [PMC free article] [PubMed] [Google Scholar]
- Mennerick S, Matthews G. Ultrafast exocytosis elicited by calcium current in synaptic terminals of retinal bipolar neurons. Neuron. 1996;17:1241–1249. doi: 10.1016/s0896-6273(00)80254-8. 10.1016/S0896-6273(00)80254-8. [DOI] [PubMed] [Google Scholar]
- Naraghi M. T-jump study of calcium binding kinetics of calcium chelators. Cell Calcium. 1997;22:255–268. doi: 10.1016/s0143-4160(97)90064-6. 10.1016/S0143-4160(97)90064-6. [DOI] [PubMed] [Google Scholar]
- Naraghi M, Neher E. Linearized buffered Ca2+diffusion in microdomains and its implications for calculation of [Ca2+] at the mouth of a calcium channel. Journal of Neuroscience. 1997;17:6961–6973. doi: 10.1523/JNEUROSCI.17-18-06961.1997. [DOI] [PMC free article] [PubMed] [Google Scholar]
- Neher E. Concentration profiles of intracellular calcium in the presence of a diffusible chelator. Experimental Brain Research. 1986;14:80–96. [Google Scholar]
- Neher E. The use of Fura-2 for estimating Ca buffers and Ca fluxes. Neuropharmacology. 1995;34:1423–1442. doi: 10.1016/0028-3908(95)00144-u. 10.1016/0028-3908(95)00144-U. [DOI] [PubMed] [Google Scholar]
- Nowycky MC, Pinter MJ. Time courses of calcium and calcium-bound buffers following calcium influx in a model cell. Biophysical Journal. 1993;64:77–91. doi: 10.1016/S0006-3495(93)81342-0. [DOI] [PMC free article] [PubMed] [Google Scholar]
- Roberts WM. Spatial calcium buffering in saccular hair cells. Nature. 1993;363:74–76. doi: 10.1038/363074a0. 10.1038/363074a0. [DOI] [PubMed] [Google Scholar]
- Roberts WM. Localization of calcium signals by a mobile calcium buffer in frog saccular hair cells. Journal of Neuroscience. 1994;14:3246–3262. doi: 10.1523/JNEUROSCI.14-05-03246.1994. [DOI] [PMC free article] [PubMed] [Google Scholar]
- Robitaille R, Charlton MP. Presynaptic calcium signals and transmitter release are modulated by calcium-activated potassium channels. Journal of Neuroscience. 1992;12:297–305. doi: 10.1523/JNEUROSCI.12-01-00297.1992. [DOI] [PMC free article] [PubMed] [Google Scholar]
- Sala F, Hernandez-Cruz A. Calcium diffusion modeling in a spherical neuron. Biophysical Journal. 1990;57:313–324. doi: 10.1016/S0006-3495(90)82533-9. [DOI] [PMC free article] [PubMed] [Google Scholar]
- Schweizer FE, Betz H, Augustine GJ. From vesicle docking to endocytosis: intermediate reactions of exocytosis. Neuron. 1995;14:689–696. doi: 10.1016/0896-6273(95)90213-9. 10.1016/0896-6273(95)90213-9. [DOI] [PubMed] [Google Scholar]
- Smith PD, Liesegang GW, Berger RB, Czerlinski G, Podolsky RJ. A stopped-flow investigation of calcium ion binding by ethylene glycol Bis(β-aminoethyl-ether)-N, N,-tetraacetic acid. Analytical Biochemistry. 1984;143:188–195. doi: 10.1016/0003-2697(84)90575-x. [DOI] [PubMed] [Google Scholar]
- Stern MD. Buffering of calcium in the vicinity of a channel pore. Cell Calcium. 1992;13:183–192. doi: 10.1016/0143-4160(92)90046-u. 10.1016/0143-4160(92)90046-U. [DOI] [PubMed] [Google Scholar]
- Stuart GJ, Dodt HU, Sakmann B. Patch-clamp recordings from the soma and dendrites of neurons in brain slices using infrared video microscopy. Pflügers Archiv. 1993;423:511–518. doi: 10.1007/BF00374949. [DOI] [PubMed] [Google Scholar]
- Tank DW, Regehr WG, Delaney KR. A quantitative analysis of presynaptic calcium dynamics that contribute to short-term enhancement. Journal of Neuroscience. 1995;15:7940–7952. doi: 10.1523/JNEUROSCI.15-12-07940.1995. [DOI] [PMC free article] [PubMed] [Google Scholar]
- Tsien RY. New calcium indicators and buffers with high selectivity against magnesium and protons: design, synthesis, and properties of prototype structures. Biochemistry. 1980;19:2396–2404. doi: 10.1021/bi00552a018. [DOI] [PubMed] [Google Scholar]
- Van der kloot W, Molgo J. Facilitation and delayed release at about 0°C at the frog neuromuscular junction: effects of calcium chelators, calcium transport inhibitors, and okadaic acid. Journal of Neurophysiology. 1993;69:717–729. doi: 10.1152/jn.1993.69.3.717. [DOI] [PubMed] [Google Scholar]
- Von gersdorff H, Matthews G. Dynamics of synaptic vesicle fusion and membrane retrievel in synaptic terminals. Nature. 1994;367:735–739. doi: 10.1038/367735a0. [DOI] [PubMed] [Google Scholar]
- Winslow JL, Duffy SN, Charlton MP. Homosynaptic facilitation of transmitter release in crayfish is not affected by mobile calcium chelators: implications for the residual ionized calcium hypothesis from electrophysiological and computational analyses. Journal of Neurophysiology. 1994;72:1769–1793. doi: 10.1152/jn.1994.72.4.1769. [DOI] [PubMed] [Google Scholar]
- Zhou Z, Neher E. Mobile and immobile calcium buffers in bovine adrenal chromaffin cells. The Journal of Physiology. 1993;469:245–273. doi: 10.1113/jphysiol.1993.sp019813. [DOI] [PMC free article] [PubMed] [Google Scholar]