

Abstract
A method to determine 18O kinetic isotope effects (KIE) in the hydrolysis of GTP is described that is generally applicable to reactions involving other nucleotide triphosphates. Internal competition, wherein the substrate of the reaction is a mixture of 18O-labeled and unlabeled nucleotides, is employed and the change in relative abundance of the two species in the course of the reaction is used to calculate KIE. The nucleotide labeled with 18O at sites of mechanistic interest also contains 13C at all carbon positions, while the 16O-nucleotide is depleted of 13C. The relative abundance of the labeled and unlabeled substrates or products is reflected in the carbon isotope ratio (13C/12C) in GTP or GDP, which is determined by use of a liquid chromatography-coupled isotope ratio mass spectrometer (LC-coupled IRMS). The LC is coupled to the IRMS by an Isolink™ interface (ThermoFinnigan). Carbon isotope ratios can be determined with accuracy and precision greater than 0.04%, and are consistent over an order of magnitude in sample amount. KIE values for Ras/NF1333-catalyzed hydrolysis of [β18O3,13C]GTP were determined by change in the isotope ratio of GTP or GDP or the ratio of the isotope ratio of GDP to that of GTP. KIE values computed in the three ways agree within 0.1%, although the method using the ratio of isotope ratios of GDP and GTP gives superior precision (< 0.1%). A single KIE measurement can be conducted in 25 minutes with less than 5 μg nucleotide reaction product.
Keywords: Ras, GTPase Activating Protein (GAP), GTP hydrolysis, Transition state, Enzyme mechanism, Kinetic isotope effect (KIE), Isotope ratio mass spectrometry (IRMS), Chemical reaction interface (CRI)
Introduction
Phosphoryl transfer reactions involving ATP and GTP constitute arguably the most ubiquitous biological reactions. The utility of such reactions in biology may be attributed to the fact that cleavage of a phosphoanhydride bond is highly exothermic[1, 2], while the kinetic barrier to bond cleavage is high[3]. Many enzymes facilitate phosphoanhydride bond cleavage and utilize the released free energy to accomplish various tasks in the cell[4]. These include, but are not limited to, motor proteins, molecular pumps, chaperones, and many enzymes in metabolic pathways that couple ATP hydrolysis to otherwise thermodynamically unfavorable reactions. G proteins[5] or protein kinases[6] use phosphoryl transfer as a means to modulate their own activity or that of their target.
One of the central tenets of enzymology is that enzymes achieve catalysis by preferentially stabilizing the transition state relative to the ground state[7-9]. Therefore, knowledge of the transition state structure is key to understanding the catalytic mechanism of an enzyme. Observation of kinetic isotope effects (KIE) form the basis for one of the most powerful methods to study the transition state[10]. KIE refers to the effect of isotopic substitution on reaction rate and is mathematically defined as the ratio of the reaction rate for the unlabeled reactant or substrate to that of the labeled reactant or substrate. The KIE observed for a non-catalyzed reaction is due only to differences in the vibrational properties of the transition state and the ground state, and therefore represents the “intrinsic KIE” associated with that reaction. However, the KIE observed for an enzyme-catalyzed reaction is a function of both the intrinsic KIE in the chemical step and the rate constants for non-chemical steps such as substrate binding and release, formation of intermediates, and conformational changes [11]. Frequently, the observed KIE in an enzymatic reaction is scaled down, relative to the intrinsic KIE, by forward and reverse commitment factors that depend on the extent to which the chemical step is rate-limiting. In cases where chemistry is completely or almost completely rate-limiting, the defining features of the transition state, such as bond lengths and bond angles, can be deduced from the observed KIEs for atomic positions that undergo changes in these properties at the transition state[12, 13].
KIEs can be measured by direct comparison of reaction rates, equilibrium perturbation, or internal competition methods [14]. Direct comparison of reaction rates that are measured separately for the unlabeled and labeled substrates is sufficiently precise if the isotope effect is large (> 1.1). Equilibrium perturbation is limited to reactions that are reversible and can be monitored with a spectrometer [15]. If the isotope effect is small (< 1.1), as is the case for 18O KIEs, internal competition is the method of choice. In this approach both isotopically labeled and unlabeled substrates are present in the reaction mixture, and the change in their relative abundance is used to calculate the KIE. The accuracy and precision of the KIE determination depends primarily on that of the measurement of relative abundance. In many KIE studies, measurement of the relative abundance is carried out by use of an isotope ratio mass spectrometer (IRMS), which is a specially configured instrument for precise measurement of isotopic abundance in gaseous molecules, e.g., the ratio of 13C and 12C in CO2. Therefore a critical aspect of the experimental design is the method used to convert the isotopically labeled sites of the substrate or product into a gaseous product such that the relative abundance of the labeled and unlabeled species of the reactants or products is reflected in the isotope ratio of the gas derivative. In cases where it is not experimentally tractable to do so, a method involving substrate labeled at both the site of chemical interest and at a remote “reporter” site may be used[16]. The isotopic abundance at the reporter site is monitored to yield the relative abundance of the doubly labeled and unlabeled substrates or products.
In KIE studies of phosphoryl transfer reactions, the reaction mixture contains substrate that is isotopically enriched with 18O at one or more positions and substrate in which 18O is at natural abundance (0.2%). Direct measurement of oxygen isotope ratios in reactant or products, or oxygen species derived from them, presents formidable experimental challenges. Cleland and colleagues used a double labeling method to determine 18O KIE in hexokinase-catalyzed phosphoryl transfer from ATP using the exocyclic amino group of adenine as the “reporter” site [17]. However, there has been no further study using this technique, presumably because of the difficulties associated with analytical chemistry: the method requires a large quantity of ATP (40 mg or 80 μmol ATP per experiment) and isolation and conversion of the ATP amine group to N2 in preparation for IRMS requires chemical manipulaton. We are not aware of any 18O KIE study on phosphoryl transfer reactions involving nucleotides other than ATP.
We have developed a double labeling, internal competition method to determine 18O KIEs in reactions involving nucleotide triphosphates. The substrate mixture is composed of 13C-depleted nucleotide and nucleotide that is labeled with 18O at sites of mechanistic interest and is also uniformly enriched with 13C. The relative abundance of the labeled and unlabeled substrates or products is thereby reflected by the macroscopic carbon isotope ratio (13C/12C). Another critical aspect of the method is the use of a liquid chromatography-coupled isotope ratio mass spectrometer (LC-coupled IRMS) in the determination of the carbon isotope ratio of the nucleotide. Connecting the LC and the IRMS is an Isolink™ interface (ThermoFinnigan) that chemically oxidizes carbon in the sample into CO2 in preparation for IRMS[18]. The use of LC/oxidization/IRMS allows direct determination of the isotope ratios of product and substrate, and thus the high sensitivity of the procedure. A KIE can be determined in a 25 minute chromatographic run with a precision around 0.1% using only 5 μg (10 nmole) GTP as substrate. We describe this method of KIE determination here and demonstrate its sensitivity and precision. As an example, we present individual determinations of KIE for hydrolysis of [β18O3, 13C]GTP, which is 18O-labeled at the β-γ bridge and the two β nonbridge oxygen positions, catalyzed by Ras and NF1333.
Materials and Methods
Materials
13C-labeled GMP and GTP (ammonium salt) were purchased from Spectra Gases, Inc. Enrichment in 13C is greater than 99% as determined by electrospray mass spectrometry. H218O (97% enriched) was from Isotech. Carbamate kinase (Enterococcus faecalis), guanylate kinase (porcine brain), pyruvate kinase (rabbit muscle), glycerokinase (E. coli), phosphoenolpyruvate (sodium), carbamoyl phosphate (sodium), cyanate (potassium), ADP (sodium), and phosphorus pentachloride were from Sigma. Nuclease P1 (Penicillium citrinum) was from Wako International, Japan. The reagents used for LC and Isolink, sodium peroxodisulfate, H3PO4, KH2PO4, and silver nitrate, were from Fluka. HPLC grade water was from Sigma. Guanine nucleotide kinase (Escherischia coli) was subcloned into a pET28 vector, over-expressed in E. coli, and purified by Ni affinity chromatography. Gαi1 (Rat) was prepared as described earlier [19].
Synthesis of [β18O3, 13C]GTP
[18O4]Pi was synthesized as tetrabutylammonium salt from PCl5 and H218O as described [20]. Carbamoyl [18O4]phosphate was synthesized by incubating a 690 μl mixture containing 157 mM [18O4]Pi, 739 mM KCNO, and 492 mM sodium acetate, pH 4.9, at 37°C for 20 minutes. The solution was then mixed with a 2.6 ml mixture containing 20 mg [13C]GMP, 0.2 mg ADP, 9 units guanylate kinase, 50 units of carbamate kinase, 15 mM MgCl2, and 75 mM HEPES, pH 7.5. The reaction mixture was incubated at 37°C for 4 hours. The product of the preceding coupled reactions, [β18-O3, β-γ18O, γ18O3, 13C]GTP, was then purified by anion exchange chromatography on a HiTrap Q column (5 ml, GE Healthcare). Elution was accomplished by a 20 column volume, 0 – 1 M gradient of ammonium acetate, pH7.1. [β18-O3, β-γ18O, γ18O3, 13C]GTP came off the column at approximately 0.7 M ammonium acetate, which was removed by lyophilization afterwards. [β18-O3, β-γ18O, γ18O3, 13C]GTP was then converted to [β18O3, 13C]GDP in a 1 ml reaction volume containing 1 mg Gαi1, 1mM MgCl2, 200 mM ammonium sulfate, and 20 mM Tris-HCl, pH7.5 after 15 hour incubation at 25°C. [β18O3, 13C]GDP was purified by ion exchange column chromatography and phosphorylated with unlabeled carbamoyl phosphate by carbamate kinase to yield [β18O3, 13C]GTP [21]. The enrichment level of 18O is about 96% as determined by electrospray mass spectrometry.
Synthesis of [12C]GTP
13C-depleted nucleotide monophosphates (NMP) were produced in E. coli grown on 12C glucose, and purified as described [22]. GMP was phosphorylated to GTP in coupled reactions catalyzed by pyruvate kinase and E. coli guanine nucleotide kinase, which catalyzes the phosphorylation of GMP with high specificity [23, 24]. The phosphorylation reaction was carried out in a 4 ml reaction volume containing 80 mg nucleotide monophosphates (about 20 mg of each nucleotide), 2 mg ATP (ammonium salt), 60 mg phosphoenolpyruvate, 30 units pyruvate kinase, 5 mg guanine nucleotide kinase, 5 mM MgCl2, 100 mM KCl, and 50 mM Tris-HCl, pH 8.0. The reaction was complete in 20 minutes at 25°C. [12C]GTP was separated from other nucleotides by anion exchange chromatography on two 5 ml HiTrap Q columns in tandem. NMPs were removed in this step, but residual [12C]ATP remains. The contaminating [12C]ATP was converted by glycerokinase to [12C]ADP in a 4 ml reaction volume containing 20 mg [12C]GTP, 5 units glycerokinase, 3.4 mM Glycerol, 2 mM MgCl2, and 100 mM Glycine-KOH, pH10. The hydrolysis was complete after 1 hour incubation at 22°C. Anion exchange column chromatography was repeated to remove [12C]ADP. Remaining impurities were removed with a C18 column (300 × 19 mm ID, 15 μm, 300 Å, Delta Pack, Waters). [12C]GTP was loaded and eluted isocratically with a buffer containing 1.5% Methanol and 200 mM triethylamonium bicarbonate, pH 7.5. Finally, [12C]GTP eluted from the C18 column was loaded onto a HiTrap Q column, eluted by a gradient of ammonium acetate, lyophilized, and stored at −20°C.
Preparation of substrate mixture of 12C and 13C nucleotide
The precision of isotope ratio measurements using an IRMS is optimal when the isotope ratio of the analyte is close to natural abundance. Accordingly, 13C-labeled nucleotide and 13C-depleted nucleotide were mixed in proportion to yield an apparent carbon isotope ratio of 1.11 +/- 0.04 %. The substrate mixture was further polished by ion-exchange column chromatography on a HiTrap Q column with ammonium acetate as eluting salt. The substrate mixture was then lyophilized, re-dissolved in water to a concentration of 2 mM, and stored at −20°C.
Protein expression and purification
A synthetic gene encoding residues 1 to 166 of human H-Ras [25] was sub-cloned into a pET28 vector. pGEX2T-CDC25 [26] and pGEX4T3-NF1333[27], which encode the CDC25 domain of mouse CDC25 and the catalytic fragment of human neurofibromin 1 (NF1), respectively, as N-terminal fusion proteins with glutathione-S transferase (GST) , were provided by Dr. Wittinghofer. Ras and CDC25 were co-expressed in E. coli strain BL21(DE3) and co-purified as a complex by Ni-affinity, glutathione affinity, and ion-exchange column chromatography. NF1333 was expressed in BL21(DE3) and purified by glutathione affinity and ion-exchange chromatography (HiTrap Q).
Steady state hydrolysis of GTP catalyzed by Ras and NF1333
A typical GTP hydrolysis reaction catalyzed by Ras and NF1333 was carried out in 30 μl volume that contained 4.0 mg/ml Ras-CDC25 complex, 6 μg/ml NF1333, 1 mM GTP, 25 μM MgCl2, and 50 mM HEPES, pH7.5 at 22°C. Typically a reaction reached 50% completion in 50 minutes. At different time points in the course of the reaction, aliquots of 10 μl were taken from the reaction mixture. Proteins in the sample were denatured in a 100°C heating block for 20 seconds and removed by centrifugation. The sample was diluted with H2O to 30 μl and stored at −20°C.
Measurement of peak areas and isotope ratios of GDP and GTP
The isotope ratios and peak areas of GDP and GTP were determined on an isotope ratio mass spectrometer (Finnigan MAT252) that was coupled to a HPLC system (Finnigan Surveyor) through an Isolink interface (Thermo Electron). A schematic diagram of the Isolink interface is shown in Figure 1. In short, the Isolink converts carbon in HPLC effluents to CO2, extracts the CO2 from the liquid phase, dries it, and introduces it into the IRMS [18]. A sample prepared as described in the previous section was loaded into a 20 μl injection loop and injected unto a high pressure DEAE column (BioBasic AX, Thermo Electron) in the presence of 100% buffer A (5 mM KH2PO4, pH5.3). GDP and GTP in the sample were separated with an elution program that consisted of a 4 minute step of 0% B (750 mM KH2PO4, pH5.3), a 3.5 minute step of 15% B, an 8 minute gradient to 70% B, and a 4 minute gradient to 100% B at a flow rate of 400μl/min. Inside the Isolink, HPLC effluent was mixed through a T joint with a solution of sodium peroxodisulfate (1M) and a solution of phosphoric acid (1.5M) with a catalytic amount of silver nitrate (0.5 mM) each at 50μl/min. The solutions for the HPLC and the Isolink interface were prepared using HPLC grade water and degassed under vacuum in an ultrasonic bath before use. Carbon in the solution was oxidized quantitatively into CO2 in a heated oxidation reactor, which was maintained at 99.9C°. CO2 escaped from the aqueous phase through thin membranes into a counter flow of helium in the separation unit. The helium stream carrying CO2 was subsequently dried by two Nafion units in series and admitted into IRMS. Signals corresponding to mass 44 (12C16O16O), 45 (13C16O16O and 12C17O16O), and 46 (12C18O16O, 13C17O16O, and 12C17O17O) were monitored by IRMS in separate channels. Chromatographic peaks were defined by a starting slope of 0.2 mV/S and an ending slope of 0.4 mV/S on mass 44 curve. Peaks of GDP and GTP were integrated, yielding both peak areas and carbon isotope ratios according to standard procedures implemented in the Isodat 2.0 software.
Figure 1.
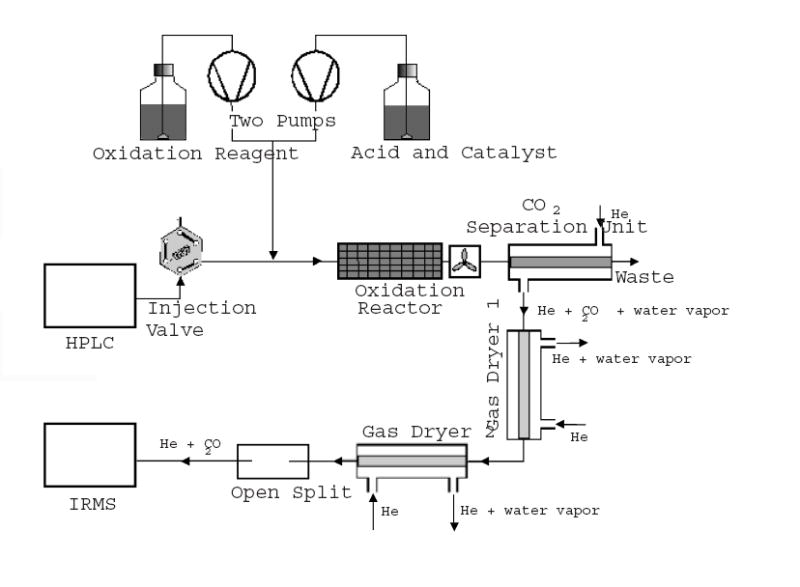
Schematic diagram of the ThermoFinnigan Isolink interface. HPLC effluent is mixed with oxidation reagents through a T joint. The carbon source is oxidized quantitatively into CO2 in a heated oxidation reactor. In the CO2 separation unit, CO2 escapes from the aqueous phase through thin membranes into a countercurrent flow of helium. The helium stream carrying CO2 is subsequently dried by two gas dryers (Nafion™) in series and admitted into IRMS.
Computation of KIEs
Three alternative methods (equations 1-3) were used to compute KIE, where Rs or Rp is the relative abundance of the doubly labeled nucleotide and 13C-depleted nucleotide in the substrate (Rs) or the product (Rp), respectively, at a fractional reaction extent f, and R0 or R100 is the relative abundance in the starting substrate or the product after complete hydrolysis, respectively [14]. Since 13C was not completely depleted in the 13C-depleted nucleotide, the observed carbon isotope ratios in GTP (Rs_obs) or GDP (Rp_obs) were corrected to obtain the change in the relative abundance. For example, Rp/Rs was computed according to Equation (4), where Rres is the residual carbon isotope ratio (0.09) in the 13C-depleted nucleotide as determined by LC/oxidization/IRMS. Rs/R0 and Rp/R100 were calculated similarly. Fractional reaction extent was calculated from mass 44 peak areas of GDP and GTP according to Equation (5).
| (1) |
| (2) |
| (3) |
| (4) |
| (5) |
Results and Discussion
Analytical scheme
We employed an internal competition method using 18O, 13C-labeled GTP and 13C-depleted GTP. The relative abundance of the labeled and unlabeled substrates or products is reflected in the carbon isotope ratio of GTP or GDP and determined using a LC/oxidization/IRMS system. Reaction mixtures containing GDP and GTP were injected directly unto the LC/oxidization/IRMS after removal of proteins by brief heating and centrifugation. GDP and GTP were separated on an anion exchange column, converted into CO2 in the Isolink interface, and introduced into the IRMS. Peak areas and isotope ratios of GDP and GTP furnished by IRMS were used to compute KIE according to equations (1-5).
Accuracy and precision of LC/oxidization/IRMS
Accurate determination of KIE depends on the accuracy with which changes in isotope ratios are measured. Because of the lack of GTP or GDP standards with known isotope ratios, we assessed the accuracy of LC/oxidization/IRMS by comparing the isotope ratios determined for GDP and GTP of the same origin. A sample was prepared that consisted of 0.19 μg/μl GDP and 0.25 μg/μl GTP. The GTP in the sample was a mixture of 13C-nucleotide and 12C-nucleotide formulated at the natural carbon abundance ratio. GDP in the sample was derived from the same GTP through complete hydrolysis catalyzed by Ras and GAP. Therefore, the isotope ratios of GDP and GTP were expected to be the same and the ratio of their isotope ratios should be close to 1.0 within experimental precision. Indeed, in three measurements of 12.5 μl injections, the isotope ratios of GDP and GTP were determined, respectively, in units of atom percent (at%), as (1.0773, 1.0778), (1.0767, 1.0772), and (1.0773, 1.0770). The ratios of the isotope ratio of GDP to that of GTP were hence 0.9995, 0.9995, and 1.0003. The average deviation from 1.0 over the three measurements was -0.0002, demonstrative of the accuracy in isotope ratio measurement. The precision in isotope ratio measurement was represented by the standard deviations in isotope ratios of GDP (1.0773, 1.0767, and 1.0773) and GTP (1.0778, 1.0772, and 1.0770), which were 0.0003 (0.03%) and 0.0004 (0.04%), respectively.
Dynamic range of LC/oxidization/IRMS
In principle KIE can be measured at any point in the time course of the reaction. However, as the reaction proceeds, GTP is converted to GDP. At the extremes of f, the quantity of either GTP or GDP in the sample may exceed, or fall below, the level required for accurate measurement of isotopic ratio and peak area. Consequently, reactions must be sampled at reaction extents (f) within the range of nucleotide quantity over which Rp, Rs, and f can be accurately and precisely measured. To define the suitable dynamic range of f, we measured isotope ratios and peak areas of GDP and GTP in the sample that consisted of 0.19 μg/μl GDP and 0.25 μg/μl GTP at sample amounts of 2.5, 5, 7.5, 12.5, and 25 μl. As shown in panel (A) and (B) in Figure 3, a slight dependence of isotope ratio on the quantity of nucleotide was observed. However, the change in isotope ratio as predicted by the respective linear fit for GDP or GTP is less than 0.001 at% in the range between 1μg and 6μg nucleotide. The observed isotope ratios for samples containing less than 0.5 μg GDP were higher. Therefore, measurements of isotope ratio made with 0.5 μg or less nucleotide were deemed to be inaccurate.
Figure 3.
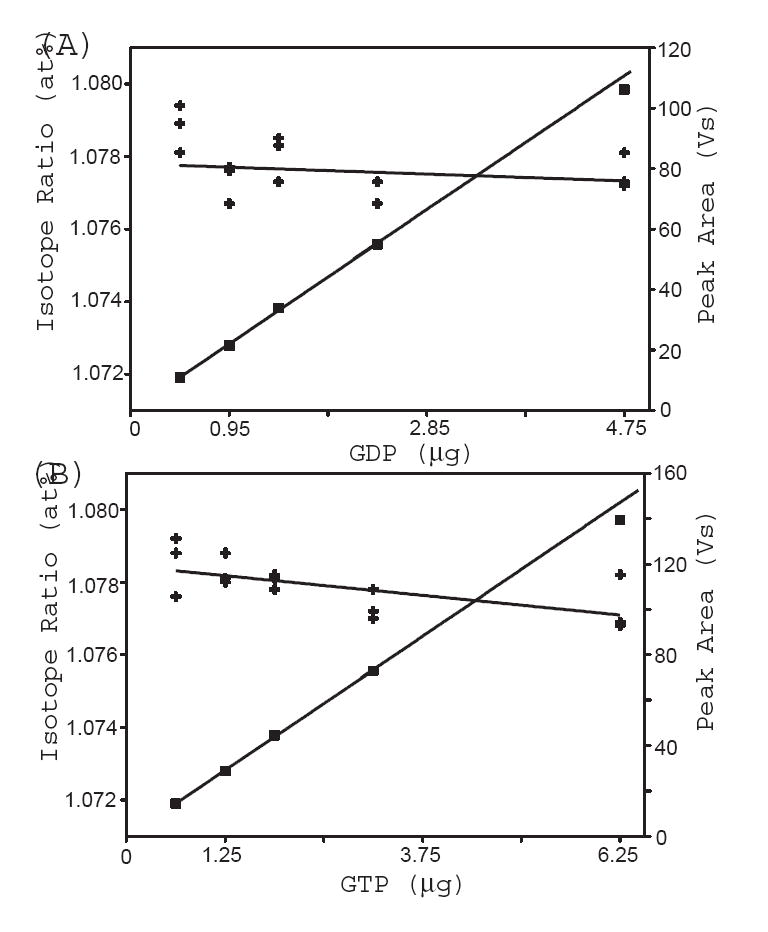
The isotope ratios and peak areas of GDP and GTP were measured for a sample containing 0.19 μg/μl GDP and 0.25 μg/μl GTP at sample amounts of 2.5, 5, 7.5, 12.5, and 25 μl. Panel (A) and (B) show the isotope ratio (+) and peak area ( ) versus sample amount for GDP and GTP, respectively.
Fractional reaction extent is calculated from the ratio of the peak area of GDP to the total area of GDP and GTP. Figure 3 shows excellent linear behavior of peak area with respect to sample quantity in the range from 1μg to 4μg nucleotide. Consequently, f is expected to be determined accurately within this dynamic range. The precision in the determination of the ratio of peaks areas, as judged by the standard deviation of three individual determinations, was approximately 1% for each sample amount. For quantity of GDP exceeding 5 μg, peak area was slightly smaller than the linear trend. This could not be attributed to saturation of the detector or insufficient oxidation in the Isolink interface. The peak height was well within the linear range of the detector and the characteristic broadening of sample peak due to insufficient oxidation was not observed. We hypothesize that CO2 separation unit in the Isolink cannot extract CO2 quantitatively for samples containing more than 5μg nucleotide.
In a typical sample, GDP and GTP were derived from 5 μg GTP as starting substrate and fractional reaction extent ranged from 0.2 to 0.8. Thus, the quantity of GDP or GTP under analysis ranged from 1μg to 4μg, where the accuracy and precision in the determination of both isotope ratio and f were optimal.
Practical considerations in measurement of isotope ratio
Accurate determination of isotope ratio requires quantitative conversion of carbon in GDP or GTP to CO2. If, for example, 13C- and 13C-nucleotides are oxidized at different rates, incomplete conversion potentially results in isotopic fractionation, such that the derived CO2 gas has a different isotope ratio from that of the nucleotide mixture. To investigate whether the oxidizing condition in the Isolink was sufficient to quantitatively convert carbon to CO2, we carried out measurements at different concentrations of oxidizing reagents. Typically, analyte was oxidized by mixing of 1 M sodium peroxodisulfate and 1.5 M H3PO4 (with a catalytic amount of Ag+) each at 50 μl/min with HPLC effluent at 400 μl/min and heating at 99.9°C. The isotope ratios of 5 μg natural GTP were observed to be 1.1397, 1.1397, 1.1402, and 1.1398 at% when flow rates of both solutions were set to 25, 50, 75, and 100 μl/min, respectively. Thus, the observed isotope ratio of GTP as determined by LC/oxidization/IRMS remained the same under increasingly more oxidizing conditions. We conclude that the oxidation condition used in our study was sufficient.
Isotopic fractionation of nucleotides during chromatographic separation can also affect the accuracy of isotope ratio determinations. That such fractionation occurs is evident from the variation in 45/44 ratio across the chromatographic peaks of GDP and GTP shown in panel (A) of Figure 2. Apparently 13C-labeled nucleotide was eluted from the HPLC column one or two seconds before 13C-depleted nucleotide. It is important to choose peak-picking parameters, namely the starting slope and the ending slope, so that a peak on mass 44, 45, or 46 curve is integrated in its totality. Starting and ending slopes define the starting and ending points and hence baseline, width, and area of a peak. To investigate whether the observed isotope ratio is sensitive to peak-picking parameters, we processed the particular chromatographic run in Figure 2 with different starting and ending slopes and tabulate the results in Table 1. The starting and ending slopes typically used in our studies, 0.2 and 0.4 mV/S respectively, constituted a robust set of parameters. Isotope ratio values did not change appreciably even when starting and ending slopes were varied by eight fold in either direction. This was true even for GTP, the peak length and peak area of which changed as much as a few percent with varying ending slope because of the long tail. This can be rationalized by the observation that isotopic fractionation occurs mainly in the bulk of the peak, not in the tail.
Figure 2.

Panel (A) and (B) show the 45/44 ratio and channel 44 signal, respectively, for a typical chromatographic separation on the LC/oxidization/IRMS. Three pulses of CO2 with known isotope ratios were introduced into the spectrometer at the beginning of the program to calibrate the measured isotope ratio. The CO2 for HEPES buffer was not admitted into IRMS, resulting in a lower background between 200 to 500 second. The baselines for the peaks identified by the starting and ending slopes typically used in our studies, 0.2 and 0.4 mV/S respectively, are shown in the figure.
Table 1.
Statistics for integration of GDP and GTP peaksa.
| Slope (mV/S)
|
GDP
|
GTP
|
|||||
|---|---|---|---|---|---|---|---|
| Starting | Ending | Width (S) | Area (VS) | I.R. (at%) | Width (S) | Area (VS) | I.R.(at%) |
| 0.2 | 0.05 | 98.3 | 58.79 | 1.0773 | 152.2 | 78.57 | 1.0772 |
| 0.2 | 0.4 | 97.8 | 58.78 | 1.0773 | 131.1 | 77.58 | 1.0770 |
| 0.2 | 3.2 | 78.9 | 58.07 | 1.0772 | 100.7 | 75.33 | 1.0769 |
| 1.6 | 0.4 | 90.5 | 58.62 | 10.771 | 127.1 | 77.57 | 1.0770 |
| 0.025 | 0.4 | 98.8 | 58.79 | 1.0773 | 131.1 | 77.58 | 1.0770 |
Statistics was obtained for the chromatographic separation of 2.4 μg GDP and 3.1 μg GTP shown in Figure 2. I.R. stands for isotope ratio.
Another concern arises when the isotope ratio of a nitrogen-containing compound, such as a nucleotide, is measured. Nitrogen oxides exist in forms of N2O, NO, N2O3, NO2, and N2O5. Of these gasses, N2O and NO2 can contribute to mass 44 (14N14N16O), 45 (14N15N16O), and mass 46 (14N16O16O and 14N16O18O). We are not aware of any study that investigates the chemical forms of nitrogen under the oxidizing condition in the Isolink. That the observed isotope ratio of natural GTP (1.14 at%) is close to natural abundance (1.11 at%) indicates that error introduced by nitrogen oxides, if present, is small. It is important to note that that it is the ratio of isotope ratios (Rp/Rs, Rs/R0, and Rp/R100), rather than their absolute values, that is used to calculate KIE. Small errors introduced by nitrogen oxides to isotope ratios are expected to cancel out when ratios are taken.
KIE for [β18O3,13C]GTP in hydrolysis of GTP catalyzed by Ras and NF1333
For an irreversible enzymatic reaction such as Ras-catalyzed GTP hydrolysis [1], the observed KIE is a function of the intrinsic KIE in the chemical step and the forward commitment of the reaction [11]. Forward commitment is the partition function for Ras•GTP•NF1 poised for the chemical step and is defined as the ratio of the rate of the chemical step to the net rate of GTP release from this intermediate into solution. Mathematically, forward commitment behaves like a scaling factor that reduces the observed KIE relative to the intrinsic KIE. In order to infer the transition state structure, it is desirable to reduce the commitment factors as much as possible so that the observed KIE approaches the intrinsic KIE. For this purpose, we included a guanine nucleotide exchange factor for Ras, CDC25, to accelerate GTP release from Ras [26].
To demonstrate the accuracy and precision of the method, we tabulate in Table 2 the individual determinations of KIE for [β18O3,13C]GTP in the hydrolysis of GTP catalyzed by Ras and NF1333. Three reactions were carried out. Each reaction mixture was divided into three aliquots and subjected to three chromatographic runs. For each run, KIEp, KIEs, and KIEp/s were calculated according to changes in the isotope ratio of the product (Rp/R100; equation 1), the substrate (Rs/R0; equation 3) and the ratio of isotope ratios of product and substrate (Rp/Rs; equation 2), respectively. Therefore nine values were obtained for each experiment. For each experiment, values of KIEp, KIEs, and KIEp/s were averaged separately, yielding three averaged values.
Table 2.
KIE determinations in GTP hydrolysis catalyzed by Ras and NF1333.
| labels | f | Rp_obs (at%) | Rs_obs (at%) | KIEpa | KIEsb | KIEp/sc |
|---|---|---|---|---|---|---|
| 13C | 0.000d | 1.0773f | ||||
| 0.515 | 1.0743 | 1.0811 | 1.0042 | 1.0053 | 1.0049 | |
| 0.567 | 1.0744 | 1.0817 | 1.0043 | 1.0053 | 1.0050 | |
| 0.660 | 1.0749 | 1.0821 | 1.0040 | 1.0045 | 1.0045 | |
| 1.000e | 1.0771f | |||||
| mean | 1.0042 | 1.0050 | 1.0048 | |||
| S.D. | 0.0002 | 0.0005 | 0.0003 | |||
|
| ||||||
| [13C, β18O3]#1 | 0.000d | 1.1510f | ||||
| 0.331 | 1.1421 | 1.1572 | 1.0116 | 1.0143 | 1.0118 | |
| 0.409 | 1.1408 | 1.1583 | 1.0140 | 1.0119 | 1.0130 | |
| 0.619 | 1.1434 | 1.1642 | 1.0137 | 1.0128 | 1.0127 | |
| 1.000e | 1.1520f | |||||
| mean | 1.0131 | 1.0131 | 1.0125 | |||
| S.D. | 0.0013 | 0.0012 | 0.0006 | |||
| [13C, β18O3]#2 | 0.000d | 1.1155f | ||||
| 0.312 | 1.1000 | 1.1352 | 1.0122 | 1.0148 | 1.0123 | |
| 0.382 | 1.1024 | 1.1395 | 1.0130 | 1.0125 | 1.0122 | |
| 0.705 | 1.1036 | 1.1438 | 1.0121 | 1.0119 | 1.0115 | |
| 1.000e | 1.1145f | |||||
| mean | 1.0124 | 1.0131 | 1.0120 | |||
| S.D. | 0.0005 | 0.0015 | 0.0004 | |||
| [13C, β18O3]#3 | 0.000d | 1.0779f | ||||
| 0.324 | 1.0682 | 1.0816 | 1.0113 | 1.0096 | 1.0113 | |
| 0.392 | 1.0682 | 1.0829 | 1.0119 | 1.0103 | 1.0118 | |
| 0.596 | 1.0698 | 1.0881 | 1.0123 | 1.0115 | 1.0123 | |
| 1.000e | 1.0772f | |||||
| mean | 1.0118 | 1.0105 | 1.0118 | |||
| S.D. | 0.0005 | 0.0010 | 0.0005 | |||
|
|
||||||
| Mean (all 3) | 1.0125 | 1.0122 | 1.0121 | |||
| S.D. | 0.0009 | 0.0017 | 0.0006 | |||
KIEs calculated using Equation (3).
KIEs calculated using Equation (1).
KIEs calculated using Equation (2).
Substrate at 0% reaction.
Product of 100% reaction.
Average of three independent measurements.
Precision of the method can be assessed by the standard deviations of the three KIEs calculated using the same equation within an experiment. The variations within the triplets originated from random errors in isotope ratio measurement, which was around 0.04% as reported in the previous section. The standard deviations were usually less than 0.1%, but in some instances were greater than 0.1% because errors in KIE depend on the method of computation as well and can be larger than errors in isotope ratio.
The accuracy of the method can be ascertained by comparing KIEp, KIEs, and KIEp/s averaged within one experiment or over all three experiments. Good agreement was observed between the average KIEp, KIEs, and KIEp/s for all three experiments –the standard deviations were 0.0003, 0.0006, and 0.0009 (not listed in Table 2), respectively. Excellent agreement was also found between KIEp, KIEs, or KIEp/s averaged over nine values in the three experiments, which were 1.0125, 1.0122, and 1.0121 with standard deviations of 0.0009, 0.0017, and 0.0006, respectively. The observed agreement demonstrates that all three ways of computing yield accurate KIE. However, it is important to note that the three ways of computing KIE are not equivalent. KIEp/s values had the smallest variations both within the experiment and between the experiments. The reason for this is two-fold. First, Rp/Rs is by definition the sum of Rs/R0 and Rp/R100, so the “signal” in Rp/Rs is larger than that in Rs/R0 or Rp/R100. Second, Rp and Rs are obtained in the same chromatographic run and some of the errors tend to cancel out in their ratio, so the “error” in Rp/Rs is lower. Therefore, we prefer to base our calculation of KIE values on Rp/Rs.
The variations observed among the three experiments, as judged by the averaged KIEp/s values of 1.0125, 1.0120, and 1.0118, can be accounted for by the errors in measurement. Since the purity of 13C-depleted and 13C-labeled nucleotides in the substrate mixture is critical to KIE measurement, the three experiments for [β18O3,13C]GTP were carried out using substrate mixtures that were independently mixed and purified. We conclude that that KIE measurement is reproducible for different preparations of substrate mixture.
It is also noted that the KIE for [13C, β18O3]GTP includes isotope effects in both 13C-labeling and 18O-labeling. The contribution of 13C to the overall isotope effect was determined to be 1.0048 (Table 2) using a substrate mixture consisting of 13C-depleted nucleotide and 13C-, but not 18O-, labeled nucleotide. The isotope effect in β18O3-labeling was found to be 1.0073, given by the ratio of KIEp/s for [β18O3,13C]GTP (1.0121, average of 1.0125, 1.0120, and 1.0118) and KIE for [13C]GTP (1.0048).
Comparison to previous methods for the measurement of 18O KIE in phosphoryl transfer reactions
Cleland and colleagues have developed double-labeling, internal competition methods to measure 18O KIE in phosphoryl transfer reactions, including the hydrolysis reactions of phosphate monoesters, diesters, and trimesters [28] and phosphoryl transfer from ATP to glucose catalyzed by yeast hexokinase[17]. In these studies, the remote nitrogen atom in the p-nitrophenyl leaving group of phosphoesters or in the adenine group of ATP, was used as the “reporter” atom, which is isolated and converted to N2 for IRMS analysis. This procedure is conducted offline and necessitates the use of large quantities of reactant or substrate (100 μmol p-nitrophenyl or 80 μmol ATP) for each experiment. The use of LC/oxidization/IRMS contributes to the ease of operation and high sensitivity of the method described here. The quantities necessary for KIE determination, namely the isotope ratios and peak areas of GDP and GTP, are measured in a single chromatographic run. The method is also highly sensitive in that each KIE determination requires only 5 μg (10 nmol) nucleotide. This high sensitivity should also allow the measurement of 18O equilibrium isotope effects in the binding of substrate to enzyme and 18O KIE under single turnover conditions.
Comparison of the CRI interface and the Isolink interface
Although the LC-coupled IRMS is ideally suited to the measurement of isotope ratio of soluble, nonvolatile compounds, which include most biologically active molecules, its application has lagged behind the analogous gas-phase technique, GC/IRMS. This can be attributed to the experimental challenges involved in coupling LC to IRMS. An interface is needed to convert the carbon atoms of the analyte quantitatively to CO2 in continuous mode. The carbon dioxide must also be extensively dried to maintain the high vacuum in the spectrometer. Before the advent of the Isolink interface, the only working interface for LC-coupled IRMS was the chemical reaction interface (CRI) designed by Abramson and colleagues[29-31]. In a CRI, solvent is first removed by a nebulizer, a Universal Interface, and a momentum separator before analyte is converted into small molecules such as CO2, CO, N2, etc, in a microwave-powered helium plasma in the presence of O2. In earlier KIE studies of Ras-catalyzed GTP hydrolysis we employed a CRI/IRMS [32].
We believe that the CRI interface should remain a viable interface for LC-coupled IRMS. The two types of LC-IRMS interface complement each other with respect to their compatibility with different chromatographic systems. The CRI interface works ideally with reverse phase chromatography and common organic solvents such as acetonitrile and methanol. By contrast, the Isolink interface does not tolerate carbon in the solvent and is compatible with ion exchange or mixed mode chromatography where inorganic salts or acids may be used as eluting reagent [18, 33]. The CRI interface is advantageous over the Isolink with respect to its versatility. The use of different reactant gasses in the CRI allows measurement of isotope ratio or detection of hydrogen, nitrogen, oxygen, sulfur, phosphorus, chlorine, bromine, and selenium [34]. Therefore, the CRI interface remains a very useful tool for KIE studies on reactions involving these elements either at site of chemical interest or as “reporter” site.
Conclusion
A highly sensitive and precise method has been developed to measure the 18O KIE in the hydrolysis of GTP. The methodology described here is generally applicable to reactions involving other nucleotide triphosphates and will allow mechanistic studies on a large number of enzymes, including nucleotide triphosphatases, nucleotide cyclases, protein kinases, motor proteins, chaperones, and other proteins that couple nucleotide hydrolysis to work.
Acknowledgments
We thank Dr. Alfred Wittinghofer at the Max Planck Institute for providing plasmids of CDC25 and NF1333; Dr. Robert Gregory at Southern Methodist University for granting access to the MAT252 isotope ratio mass spectrometer; Dr. Gabriele Varani at University of Washington for communications on the synthesis of [12C]NMPs. The characterization of 18O-, 13C- labeled nucleotides by electrospray mass spectrometry was carried out by the Protein Chemistry Technology Center at The University of Texas Southwestern Medical Center. This project has been supported by National Institute of Heath grant GM0714420.
Footnotes
Publisher's Disclaimer: This is a PDF file of an unedited manuscript that has been accepted for publication. As a service to our customers we are providing this early version of the manuscript. The manuscript will undergo copyediting, typesetting, and review of the resulting proof before it is published in its final citable form. Please note that during the production process errors may be discovered which could affect the content, and all legal disclaimers that apply to the journal pertain.
References
- 1.Guynn RW, Veech RL. The equilibrium constants of the adenosine triphosphate hydrolysis and the adenosine triphosphate-citrate lyase reactions. J Biol Chem. 1973;248:6966–6972. [PubMed] [Google Scholar]
- 2.George P, Witonsky RJ, Trachtman M, Wu C, Dorwart W, Richman L, Richman W, Shurayh FB, Lentz B. “Squiggle-H2O”, An enquiry into the importance of solvation effects in phosphate ester and anhydride reactions. Biochim Biophys Acta. 1970;223:1–15. doi: 10.1016/0005-2728(70)90126-x. [DOI] [PubMed] [Google Scholar]
- 3.Jencks WP. Ionization constants of acids and bases. In: Fasman GD, editor. Handbook of Biochemistry and Biochemistry and Molecular Biology. CRC Press; Cleveland: 1976. pp. 305–351. [Google Scholar]
- 4.Schlenk F. The ancestry, birth and adolescence of adenosine triphosphate. Trends Biochem Sci. 1987;12:367–368. [Google Scholar]
- 5.Sprang SR. G protein mechanisms: insights from structural analysis. Annu Rev Biochem. 1997;66:639–678. doi: 10.1146/annurev.biochem.66.1.639. [DOI] [PubMed] [Google Scholar]
- 6.Johnson LN, Barford D. The effects of phosphorylation on the structure and function of proteins. Annu Rev Biophys Biomol Struct. 1993;22:199–232. doi: 10.1146/annurev.bb.22.060193.001215. [DOI] [PubMed] [Google Scholar]
- 7.Pauling L. Chemical achievement and hope for the future. Am Sci. 1948;36:50–58. [PubMed] [Google Scholar]
- 8.Koshland DE., Jr Correlation of Structure and Function in Enzyme Action. Science. 1963;142:1533–1541. doi: 10.1126/science.142.3599.1533. [DOI] [PubMed] [Google Scholar]
- 9.Wolfenden R. Transition state analogues for enzyme catalysis. Nature. 1969;223:704–705. doi: 10.1038/223704a0. [DOI] [PubMed] [Google Scholar]
- 10.Melander L, Saunders WH. Reaction Rates of Isotopic Molecules. John Wiley & Sons; New York: 1980. [Google Scholar]
- 11.Northrop DB. The expression of isotope effects on enzyme-catalyzed reactions. Annu Rev Biochem. 1981;50:103–131. doi: 10.1146/annurev.bi.50.070181.000535. [DOI] [PubMed] [Google Scholar]
- 12.Schramm VL. Enzymatic transition states and transition state analog design. Annu Rev Biochem. 1998;67:693–720. doi: 10.1146/annurev.biochem.67.1.693. [DOI] [PubMed] [Google Scholar]
- 13.Cleland WW. Isotope effects: determination of enzyme transition state structure. Methods Enzymol. 1995;249:341–373. doi: 10.1016/0076-6879(95)49041-8. [DOI] [PubMed] [Google Scholar]
- 14.Cleland WW. Use of isotope effects to elucidate enzyme mechanisms. CRC Crit Rev Biochem. 1982;13:385–428. doi: 10.3109/10409238209108715. [DOI] [PubMed] [Google Scholar]
- 15.Cleland WW. Measurement of isotope effects by the equilibrium perturbation technique. Methods Enzymol. 1980;64:104–125. doi: 10.1016/s0076-6879(80)64007-5. [DOI] [PubMed] [Google Scholar]
- 16.O’Leary MH, Marlier JF. Heavy atom isotope effects on the alkaline hydrolysis and hydrazinolysis of methyl benzoate. J Am Chem Soc. 1979;101:3300–3305. [Google Scholar]
- 17.Jones JP, Weiss PM, Cleland WW. Secondary 18O isotope effects for hexokinase-catalyzed phosphoryl transfer from ATP. Biochemistry. 1991;30:3634–3639. doi: 10.1021/bi00229a007. [DOI] [PubMed] [Google Scholar]
- 18.Krummen M, Hilkert AW, Juchelka D, Duhr A, Schluter HJ, Pesch R. A new concept for isotope ratio monitoring liquid chromatography/mass spectrometry. Rapid Commun Mass Spectrom. 2004;18:2260–2266. doi: 10.1002/rcm.1620. [DOI] [PubMed] [Google Scholar]
- 19.Lee E, Linder ME, Gilman AG. Expression of G-protein alpha subunits in Escherichia coli. Methods Enzymol. 1994;237:146–164. doi: 10.1016/s0076-6879(94)37059-1. [DOI] [PubMed] [Google Scholar]
- 20.Lowe G, Sproat BS. Evidence of a dissociative SN1(P) mechanism of phosphoryl transfer by rabbit muscle pyruvate kinase. J Chem Soc Perkin Trans 1. 1978;12:1622–1630. [Google Scholar]
- 21.Du X, Frei H, Kim S-H. The mechanism of GTP hydrolysis by Ras probed by Fourier transform infrared spectroscopy. J Biol Chem. 2000;275:8492–8500. doi: 10.1074/jbc.275.12.8492. [DOI] [PubMed] [Google Scholar]
- 22.Batey RT, Inada M, Kujawinski E, Puglisi JD, Williamson JR. Preparation of isotopically labeled ribonucleotides for multidimensional NMR spectroscopy of RNA. Nucleic Acids Res. 1992;20:4515–4523. doi: 10.1093/nar/20.17.4515. [DOI] [PMC free article] [PubMed] [Google Scholar]
- 23.Gentry D, Bengra C, Ikehara K, Cashel M. Guanylate kinase of Escherichia coli K-12. J Biol Chem. 1993;268:14316–14321. [PubMed] [Google Scholar]
- 24.Oeschger MP, Bessman MJ. Purification and properties of guanylate kinase from Escherichia coli. J Biol Chem. 1966;241:5452–5460. [PubMed] [Google Scholar]
- 25.Miura K, Inoue Y, Nakamori H, Iwai S, Ohtsuka E, Ikehara M, Noguchi S, Nishimura S. Synthesis and expression of a synthetic gene for the activated human c-Ha-ras protein. Jpn J Cancer Res. 1986;77:45–51. [PubMed] [Google Scholar]
- 26.Lenzen C, Cool RH, Prinz H, Kuhlmann J, Wittinghofer A. Kinetic analysis by fluorescence of the interaction between Ras and the catalytic domain of the guanine nucleotide exchange factor Cdc25Mm. Biochemistry. 1998;37:7420–7430. doi: 10.1021/bi972621j. [DOI] [PubMed] [Google Scholar]
- 27.Scheffzek K, Ahmadian MR, Wiesmuller L, Kabsch W, Stege P, Schmitz F, Wittinghofer A. Structural analysis of the GAP-related domain from neurofibromin and its implications. Embo J. 1998;17:4313–4327. doi: 10.1093/emboj/17.15.4313. [DOI] [PMC free article] [PubMed] [Google Scholar]
- 28.Cleland WW, Hengge AC. Enzymatic mechanisms of phosphate and sulfate transfer. Chem Rev. 2006;106:3252–3278. doi: 10.1021/cr050287o. [DOI] [PubMed] [Google Scholar]
- 29.Teffera Y, Kusmierz JJ, Abramson FP. Continuous-flow isotope ratio mass spectrometry using the chemical reaction interface with either gas or liquid chromatographic introduction. Anal Chem. 1996;68:1888–1894. doi: 10.1021/ac951255b. [DOI] [PubMed] [Google Scholar]
- 30.Chen P, Teffera Y, Black GE, Abramson FP. Flow injection with chemical reaction interface-isotope ratio mass spectrometry: an alternative to off-line combustion for detecting low levels of enriched 13C in mass balance studies. J Am Soc Mass Spectrom. 1999;10:153–158. doi: 10.1016/S1044-0305(98)00133-0. [DOI] [PubMed] [Google Scholar]
- 31.Abramson FP, Black GE, Lecchi P. Application of high-performance liquid chromatography with isotope-ratio mass spectrometry for measuring low levels of enrichment of underivatized materials. J Chromatogr A. 2001;913:269–273. doi: 10.1016/s0021-9673(00)01032-3. [DOI] [PubMed] [Google Scholar]
- 32.Du X, Black GE, Lecchi P, Abramson FP, Sprang SR. Kinetic isotope effects in Ras-catalyzed GTP hydrolysis: evidence for a loose transition state. Proc Natl Acad Sci U S A. 2004;101:8858–8863. doi: 10.1073/pnas.0401675101. [DOI] [PMC free article] [PubMed] [Google Scholar]
- 33.McCullagh JS, Juchelka D, Hedges RE. Analysis of amino acid 13C abundance from human and faunal bone collagen using liquid chromatography/isotope ratio mass spectrometry. Rapid Commun Mass Spectrom. 2006;20:2761–2768. doi: 10.1002/rcm.2651. [DOI] [PubMed] [Google Scholar]
- 34.Abramson FP. CRIMS: chemical reaction interface mass spectrometry. Mass Spectrometry Reviews. 1994;13:341–356. [Google Scholar]