Figure 3.
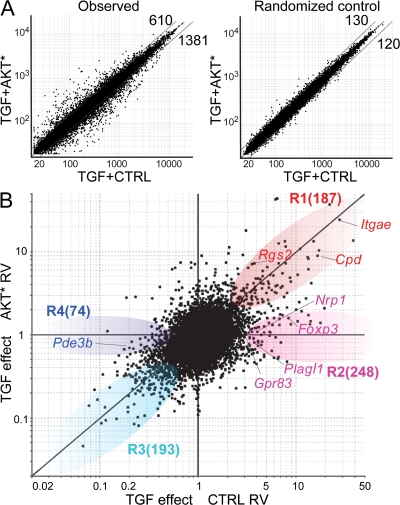
AKT* specifically targets a subset of the TGF-β signature. (A) Comparison of the expression values of TGF-β–activated cells transduced with CTRL or AKT* retrovirus (left) compared with a randomized dataset (right). (B) Fold change versus fold change (FcFc) plot comparing the TGF-β–induced signature in AKT*- versus CTRL-transduced cells. Gene expression values for cells activated in the absence of TGF-β and transduced with a CTRL retrovirus were used as the denominator for the Fc. Regions R1 and R3 highlight TGF-β–regulated genes that are refractory to AKT* expression. Regions R2 and R4 highlight TGF-β–regulated genes that are affected by AKT* expression.

