

Abstract
Salivary gland acinar cells shrink when Cl− currents are activated following cell swelling induced by exposure to a hypotonic solution or in response to calcium-mobilizing agonists. The molecular identity of the Cl− channel(s) in salivary cells involved in these processes is unknown, although ClC-3 has been implicated in several tissues as a cell-volume-sensitive Cl− channel. We found that cells isolated from mice with targeted disruption of the Clcn3 gene undergo regulatory volume decrease in a fashion similar to cells from wild-type littermates. Consistent with a normal regulatory volume decrease response, the magnitude and the kinetics of the swell-activated Cl− currents in cells from ClC-3-deficient mice were equivalent to those from wild-type mice. It has also been suggested that ClC-3 is activated by Ca2+-calmodulin-dependent protein kinase II; however, the magnitude of the Ca2+-dependent Cl− current was unchanged in the Clcn3−/- animals. In addition, we observed that ClC-3 appeared to be highly expressed in the smooth muscle cells of glandular blood vessels, suggesting a potential role for this channel in saliva production by regulating blood flow, yet the volume and ionic compositions of in vivo stimulated saliva from wild-type and null mutant animals were comparable. Finally, in some cells ClC-3 is an intracellular channel that is thought to be involved in vesicular acidification and secretion. Nevertheless, the protein content of saliva was unchanged in Clcn3−/- mice. Our results demonstrate that the ClC-3 Cl− channel is not a major regulator of acinar cell volume, nor is it essential for determining the secretion rate and composition of saliva.
It has been proposed that the ClC-3 channel, one of nine members of the mammalian Cl− channel (CLC) gene family, produces the swelling-activated Cl− currents present in most, if not all mammalian cells (Duan et al. 1997). Expressed ClC-3 channels exhibit a weak outwardly rectifying steady-state current-voltage (I-V) relationship, inhibition by phorbol esters and time-dependent inactivation at very positive voltages (Kawasaki et al. 1994; Duan et al. 1997), much like the swell-activated Cl− currents found in most native cells (Strange et al. 1996). In agreement with these expression studies, both antisense oligonucleotides and intracellular dialysis with an anti-ClC-3 antibody decrease the magnitude of the swell-activated Cl− currents in bovine epithelial and canine pulmonary arterial smooth muscle cells (Wang et al. 2000; Duan et al. 2001). In contrast, others have shown that ClC-3 currents display outward rectification and are neither activated by osmotic swelling (Ogura et al. 2002) nor inhibited by phorbol esters (Li et al. 2000), properties that are comparable to those exhibited by ClC-4 and ClC-5 (Friedrich et al. 1999; Li et al. 2000), which are intracellular CLCs with the greatest homology to ClC-3. Other investigators were unable to record Cl− currents or enhanced Cl− permeability after heterologous expression of ClC-3 (Steinmeyer et al. 1995; Stegen et al. 2000; Weylandt et al. 2001).
Although ClC-3 channels can apparently target the plasma membrane under some conditions (Huang et al. 2001; Weylandt et al. 2001), cell fractionation studies indicate that ClC-3 is primarily an intracellular channel located in the late endosomal compartment of liver cells, as well as synaptic vesicles in the brain, where in this latter tissue it may play a critical role in intravesicular acidification. Indeed, disruption of ClC-3 expression leads to postnatal degeneration of the hippocampus and the retina (Stobrawa et al. 2001). Dickerson et al. (2002) described generally similar age-dependent retinal and neural pathology in an independently generated Clcn3-null mutant mouse, and this group has also described other major findings including astrogliosis, abnormal gait, kyphosis and altered vascular reactivity (Dickerson et al. 2001, 2002).
Stobrawa et al. (2001) also demonstrated that targeted disruption of the Clcn3 gene has no effect on the swell-activated Cl− current in pancreatic acinar cells and hepatocytes. In agreement with these observations, immunofluorescence studies show that ClC-3 is expressed primarily in the canalicular membranes of hepatocytes (Shimada et al. 2000). It is interesting to note that ClC-Ka and ClC-Kb, two kidney-specific members of the CLC gene family, target the plasma membrane only in the presence of Barttin, an apparent β-subunit (Estévez et al. 2001). Moreover, a splice variant of ClC-3 contains a domain that interacts with scaffolding proteins, which enhances targeting of ClC-3 to the plasma membrane (Ogura et al. 2002). These latter studies may explain the conflicting ClC-3 functional results; observed differences among various tissues and expression systems may reflect different expression levels of a chaperone protein or the ClC-3 splice variant, resulting in tissue- and cell-specific localization patterns for ClC-3. Moreover, Cl− currents activated by Ca2+-calmodulin-dependent protein kinase II appear when human ClC-3 is stably expressed in epithelial cells (Huang et al. 2001). With regard to this latter finding, activation of a Ca2+-gated Cl− channel is critical for initiating secretion by salivary acinar cells (Begenisich & Melvin, 1998). Thus, the function of ClC-3 may vary in different cell types depending on the targeting and the expression of regulatory proteins.
This raises the possibility that ClC-3 Cl− channels in salivary gland acinar cells play a role in fluid secretion and/or volume regulation by directly contributing to or modulating Cl− channel activity in the plasma membrane. Alternatively, ClC-3 may be localized to an intracellular compartment in acinar cells where it could regulate salivary protein secretion. To test these hypotheses, Clcn3-gene-targeted knockout mice were studied. Cell volume regulation, swell-activated Cl− currents, and Ca2+-dependent Cl− currents were unaltered in Clcn3−/- mice. ClC-3 also appeared to be highly expressed in the smooth muscle layer of blood vessels in the gland, indicating that ClC-3 may regulate salivation by modulating blood flow. However, in response to in vivo cholinergic stimulation, the protein content, ionic composition and the volume of saliva were unchanged. These results indicate that the ClC-3 Cl− channel is not a major participant in cell volume regulation or secretion of saliva by acinar cells. Portions of this work have been published previously in abstract form (Melvin et al. 2000).
Methods
Clcn3 mutant mice
Targeted disruption of the murine Clcn3 gene was performed as described previously (Dickerson et al. 2002). Heterozygous 129/SvJ-C57BL/6 offspring were used to establish breeding colonies at the University of Rochester vivarium. Animal breeding was performed as approved by the University of Rochester Committee on Animal Resources (IACUC). All animals were housed in micro-isolator cages and had access to laboratory chow and water ad libitum, with a 12 h:12 h light:dark cycle. A total of 459 pups were born in our University of Rochester facility. Of these, 115 (25.1 %) were wild-type, 268 (58.4 %) were heterozygous and 76 (16.6 %) were homozygous for the null mutation. As described previously (Dickerson et al. 2002), many of the knockout mice die due to an unknown cause (30 out of 76 died by 6 weeks of age). Homozygous Clcn3−/- mice exhibited reduced body weight. Salivary gland wet weights were comparable, with the exception of the submandibular gland, which was significantly smaller in Clcn3−/- male mice.
In our experiments, where animals 8–20 weeks old were used, the body weight of Clcn3+/+ mice for males was 30.8 ± 2.0 g (n = 11) and 21.1 ± 1.6 g (n = 6) for females, whereas the body weight for male Clcn3−/- mice was significantly less at 22.1 ± 1.8 g (n = 7; P < 0.008) and 17.8 ± 0.9 g (n = 5; P < 0.12) for females. The salivary gland weights were, for parotid glands: in Clcn3+/+ mice 76.3 ± 8.0 mg (n = 9) for males and 67.0 ± 13.7 mg (n = 5) for females and in Clcn3−/- mice 67.7 ± 5.3 mg (n = 5) for males and 63.5 ± 6.2 mg (n = 4) for females; for submandibular glands: in Clcn3+/+ mice 168.1 ± 26.3 mg (n = 5) for males and 67.8 ± 8.1 mg (n = 3) for females; and in Clcn3−/- mice 104.4 ± 24.5 mg (n = 3) for males and 63.5 ± 2.8 mg (n = 4) for females; and for sublingual glands: in Clcn3+/+ mice 20.1 ± 4.1 mg (n = 5) for males and 18.0 ± 1.2 mg (n = 3) for females; and in Clcn3−/- mice 16.0 ± 3.5 mg (n = 3) for males and 23.4 ± 2.0 mg (n = 4) for females. The mouse submandibular gland is generally two- to threefold larger in males due to the expression of testosterone-sensitive granular convoluted duct (GCD) cells. However, morphological examination of four wild-type and four null mutant mice demonstrated that the decreased size of the submandibular gland in male Clcn3−/- mice could not be explained by the loss of GCD cells (data not shown). The number and size of these cells appeared normal, although detailed morphometric analyses were not performed.
Acinar cell preparation
Parotid acini from adult Clcn3+/+ and Clcn3−/- gender- and age-matched littermates were isolated as described previously (Evans et al. 2000) using a protocol approved by the IACUC. Briefly, mice were killed by exsanguination following exposure to CO2 gas, and the glands were removed and finely minced in digestion medium (Eagle's modified essential medium, EMEM; Biofluids, Rockville, MD, USA) containing collagenase P (0.3 mg 7.5 ml−1 per animal; Boehringer Mannheim, Germany) and 1 % bovine serum albumin (BSA). The minced glands were incubated at 37 °C in a shaker for 80 min and dispersed by gentle pipetting every 20 min. At the end of the digestion period, the acinar preparation was resuspended in EMEM and incubated at 22 °C in 5 % CO2-95 % O2.
Single cells were isolated from parotid glands for patch-clamp experiments by digesting for 10 min with 0.02 % trypsin, followed by 60 min digestion with 0.04 mg ml−1 collagenase P (Arreola et al. 1995). Cells were resuspended in Eagle's basal medium (Life Technologies) containing 2 mm glutamine with penicillin and streptomycin, attached to poly-l-lysine-coated coverslips, and incubated at 37 °C in 5 % CO2/95 % air.
Electrophysiological analysis
The whole-cell configuration of the patch-clamp technique was used to record currents from single parotid acinar cells. Glass pipettes were fabricated to have 3–4 MΩ resistance when filled with the internal solution. Recordings were performed at room temperature (22 °C) using either an Axopatch 1-D or 200B amplifier (Axon Instruments, Foster City, CA, USA). Measured junction potentials for the solutions used were less than 3 mV and so no correction was applied.
Currents through swell-activated Cl− channels were recorded in cells dialysed with a pipette solution containing (mm): tetraethylammonium chloride 140, EGTA 10, MgATP 5, Hepes 20, pH 7.3. Cells were bathed in a solution containing (mm): NMDG-Cl 140, CaCl2 0.5, Hepes 10, d-mannitol 50, pH 7.4. Hypotonic and hypertonic solutions were made by omitting d-mannitol and by increasing the d-mannitol concentration to 100 mm, respectively. Swell-activated Cl− channels were activated by exposing cells to the hypotonic solution ≈5 min after breakthrough. Data acquisition was performed using a 12 bit analog/digital converter controlled by a personal computer. Currents were filtered at 1 kHz using a four-pole low-pass Bessel filter and then sampled at 5 kHz. Voltage-clamp steps of 0.75 s duration were applied in 20 mV increments from −100 to +100 mV from a −50 mV holding potential.
Currents through Ca2+-dependent Cl− channels were measured with an external solution containing (mm): KCl 5, NaCl 120, CaCl2 2, MgCl2 0.8, glucose 10, Hepes 10, pH 7.4. In order to minimize swell-activated currents, the tonicity of this solution was increased with 30 or 70 mm mannitol. The internal solution used for these recordings contained (mm): HCl 45.8, glutamic acid 80, NMDG 133, CaCl2 7.1, EGTA 10, Hepes 20, pH 7.2 (with NMDG). The free Ca2+ concentration of this solution was computed to be 400 nm according to the Sliders version 2.00 computer program (Bers et al. 1994). Voltage-clamp steps of 3 s duration from −30 to +90 mV were applied from a −50 mV holding potential.
Immunohistochemistry
Parotid glands from Clcn3−/- (negative control) and wild-type animals were removed and incubated overnight in 4 % paraformaldehyde at 4 °C. Paraformaldehyde-treated tissue was paraffin-embedded and sectioned at 5 μm. Deparaffinized sections were incubated overnight at 4 °C in PBS, 0.8 % BSA, 0.1 % gelatin, 0.1 % Triton X-100, and 5 % normal goat serum containing a 1:250 dilution of an anti-ClC-3 antibody (Alomone Laboratories, Israel), and then treated with 1:1000 Alexa-594 fluor-conjugated goat anti-rabbit secondary antibody (Molecular Probes, Eugene, OR, USA) diluted in the above buffer for 1 h at room temperature. Images were recorded and analysed using a Nikon E800 upright microscope equipped with a fluorescent source and a Spot2 CCD camera.
Western blot analysis
Parotid gland homogenates were prepared from Clcn3−/- and wild-type animals to identify native ClC-3 protein. Tissues were prepared as described previously by Turner et al. (1986). Glands were homogenized twice by 10 s strokes at power level 5 with a polytron homogenizer (Brinkmann Instruments, Westbury, NY, USA) in 5 ml (g tissue)−1 of homogenization solution containing 10 mm Hepes adjusted to pH 7.4 with Tris, 10 % sucrose, 1 mm EDTA, 1 mm phenylmethylsulphonyl fluoride (PMSF), with one tablet of COMPLETE protease inhibitor (Roche Applied Science, Indianapolis, IN, USA) per 50 ml. Homogenates were centrifuged at 2 500 g for 15 min at 4 °C and the supernatants saved. The pellets were resuspended in 5 ml of homogenization buffer per gram of starting tissue, then homogenized and recentrifuged as above. The supernatants were combined and crude membrane proteins were precipitated by centrifugation at 22 000 g for 20 min at 4 °C. The supernatants from this step were discarded and the pellets were resuspended in PBS containing 1 mm EDTA, 1 mm PMSF, and COMPLETE protease inhibitor (1 tablet per 50 ml) then passed once through a 25-gauge needle and once through a 30-gauge needle. Aliquots were quickly frozen in liquid N2 and stored at −85 °C until use. Approximately 100 mg of crude membrane protein was separated by two-phase tricine (T) polyacrylamide gel electrophoresis (10 %T/6 %C resolving layer, 4 %T/3 %C stacking layer), and transferred onto nitrocellulose membrane (Hybond ECL, Amersham Pharmacia Biotech, Pisscataway, NJ, USA) in buffer containing 10 mm 3-(cyclohexylamino)-1-propanesulphonic acid adjusted to pH 11 and 10 % methanol. The blot was blocked overnight at room temperature in PBS blocking buffer containing 1 % Tween-20, 4 % BSA, and 1 % normal goat serum. After blocking, the blot was incubated for 2 h at room temperature in blocking buffer containing a 1:250 dilution of a rabbit anti-ClC3 polyclonal antibody (Alomone Laboratories), washed three times with PBS-T (PBS containing 1 % Tween-20), incubated for 1 h at room temperature in blocking buffer containing a 1:5000 dilution of HRP-conjugated goat anti-rabbit IgG (Jackson ImmunoResearch Laboratories, West Grove, PA, USA), and again washed three times with PBS-T. Immune complexes were detected on film using enhanced chemiluminescence (Amersham Pharmacia Biotech).
RNA analysis
Total RNA was prepared from enzymatically dispersed parotid acinar cells from adult Clcn3+/+ and Clcn3−/- littermates using Trizol reagent (Life Technologies) and analysed by RT-PCR as described previously (Park et al. 1999). Four overlapping RT-PCR primers were designed to amplify the ClC-3 message from isolated parotid acinar cells including two sense primers (U1 and U2) complimentary to codons 34–40 and 384-391, respectively, and two nonsense primers corresponding to codons 209–214 and 590–597 (L1 and L2, respectively). The PCR products were inserted into the pCR2.1 TA cloning vector (InVitrogen) and sequenced using the T7 Sequenase 7-deaza-dGTP DNA sequencing kit (Amersham Life Science).
Cell volume determinations
Cell volume was estimated by confocal microscopy, as described previously (Schreiber et al. 1999). The dispersed acini were loaded with the fluoroprobe calcein by incubation for 15 min at room temperature in 2 μm calcein-AM (Molecular Probes). Acini were allowed to adhere to the base of a superfusion chamber that was mounted on an Olympus PMT2 fluorescence microscope interfaced with an Ultima confocal microscope (Genomic Solutions, Ann Arbor, MI, USA). Intracellular dye was excited with the 488 nm band of an argon laser and emitted fluorescence was measured at 530 nm. Changes in cell volume were monitored by measuring the fluorescence intensity of intracellular calcein within a user-defined volume. In combination with an Olympus DplanApo × 40 objective, a 225 μm confocal pinhole produces an approximately 4-μm-thick optical section in the z-direction. Using Ultima software, an x-y area of the two-dimensional image was circumscribed within individual acini. Cell volume is expressed in arbitrary units as 1/normalized calcein fluorescence (1/calcein Fn).
Stimulated flow rates and saliva composition
Adult age- and gender-matched littermates (Clcn3+/+, n = 17; and Clcn3−/-, n = 12) were anaesthetized with 300 mg chloral hydrate (kg body weight)−1 (i.p.) and then stimulated with 10 mg pilocarpine-HCl (kg body weight)−1 (i.p.). Whole saliva was collected, primarily representing a combination of parotid and submandibular gland secretions, with a very minor component from sublingual, minor salivary, nasal and tracheal glands. Saliva was collected from the lower cheek pouch by a suction device at intervals of 5, 10 and 15 min, and volumes are expressed in microlitres per 5 minutes. Time zero was designated as the point in time when saliva was first noted, typically about 1 min after pilocarpine injection (mice have little or no resting saliva flow). The protein concentration of saliva was estimated using the Bradford method (Pierce Chemical, Rockford, IL, USA). Collected saliva samples were analysed for total Na+ and K+ content by atomic absorption using a Perkin-Elmer 3030 spectrophotometer. Sample osmolality was measured using a Wescor 5500 vapour pressure osmometer, and Cl− activity was estimated using an Orion EA 940 expandable ion analyser.
Statistical analyses
Experiments were repeated using preparations from at least three separate animals in each group. Data were analysed by a two-tailed Student's t test, and differences between test and control values at P < 0.05 were considered to be statistically significant.
Results
Loss of ClC-3 expression in mouse parotid cells
The ClC-3 Cl− channel is highly expressed in many major organ systems, including brain, lung, spleen, adrenal glands and kidney (Kawasaki et al. 1994). To verify the loss of wild-type ClC-3 Cl− channel expression in salivary glands, Western blot analysis was performed. Targeted deletion of the Clcn3 gene results in the excision of exons 6 and 7, which contain the coding sequence for transmembrane domains 2-4, regions that are critical for channel function (Dickerson et al. 2002). Deletion of this fragment of Clcn3 in the Clcn3−/- mouse resulted in the absence of a protein band of the appropriate apparent molecular mass for ClC-3 (Fig. 1, upper panel). An additional weaker band that migrated at a higher apparent molecular mass than ClC3 also disappeared in the knockout mice, and may represent post-translational modifications to the protein. Bands of a lesser apparent molecular mass than ClC-3 did not disappear in the knockout animals, but vanished when the primary antibody was pre-absorbed with a threefold excess by weight of antigen (ClC-3 amino acids 592–661 + GST fusion protein provided by Alomone Laboratories), demonstrating that the remaining protein bands in knockout mice are the result of antibody cross-reactivity (see below).
Figure 1. ClC-3 protein and mRNA expression in mouse parotid acinar cells.
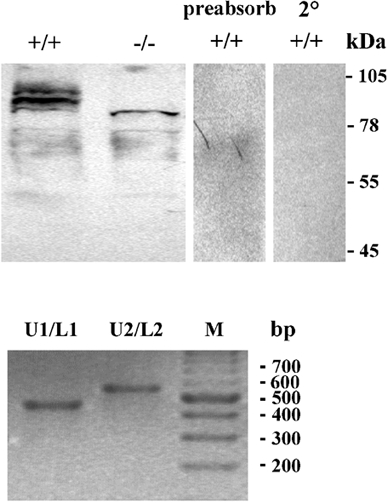
Protein was isolated from the parotid glands of ClC-3 wild-type and null mutant mice. Upper panel, an antibody to ClC-3 recognized several bands of the appropriate molecular mass for ClC-3 in protein samples from a wild-type mouse parotid gland (lane 1). In a protein sample from parotid glands of Clcn3−/-mice, a band of the correct molecular mass for ClC-3 protein was not observed (lane 2), although several other bands remained immunoreactive. These most likely represent cross-reactivity of the antibody with non-specific proteins. When probed with an anti-ClC-3 antibody that had been pre-absorbed with a threefold excess of the peptide antigen to which the antibody had been raised (lane 3) or with secondary antibody alone (lane 4), none of the immunoreactive bands in the wild-type protein sample were recognized. Molecular weight markers are shown to the right of the blots. Lower panel, four overlapping RT-PCR primers were designed to amplify the ClC-3 message from isolated parotid acinar cells including two sense primers (U1 and U2) complimentary to codons 34–40 and 384-391, respectively, and two nonsense primers corresponding to codons 209–214 and 590–597 (L1 and L2, respectively). The PCR product sizes using primer pairs U1/L1 and U2/L2 are 542 base pairs (bp) and 638 bp long, respectively. DNA sequencing confirmed 100 % identity of the PCR products as ClC-3. Lane M is a 100 bp DNA ladder size marker.
Immunohistochemistry was performed to localize ClC-3 in mouse parotid salivary glands. The upper left panel of Fig. 2 shows heavy staining of the muscular walls of blood vessels (arrows) and of duct cells, with less intense staining of acinar cells and the stroma in the parotid glands of wild-type mice. The lower left (immunohistochemistry) and lower right (Nomarski image of the section shown in the lower left panel) panels of Fig. 2 show a higher magnification view of a blood vessel, with arrows indicating the thick muscular wall of this vessel. The upper right panel of Fig. 2 illustrates that there was none of the usual intense staining associated with the outer blood vessel wall in Clcn3−/- mice, suggesting that ClC-3 is highly expressed in the smooth muscle layer of blood vessels, as suggested by a previous study (Lamb et al. 1999). In contrast, considerable non-specific labelling remained associated with duct and acinar cells, consistent with this antibody recognizing additional proteins besides ClC-3 (see also Fig. 1). Since it was not possible to localize the expression of ClC-3 to acinar cells with this antibody by immunohistochemical techniques, a fine glass pipette was used to isolate dispersed parotid acini, and RT-PCR was then performed to determine whether the ClC-3 message is present in these cells. The lower panel of Fig. 1 shows that amplification of RNA from isolated parotid acini results in PCR products of the expected size. Furthermore, DNA sequencing confirmed 100 % identity of the PCR products to mouse ClC-3.
Figure 2. Immunohistochemical labelling using a ClC-3 antibody in the parotid glands of Clcn3+/+and Clcn3−/-mice.
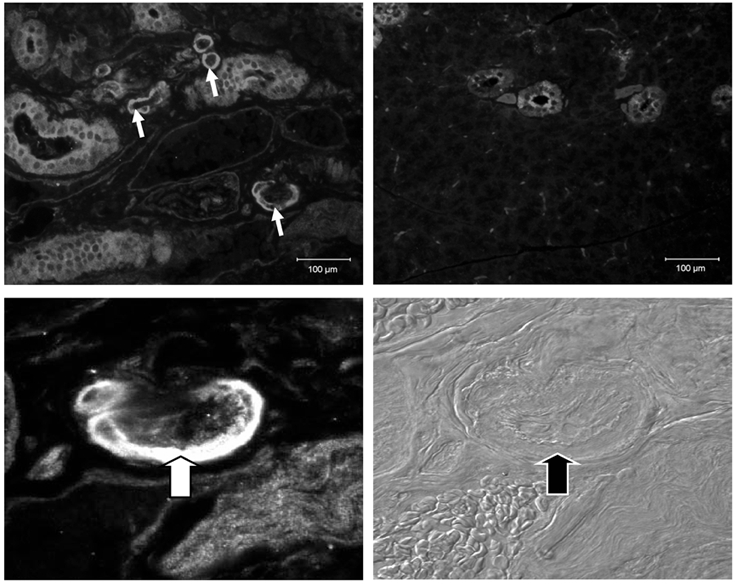
The parotid glands were removed from Clcn3+/+ and Clcn3−/- mice and fixed in paraformaldehyde overnight prior to imbedding in paraffin and sectioning at 5 μm. The glands were exposed to anti-ClC-3 antibody (1:250) overnight. Reactivity was then detected by the use of an Alexa-594 fluorescent secondary antibody. Images were taken at several magnifications from × 200 to × 600, as indicated below. Upper left panel, section from wild-type parotid gland. Arrows indicate intense staining of blood vessels (magnification, ×200). Upper right panel, section of parotid gland from null mutant mouse. Intense staining of blood vessels is absent, but non-specific staining of duct and acinar cells remains (magnification, ×200). Lower left panel, section from wild-type parotid gland. Arrows indicate intense staining of blood vessels (magnification, ×600). Lower right panel, Nomarski image of the section in the lower left panel (magnification, ×600).
Regulatory volume decrease (RVD) and swell-activated Cl− currents in parotid acinar cells from Clcn3+/+ and Clcn3−/- mice
The Cl− and K+ channels in salivary gland acinar cells are activated by secretogagues or when swollen by a hypotonic challenge. The molecular identity of the Cl− channel(s) activated under these conditions is unknown. Regardless of the channel(s) involved, in both instances the resulting KCl efflux is accompanied by osmotic water loss and cell shrinkage. The observed shrinkage during a hypotonic shock is termed regulatory volume decrease (RVD). Cell volume measurements demonstrated that acinar cells isolated from mice lacking ClC-3 undergo RVD in a similar fashion to cells from wild-type littermates (Fig. 3, upper panel). Initial rate calculations verified that there was no statistical difference between the RVD for acinar cells isolated from wild-type and knockout mice (lower panel of Fig. 3).
Figure 3. Targeted disruption of the Clcn3 gene fails to inhibit the RVD response in parotid acinar cells.

The role of ClC-3 in the regulatory volume decrease (RVD) response was examined in parotid acinar cells loaded with the fluoroprobe calcein, as described in Methods. Upper panel, parotid acini isolated from Clcn3+/+ (▪) and Clcn3−/- (▵) mice were superfused in an isosmotic solution and then hyposomotic cell swelling was induced by switching the perfusate to a hypotonic medium (30 % dilution with water). The cell volumes shown are normalized to the maximum volume achieved following exposure to a hypotonic solution. Changes in cell volume are represented as 1/normalized calcein fluorescence (1/calcein Fn). Lower panel, the initial rate of change expressed as 1/calcein Fn × min−1 × 10⁻² (Clcn3+/+, n = 8; Clcn3−/-, n = 11; no statistical differences between groups).
The above RVD experiments suggest that the ClC-3 channel is not the major swell-activated Cl− channel stimulated during RVD in salivary gland acinar cells. To verify that swell-activated Cl− currents are still present, the patch-clamp technique was used to examine Cl− currents in parotid acinar cells from Clcn3−/- mice. Whole-cell recordings revealed that exposure to a hypotonic solution activated large outwardly rectifying Cl− currents in acinar cells from Clcn3+/+ mice as well as those derived from Clcn3−/- mice (Fig. 4, upper and middle rows, respectively). The left traces were obtained in isotonic conditions, while the centre traces represent the current after exposure to a hypotonic solution for 2–4 min. The hypotonic solution increased the current relative to that seen in a hypertonic solution 8- to 10-fold in both wild-type and knockout mice. The swell-activated current density was not statistically different between groups (Clcn3+/+ = 29.2 ± 8.2 pA pF−1, n = 6; Clcn3−/- = 32.2 ± 3.9 pA pF−1, n = 7). The sensitivity of this current to cell swelling was confirmed when the hypotonic-activated currents disappeared following exposure to a hypertonic solution (right traces). The lower row of Fig. 4 shows the I-V relationship for the currents depicted in the upper (Clcn3+/+) and middle (Clcn3−/-) rows. The I-V relationship for cells isolated from wild-type and from null mutant mice have the characteristic outward rectification of the swell-activated Cl− currents seen in nearly all mammalian cells. Together, these data indicate that disruption of the Clcn3 channel gene had neither an effect on RVD nor on the swell-activated Cl− currents in mouse parotid acinar cells.
Figure 4. Swell-activated Cl− currents in parotid acinar cells from Clcn3+/+ and Clcn3−/- mice.
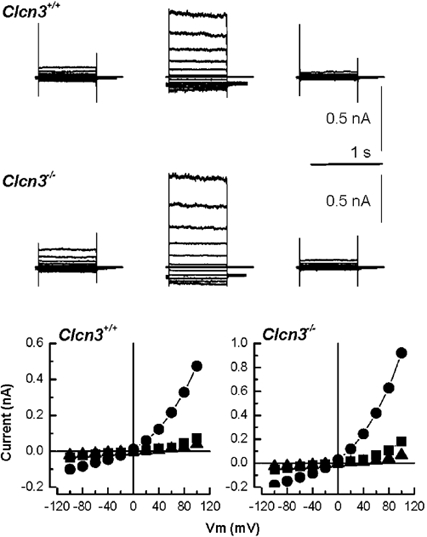
Volume-sensitive Cl− currents recorded from acinar cells isolated from Clcn3+/+ (upper row) and Clcn3−/- (middle row) mice. Control traces (left column) were recorded after 5 min of dialysis under isotonic conditions; hypotonic-activated currents (centre column) were recorded after 2–3 min in the hypotonic solution; inhibition of Cl− currents (right column) by cell shrinkage was assessed after 5 min exposure to a hypertonic solution. The lower row shows the current-voltage relationship for the data depicted in the upper and middle rows under isotonic (▪), hypotonic (•) and hypertonic (▴) conditions obtained from acinar cells isolated from Clcn3+/+ and Clcn3−/- mice. There was no statistical difference between the swell-activated current (current present in the hypotonic solution minus the current after switching to the hypertonic solution) from wild-type and null mutant mice (Clcn3+/+ = 29.2 ± 8.2 pA pF−1, n = 6; Clcn3−/- = 32.2 ± 3.9 pA pF−1, n = 7).
Ca2+-activated Cl− currents in parotid acinar cells from Clcn3+/+ and Clcn3−/- mice
Ca2+-dependent Cl− channels are thought to play a central role in the secretion of saliva (Arreola et al. 1996). Because an increase in the intracellular Ca2+ concentration occurs during a hypotonic shock (Mignen et al. 1999; Weskamp et al. 2000), these same Ca2+-dependent Cl− channels might contribute to the RVD response. Interestingly, the ClC-3 Cl− channel cloned from the human T84 cell line is apparently activated by CaM kinase II, a Ca2+- and calmodulin-dependent kinase (Huang et al. 2001). Even if ClC-3 is not a CaM kinase II-dependent channel in salivary gland acinar cells, deletion of the Clcn3−/- gene could result in compensatory changes in other Cl− channels, including those activated by intracellular Ca2+. Thus, we compared the level of expression of Ca2+-activated Cl− current in wild-type and Clcn3−/- mice.
The upper panel of Fig. 5 shows an example of anion currents recorded from a wild-type mouse. Illustrated are currents at several membrane potentials with a fixed intracellular Ca2+ concentration of about 400 nm (see Methods). The time course of current activation and deactivation are characteristic of Ca2+-activated Cl− channels in this cell type (Arreola et al. 1996). As an estimate of the level of expression of this channel, we determined the magnitude of the current at the end of the 3 s pulse to +90 mV corrected for cell size (cell capacitance). The average current from wild-type cells was 140 ± 20 pA pF−1 (s.e.m., n = 10). The lower panel of Fig. 5 shows that disruption of the Clcn3 gene did not eliminate expression of Ca2+-activated Cl− channels. Indeed, the average Ca2+-activated current at +90 mV in acinar cells from Clcn3−/- mice was not statistically different (135 ± 13 pA pF−1, n = 5). These results indicate that ClC-3 is not the Ca2+-activated Cl− channel in mouse parotid acinar cells. Furthermore, the RVD observed in parotid acinar cells from Clcn3−/- mice is not likely to be due to enhanced expression of Ca2+-dependent Cl− currents.
Figure 5. Ca2+-dependent Cl− currents in parotid acinar cells from Clcn3+/+and Clcn3−/-mice.

Upper panel, currents from a parotid acinar cell from a Clcn3+/+ mouse in response to 3 s voltages pulses from −30 to +90 mV in 20 mV increments from a holding potential of −50 mV. Lower panel, currents at the same potentials from a parotid acinar cell from a Clcn3−/- mouse. There was no statistical difference between the Ca2+-activated current from wild-type and null mutant mice (Clcn3+/+, 140 ± 20 pA pF−1; n = 10; Clcn3−/-, 135 ± 13 pA pF−1; n = 5).
In vivo stimulated salivary fluid, electrolyte and protein secretion in ClC-3 Cl− channel-deficient mice
The above data reveal that disruption of the Clcn3 gene alters neither Cl− current expression (swell-activated or Ca2+-dependent) nor the RVD response found in mouse parotid acinar cells. Thus, it is improbable that ClC-3 is involved directly in fluid secretion or cell volume regulation in parotid acinar cells. However, because ClC-3 may play an important role in vesicular transmitter uptake and/or secretion in the hippocampus (Stobrawa et al. 2001), it is important to test for any possible role in fluid or protein secretion. Specifically, ClC-3 appears to be highly expressed in the muscular walls of blood vessels (Fig. 2), suggesting that this channel, by controlling the flow of blood through salivary glands, could indirectly regulate the saliva flow rate. To test this hypothesis we collected in vivo stimulated whole saliva from Clcn3 wild-type and null mutant mice and determined the salivary flow rate (μl 5 min−1) over a 15 min time period. Figure 6 shows that targeted disruption of Clcn3−/- (□) did not significantly reduce the flow rate of pilocarpine-stimulated saliva secreted during the 15 min collection period compared with Clcn3+/+ animals (▪). As reported previously, there was a high initial flow rate seen at the commencement of secretion, which declined to a slower rate thereafter (Evans et al. 2000).
Figure 6. Targeted disruption of the Clcn3 gene does not inhibit pilocarpine-induced in vivo salivation.

The role of ClC-3 in the production of saliva was examined in vivo by stimulating with 10 mg pilocarpine-HCl (kg body weight (BW))−1. Whole saliva was collected from the lower cheek pouch by suctioning at intervals of 5, 10 and 15 min and amounts are expressed as μl 5 min g BW−1. Time zero was designated as the point when saliva was first noted following pilocarpine injection. Clcn3+/+ (▪), n = 17; Clcn3−/- (□), n = 12.
Salivation occurs in two stages, the initial step being the secretion of fluid with a plasma-like ionic composition from acinar cells. Subsequently, duct cells reabsorb much of the secreted NaCl to produce a hypotonic, NaCl-poor saliva. The transport pathways involved in NaCl reabsorption are not well understood, but may involve Cl− channels (Komwatana et al. 1994; Dinudom et al. 1995). To examine the role of ClC-3 channels in NaCl uptake, we determined the osmolality, the total Na+ and K+ content, and the Cl− activity of whole saliva. Table 1 shows that the ionic composition and the osmolality of saliva collected from ClC-3-deficient mice were not statistically different from that secreted by wild-type littermates, suggesting that Clcn3−/- channels do not play a significant part in NaCl reabsorption in this tissue.
Table 1.
Target disruption of the Clcn3 gene. Effects on the osmolality, [Na+], [Cl− and Protein content of stimulated whole saliva
| Clcn3+/+ | Clcn3−/− | |
|---|---|---|
| Osmolality(mmol kg −1) | 187.4 ± 8.0 | 171.0 ± 4.8 |
| [Na+] (mm) | 94.8 ± 11.8 | 89.9 ± 3.9 |
| [K+] (mm) | 37.7 ± 2.7 | 39.6 ± 2.4 |
| [Cl−] (mm) | 69.8 ± 7.1 | 54.8 ± 9.4 |
| Protein content (mg ml−1) | 74.5 ± 12.4 | 89.3 ± 17.2 |
Anesthetized adult Clcn3+/+ and Clcn3−/− mice were stimulated with 10 mg pilocarpine-HCl (kg body weight)−1. Whole saliva was collected and samples were analysed for total Na+ and K+ content by atomic absorption using a Perkin-Elmer 3030 spectrophotometer, for osmolality using a Wescor 5500 vapour pressure osmometer and for Cl- activity with an Orion EA 940 expandable ion analyzer. Protein concentration was estimated using the Bradford method (n =6 for each group; mean ± s.e.m.; no statistical difference between groups).
In addition to fluid and electrolytes, saliva is rich in secretory proteins. The movement of proteins into secretion granules and the stimulated discharge of these proteins are modulated by the pH of the various intracellular compartments in this pathway (Kleene et al. 1999; Williams & Webb, 2000; Wu et al. 2000). ClC-3 has been localized to endosomal compartments in the liver and synaptic vesicles of neurones, where it has been suggested to play a role in the pH regulation of these organelles (Stobrawa et al. 2001). Therefore, to examine whether ClC-3 regulates secretory protein discharge, we determined the protein concentration of the pilocarpine-stimulated saliva collected from Clcn3+/+ and Clcn3−/- mice. Table 1 shows that the protein content of the saliva was comparable between Clcn3 wild-type and null mutant mice. Taken together, our results demonstrate that disruption of the Clcn3 gene fails to alter the in vivo flow rate or composition of saliva.
Discussion
The ClC-3 Cl− channel is highly expressed in many different organ systems, including salivary glands. This channel has been hypothesized to be the swell-activated Cl− channel present in the heart and most other mammalian tissues (Duan et al. 1997). However, knockout of this gene fails to inhibit similar swell-activated Cl− currents in mouse hepatocytes or pancreatic acinar cells (Stobrawa et al. 2001). Instead, mice lacking ClC-3 undergo postnatal degeneration of the retina and hippocampus (Stobrawa et al. 2001; Dickerson et al. 2002) and exhibit kyphosis, altered vascular reactivity and unexplained postnatal death (Dickerson et al. 2001, 2002). It appears that ClC-3 is an intracellular channel protein that may play a role in pH regulation of intracellular organelles (Stobrawa et al. 2001). In general agreement with these studies (Stobrawa et al. 2001; Dickerson et al. 2002), we found that disruption of ClC-3 expression had no effect on the swell-activated Cl− currents in parotid acinar cells (neither the typical swell-activated currents nor the Ca2+-dependent Cl− currents) or the ability of these cells to volume regulate in response to a hypotonic challenge. Majid et al. (2001) reported that volume-sensitive channel activation is much faster in submandibular salivary acinar cells, which express ClC-3 channels, than in lacrimal acinar cells, which do not. Majid et al. saw little or no current induced by swelling during the first 5 min of a hypotonic challenge in lacrimal acinar cells, whereas this current was maximal by this time in salivary cells. If ClC-3 is the fast-activating current in salivary acinar cells, as hypothesized by Majid et al., then little or no swelling-induced current should have been observed shortly after cell swelling in the ClC-3 knockout mice. However, there did not appear to be a difference in the rates of channel activation in our experiments during the first 4 min of a hypotonic challenge, although no detailed kinetic analysis was done. Swelling-induced currents in parotid acinar cells from wild-type and Clcn3 null mutant mice were generally recorded 2–4 min after switching to a hypotonic solution, and were of similar magnitude. Moreover, because the kinetics and current magnitudes were comparable, these results also show that ClC-3 is not a regulator of the volume-sensitive channel, an alternative hypothesis proposed by Majid et al. to explain the different activation kinetics. Clearly, the molecular identity of the swell-activated Cl− current in parotid acinar cells as well as some other cell types (Stobrawa et al. 2001; Dickerson et al. 2002) is not ClC-3, nor is it likely to be another known member of the CLC gene family based on channel kinetics and intracellular localization patterns.
ClC-3 is one of nine members of the CLC mammalian Cl− channel gene family. Like ClC-3, the hyperpolarization-activated ClC-2 Cl− channel is widely expressed and may be regulated by cell volume (Jordt & Jentsch, 1997), although ClC-2 has very different channel kinetics from swell-activated currents (Strange et al. 1996). A null mutation of this gene results in the lack of inward rectifier Cl− current in parotid acinar cells, but has no effect on swell-activated currents or the ability of these cells to volume regulate (Nehrke et al. 2002). Targeting of some members of the CLC gene family to the plasma membrane appears to involve interactions with other proteins. Plasma membrane targeting of two kidney specific isoforms, ClC-Ka and ClC-Kb, apparently requires expression of a β-subunit termed Barttin (Estévez et al. 2001). Mutations in the human CLCNKB or Barttin genes cause Bartter's syndrome, a disease associated with severe renal wasting (Simon et al. 1997; Estévez et al. 2001). Thus, other chaperone proteins may determine the function of some CLC channels by regulating the ultimate destination of these proteins to either intracellular structures or the plasma membrane. Indeed, an alternatively spliced variant of ClC-3 expresses a PDZ binding that apparently interacts with a scaffolding protein to enhance expression at the plasma membrane (Ogura et al. 2002).
So if the ClC-3 Cl− channel does not play a major role in cell volume regulation, what then is its function in salivary glands? Expression in the smooth muscle cells of blood vessels in the parotid gland suggests that ClC-3 could be important for indirectly regulating saliva production. Indeed, altered vascular reactivity has been noted in the aorta of ClC-3-deficient mice (Dickerson et al. 2001). However, we found that in vivo stimulation with the cholinergic agonist pilocarpine failed to affect salivary gland flow rates. Moreover, our results revealed that a Clcn3 gene null mutation did not alter the osmolality or the ionic composition of the saliva produced, indicating that the ClC-3 Cl− channel is unlikely to be involved in NaCl reabsorption. Similarly, disruption of Clcn3 does not grossly alter renal function (L. W. Dickerson & F. S. Lamb, unpublished observations).
Our results show clearly that ClC-3 is neither the swell-activated Cl− channel nor the Ca2+-dependent Cl− channel in salivary acinar cells. Alternatively, ClC-3 might play an important role in the regulation of endocytic or secretory vesicle sorting, a pH-dependent process in some cells (Castle et al. 1987). Stobrawa et al. (2001) found that ClC-3 targets synaptic vesicles, where it may control the pH of this organelle and thereby have an effect on neurotransmitter uptake/release by these vesicles. Vesicle fusion events leading to protein movement often require an intraorganelle acidification via the action of the H+-ATPase. It appears that Cl− channels may be involved in pH regulation of some intracellular organelles by acting as an electrogenic shunt (Stobrawa et al. 2001). Nevertheless, the protein content of in vivo stimulated saliva from Clcn3+/+ and Clcn3−/- mice was comparable, indicating that ClC-3 channel activity is not essential for secretory protein discharge by salivary acinar cells. However, secretory granule fusion with the plasma membrane in this cell type may not be dependent upon acidification of the granules, where the intragranular pH is apparently neutral (Castle et al. 1987).
In summary, our results indicate that the ClC-3 Cl− channel is not a major regulator of the functions typically associated with salivary gland cells. Cell volume regulation, swell-activated Cl− currents, and Ca2+-dependent Cl− currents in salivary acinar cells were unaltered in Clcn3−/- mice, demonstrating clearly that the ClC-3 channel is not involved in the RVD response. Moreover, the in vivo volume, total protein content and ionic composition of saliva secreted in response to stimulation were unchanged, suggesting that ClC-3 does not play a major role in these processes. Further study is required to determine the function of this channel in salivary acinar cells.
Acknowledgments
We thank Jodi Pilato and Jill Thompson for technical assistance. This work was supported in part by National Institutes of Health Grants DE09692 and DE13539 (J.E.M).
* These authors contributed equally to this study.
References
- Arreola J, Melvin JE, Begenisich T. Activation of calcium-dependent chloride channels in rat parotid acinar cells. Journal of General Physiology. 1995;108:35–47. doi: 10.1085/jgp.108.1.35. [DOI] [PMC free article] [PubMed] [Google Scholar]
- Arreola J, Melvin JE, Begenisich T. Volume-activated chloride channels in rat parotid acinar cells. Journal of Physiology. 1996;484:677–687. doi: 10.1113/jphysiol.1995.sp020695. [DOI] [PMC free article] [PubMed] [Google Scholar]
- Begenisich T, Melvin JE. Regulation of chloride channels in secretory epithelia. Journal of Membrane Biology. 1998;163:77–85. doi: 10.1007/s002329900372. [DOI] [PubMed] [Google Scholar]
- Bers DM, Patton CW, Nuccitelli R. A practical guide to the preparation of Ca2+ buffers. Methods in Cell Biology. 1994;40:3–29. doi: 10.1016/s0091-679x(08)61108-5. [DOI] [PubMed] [Google Scholar]
- Castle JD, Cameron RS, Arvan P, Von Zastrow M, Rudnick G. Similarities and differences among neuroendocrine, exocrine, and endocytic vesicles. Annals of the New York Academy of Sciences. 1987;493:448–460. doi: 10.1111/j.1749-6632.1987.tb27230.x. [DOI] [PubMed] [Google Scholar]
- Dickerson LW, Barna TJ, Schutte BC, Cao XR, Yang B, Lamb FS. Decreased reactivity to norepinephrine (NE) in aortae from male ClC3 (−/−) mice. FASEB Journal. 2001;15:A114. [Google Scholar]
- Dickerson LW, Schutte BC, Yang B, Bonthius DJ, Barna TJ, Bailey MC, Nehrke K, Williamson RA, Lamb FS. Altered GABAergic function accompanies hippocampal degeneration in mice lacking ClC-3 voltage-gated chloride channels. Brain Research. 2002;956 doi: 10.1016/s0006-8993(02)03519-9. in the Press. [DOI] [PubMed] [Google Scholar]
- Duan D, Winter C, Cowley S, Hume JR, Horowitz B. Molecular identification of a volume-regulated chloride channel. Nature. 1997;390:417–421. doi: 10.1038/37151. [DOI] [PubMed] [Google Scholar]
- Duan D, Zhong J, Hermoso M, Satterwhite CM, Rossow CF, Hatton WJ, Yamboliev II, Horowitz B, Hume JR. Functional inhibition of native volume-sensitive outwardly rectifying anion channels in muscle cells and Xenopus oocytes by anti-ClC-3 antibody. Journal of Physiology. 2001;531:437–444. doi: 10.1111/j.1469-7793.2001.0437i.x. [DOI] [PMC free article] [PubMed] [Google Scholar]
- EstÉvez R, Boettger T, Stein V, Birkenhager R, Otto E, Hildebrandt F, Jentsch TJ. Barttin is a Cl− channel β-subunit crucial for renal Cl− reabsorption and inner ear K+ secretion. Nature. 2001;414:558–561. doi: 10.1038/35107099. [DOI] [PubMed] [Google Scholar]
- Evans RL, Park K, Turner RJ, Watson GE, Nguyen HV, Dennnett MR, Hand AR, Flagella M, Shull GE, Melvin JE. Severe impairment of salivation in Na+/K+/2Cl− cotransporter (NKCC1)-deficient mice. Journal of Biological Chemistry. 2000;275:26720–26726. doi: 10.1074/jbc.M003753200. [DOI] [PubMed] [Google Scholar]
- Friedrich T, Breiderhoff T, Jentsch TJ. Mutational analysis demonstrates that ClC-4 and ClC-5 directly mediate plasma membrane currents. Journal of Biological Chemistry. 1999;274:896–902. doi: 10.1074/jbc.274.2.896. [DOI] [PubMed] [Google Scholar]
- Huang P, Liu J, Di A, Robinson NC, Musch MW, Kaezel MA, Nelson DJ. Regulation of human ClC-3 channels by multifunctional Ca2+/calmodulin dependent protein kinase. Journal of Biological Chemistry. 2001;276:20093–20100. doi: 10.1074/jbc.M009376200. [DOI] [PubMed] [Google Scholar]
- Jordt SE, Jentsch TJ. Molecular dissection of gating in the ClC-2 chloride channel. EMBO Journal. 1997;16:1582–1592. doi: 10.1093/emboj/16.7.1582. [DOI] [PMC free article] [PubMed] [Google Scholar]
- Kawasaki M, Uchida S, Monkawa T, Miyawaki A, Mikoshiba K, Marumo F, Sasaki S. Cloning and expression of a protein kinase C-regulated chloride channel abundantly expressed in rat brain neuronal cells. Neuron. 1994;12:597–604. doi: 10.1016/0896-6273(94)90215-1. [DOI] [PubMed] [Google Scholar]
- Kleene R, Kastner B, Rosser R, Kern H. Complex formation among rat pancreatic secretory proteins under mild alkaline pH conditions. Digestion. 1999;60:305–313. doi: 10.1159/000007676. [DOI] [PubMed] [Google Scholar]
- Komwatana P, Dinudom A, Young JA, Cook DI. Characterization of the Cl− conductance in the granular duct cells of mouse mandibular glands. Pflügers Archiv. 1994;428:641–647. doi: 10.1007/BF00374588. [DOI] [PubMed] [Google Scholar]
- Lamb FS, Clayton GH, Liu BX, Smith RL, Barna TJ, Schutte BC. Expression of CLCN voltage-gated chloride channel genes in human blood vessels. Journal of Molecular and Cellular Cardiology. 1999;31:657–666. doi: 10.1006/jmcc.1998.0901. [DOI] [PubMed] [Google Scholar]
- Li X, Shimada K, Showalter LA, Weinman SA. Biophysical properties of ClC-3 differentiate it from swelling- activated chloride channels in Chinese hamster ovary-K1 cells. Journal of Biological Chemistry. 2000;275:35994–35998. doi: 10.1074/jbc.M002712200. [DOI] [PubMed] [Google Scholar]
- Majid A, Brown PD, Best L, Park K. Expression of volume-sensitive Cl− channels and ClC-3 in acinar cells isolated from the rat lacrimal gland and submandibular salivary gland. Journal of Physiology. 2001;534:409–421. doi: 10.1111/j.1469-7793.2001.00409.x. [DOI] [PMC free article] [PubMed] [Google Scholar]
- Melvin JE, Nehrke K, Park K, Richardson L, Yang B, Lamb F, Schutte BC. Normal RVD and salivation in parotid acini from ClC3-deficient mice. Journal of Dental Research. 2000;79:345a. [Google Scholar]
- Mignen O, Le Gall C, Harvey BJ, Thomas S. Volume regulation following hypotonic shock in isolated crypts of mouse distal colon. Journal of Physiology. 1999;515:501–510. doi: 10.1111/j.1469-7793.1999.501ac.x. [DOI] [PMC free article] [PubMed] [Google Scholar]
- Nehrke K, Arreola J, Nguyen H-V, Pilato J, Richardson L, Okunade G, Baggs R, Shull GE, Melvin JE. Loss of hyperpolarization-activated Cl− current in salivary acinar cells from Clcn2 knockout mice. Journal of Biological Chemistry. 2002;277:23604–23611. doi: 10.1074/jbc.M202900200. [DOI] [PubMed] [Google Scholar]
- Ogura T, Furukawa T, Toyozaki T, Yamada K, Zheng Y, Katayama Y, Nakaya H, Inagaki N. ClC-3B, a novel ClC-3 splicing variant that interacts with EBP50 and facilitates expression of CFTR-regulated ORCC. FASEB Journal. 2002;16:863–865. doi: 10.1096/fj.01-0845fje. [DOI] [PubMed] [Google Scholar]
- Park K, Olschowka JA, Richardson LA, Bookstein C, Chang EB, Melvin JE. Expression of multiple Na+/H+ exchanger isoforms in rat parotid acinar and ductal cells. American Journal of Physiology. 1999;276:G470–478. doi: 10.1152/ajpgi.1999.276.2.G470. [DOI] [PubMed] [Google Scholar]
- Schreiber R, Nitschke R, Greger R, Kunzelmann K. The cystic fibrosis transmembrane conductance regulator activates aquaporin 3 in airway epithelial cells. Journal of Biological Chemistry. 1999;274:11811–11816. doi: 10.1074/jbc.274.17.11811. [DOI] [PubMed] [Google Scholar]
- Shimada K, Li X, Xu G, Nowak DE, Showalter LA, Weinman SA. Expression and canalicular localization of two isoforms of the ClC-3 chloride channel from rat hepatocytes. American Journal of Physiology - Gastrointestinal Liver Physiology. 2000;279:G268–276. doi: 10.1152/ajpgi.2000.279.2.G268. [DOI] [PubMed] [Google Scholar]
- Simon DB, Bindra RS, Mansfield TA, Nelson-Williams C, Mendonca E, Stone R, Schurman S, Nayir A, Alpay H, Bakkaloglu A, Rodriguez-Soriano J, Morales JM, Sanjad SA, Taylor CM, Pilz D, Brem A, Trachtman H, Griswold W, Richard GA, John E, Lifton RP. Mutations in the chloride channel gene, CLCNKB, cause Bartter's syndrome type III. Nature Genetics. 1997;17:171–178. doi: 10.1038/ng1097-171. [DOI] [PubMed] [Google Scholar]
- Stegen C, Matskevich I, Wagner CA, Paulmichl M, Lang F, Broer S. Swelling-induced taurine release without chloride channel activity in Xenopus laevis oocytes expressing anion channels and transporters. Biochimica et Biophysica Acta. 2000;1467:91–100. doi: 10.1016/s0005-2736(00)00209-1. [DOI] [PubMed] [Google Scholar]
- Steinmeyer K, Schwappach B, Bens M, Vandewalle A, Jentsch TJ. Cloning and functional expression of rat CLC-5, a chloride channel related to kidney disease. Journal of Biological Chemistry. 1995;270:31172–31177. doi: 10.1074/jbc.270.52.31172. [DOI] [PubMed] [Google Scholar]
- Stobrawa SM, Breiderhoff T, Takamori S, Engel D, Schweizer M, Zdebik AA, Bosl MR, Ruether K, Jahn H, Draguhn A, Jahn R, Jentsch TJ. Disruption of ClC-3, a chloride channel expressed on synaptic vesicles, leads to a loss of the hippocampus. Neuron. 2001;29:185–196. doi: 10.1016/s0896-6273(01)00189-1. [DOI] [PubMed] [Google Scholar]
- Strange K, Emma F, Jackson PS. Cellular and molecular physiology of volume-sensitive anion channels. American Journal of Physiology. 1996;270:C711–730. doi: 10.1152/ajpcell.1996.270.3.C711. [DOI] [PubMed] [Google Scholar]
- Turner RJ, George J, Baum BJ. Evidence for a Na+/K+/Cl− cotransport system in basolateral membrane vesicles from rabbit parotid. Journal of Membrane Biology. 1986;94:143–152. doi: 10.1007/BF01871194. [DOI] [PubMed] [Google Scholar]
- Wang L, Chen L, Jacob TJ. The role of ClC-3 in volume-activated chloride currents and volume regulation in bovine epithelial cells demonstrated by antisense inhibition. Journal of Physiology. 2000;524:63–75. doi: 10.1111/j.1469-7793.2000.t01-1-00063.x. [DOI] [PMC free article] [PubMed] [Google Scholar]
- Weskamp M, Seidl W, Grissmer S. Characterization of the increase in [Ca(2+)](i) during hypotonic shock and the involvement of Ca(2+)-activated K(+). channels in the regulatory volume decrease in human osteoblast-like cells. Journal of Membrane Biology. 2000;178:11–20. doi: 10.1007/s002320010010. [DOI] [PubMed] [Google Scholar]
- Weylandt KH, Valverde MA, Nobles M, Raguz S, Amey JS, Diaz M, Nastrucci C, Higgins CF, Sardini A. Human ClC-3 is not the swelling-activated chloride channel involved in cell volume regulation. Journal of Biological Chemistry. 2001;276:17461–17467. doi: 10.1074/jbc.M011667200. [DOI] [PubMed] [Google Scholar]
- Williams RM, Webb WW. Single granule pH cycling in antigen-induced mast cell secretion. Journal of Cell Science. 2000;113:3839–3850. doi: 10.1242/jcs.113.21.3839. [DOI] [PubMed] [Google Scholar]
- Wu MM, Llopis J, Adams S, McCaffery JM, Kulomaa MS, Machen TE, Moore HP, Tsien RY. Organelle pH studies using targeted avidin and fluorescein-biotin. Chemistry and Biology. 2000;7:197–209. doi: 10.1016/s1074-5521(00)00088-0. [DOI] [PubMed] [Google Scholar]