
Fig.1.
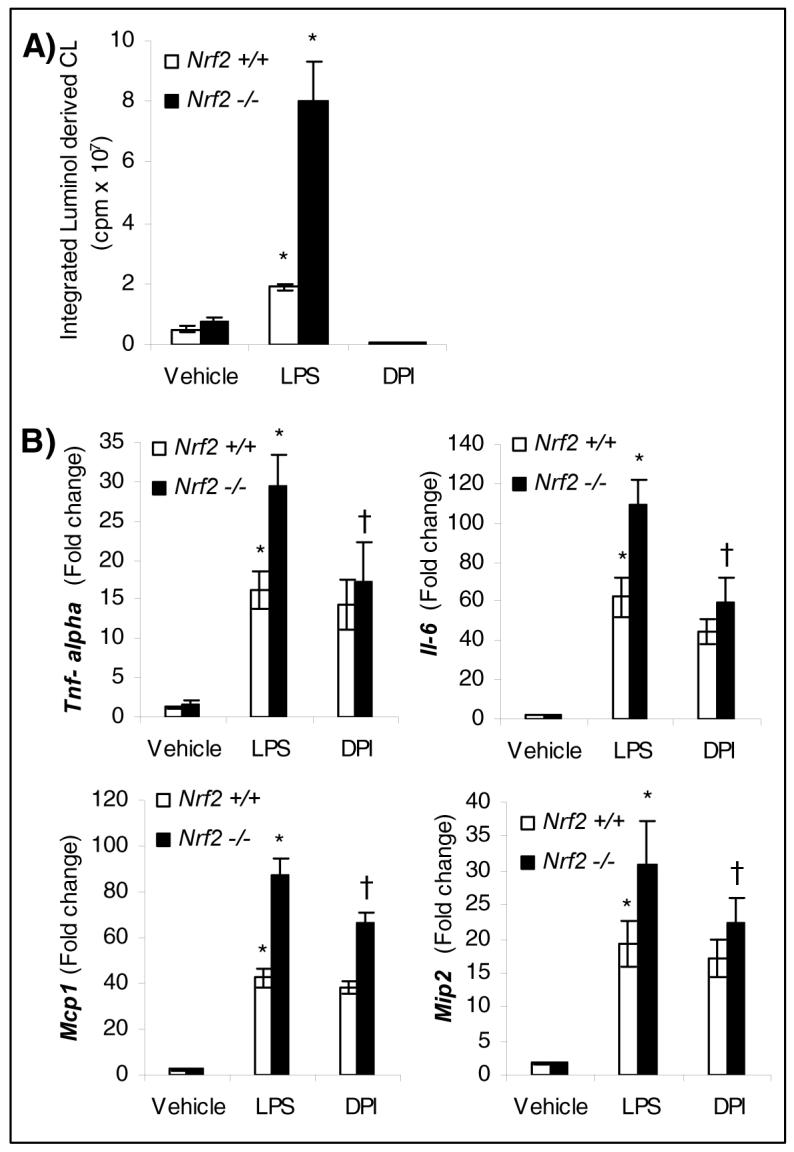
Elevated levels of ROS and proinflammatory cytokines and chemokines in nrf2-deficient neutrophils in response to LPS stimulus. A) ROS levels in nrf2 +/+ and nrf2 −/− neutrophils stimulated either with vehicle or LPS (100 ng/ml) for 1 h. Each bar is the mean ± SD (n=3) of values presenting the integration of the area under curve expressed in counts. The luminol-dependent chemiluminescence of untreated cells is at the level of the instrument background. B) mRNA expression by QPCR of cytokines (Tnf-α and Il-6) and chemokines (Mcp-1 and Mip2) in nrf2 +/+ and nrf2 −/− neutrophils 3 h after LPS stimulation (100 ng/ml). For inhibiting NADPH oxidase, cells were pretreated with DPI (10 μM) for 20 min, before stimulating with LPS. Data represented are mean fold change ± SD, n=3. * Differs from vehicle control of the same genotype; †differs from LPS treated of the same genotype.