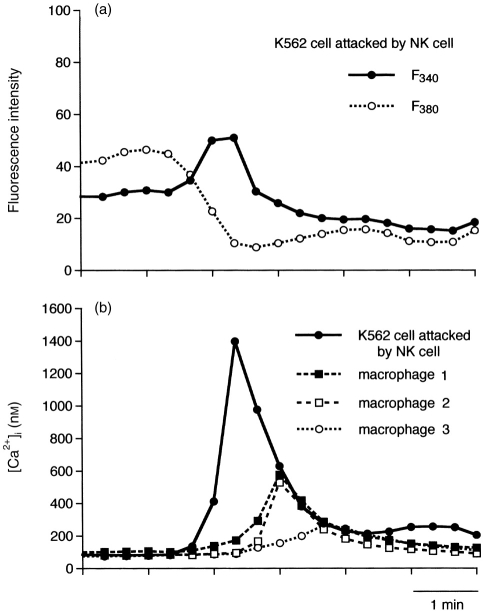
Figure 2.
(a) Changes in fluorescence intensity (F340 and F380) in the NK cell-attacked K562 cell indicated by the thick arrow in Fig. 1. (b) Changes in [Ca2+]i calculated from the ratio F340:F380 in the NK cell-attacked K562 cell and three macrophages indicated by arrows 1, 2 and 3 in Fig. 1(f). Fluorescence intensity was averaged over a cell.

