

Abstract
Oxytocin knockout (OT KO) mice display enhanced intake of nutritive and non-nutritive sweet solutions (i.e., sucrose and saccharin) compared to wild type (WT) mice of the same C57BL/6 background strain. The present study further investigated the differential behavioral response of OT KO and WT mice to sucrose solutions, and also examined intake preferences of OT KO and WT mice for palatable but non-sweet isocaloric solutions of carbohydrate and fat. A progressive ratio operant licking procedure demonstrated that OT KO and WT mice display a similar motivational drive to consume 10% sucrose. A series of two-bottle intake tests revealed that OT KO mice consume significantly larger amounts of both sweet and non-sweet carbohydrate solutions (i.e., sucrose, Polycose, and cornstarch) compared to WT cohorts. Lick pattern analyses revealed that OT KO mice overconsume carbohydrate solutions by initiating more drinking bouts compared to WT mice; bout sizes did not differ between the genotypes. In contrast, OT KO and WT mice did not differ in their intake of Intralipid, a palatable soybean oil emulsion. These findings indicate that the absence of OT in mice does not affect their appetitive drive to consume palatable sucrose solutions. Instead, the absence of OT may increase daily intake of palatable sweet and non-sweet solutions of carbohydrate (but not fat) by selectively blunting or masking processes that contribute to post-ingestive satiety.
Keywords: ingestive behavior, sucrose, Polycose, cornstarch, lipid, operant licking
INTRODUCTION
We previously reported that oxytocin (OT) signaling pathways modulate intake of sweet solutions in mice. Compared to wild type (WT) mice of the same C57BL/6 background strain, male and female OT gene knockout (OT KO) mice consume larger volumes of sucrose or saccharin solutions during initial and sustained exposure (3, 6). WT mice reach a plateau in daily sucrose or saccharin intake that is less than 50% of the daily intakes by OT KO mice (3, 6). Thus, the genetic absence of OT in male and female mice enhances their daily consumption of caloric and non-caloric sweet solutions. Despite their differential intake of sweet solutions, age- and sex-matched OT KO and WT mice have similar body weights, and display similar hourly and cumulative daily food (i.e., mouse chow) and water intake during basal conditions (12). OT KO and WT mice also display similar water intake after overnight water deprivation (2), and similar food intake after an overnight fast with water available ad libitum (12). Given the apparent lack of effect of OT gene deletion on chow or water intake under basal conditions or after overnight food deprivation, the sustained excessive intake of sweetened water by male and female OT KO mice is striking.
The first part of the present study was designed to further investigate the differential responses of OT KO and WT mice to sucrose solution. For this purpose, drinking patterns were measured to determine if OT KO mice overconsume 10% sucrose by taking larger and/or more frequent drinking bouts compared to WT mice. A progressive ratio operant licking procedure (16) was then used to evaluate the motivation of OT KO and WT mice to drink 10% sucrose when food and water are freely available.
The second part of this study was designed to compare the ingestive responses of OT KO and WT mice to other palatable but non-sweet solutions of carbohydrate or fat. For this purpose, mice were given a series of preference tests with sucrose, Polycose, cornstarch, and Intralipid (a soybean oil emulsion) in isocaloric concentrations. Rats and mice are attracted to solutions of Polycose (a starch hydrolysate) and to cornstarch suspensions, both of which appear to have tastes or flavors that are distinct from the sweet taste of sucrose (5, 14, 17). Mice and rats also readily consume non-sweet oil emulsions, including Intralipid (4, 8, 11, 15), which may be due to their oily texture (1, 13) and fatty acid taste (9, 10). If the absence of OT signaling pathways promotes increased intake of all palatable liquids, then OT KO mice should consume significantly greater amounts not only of sucrose, but also of Polycose, cornstarch, and Intralipid compared to WT mice. Alternatively, OT KO mice may demonstrate enhanced intake of only sweet-tasting solutions, or may generally overconsume solutions that contain carbohydrate regardless of their sweetness. The work described here was designed to investigate these possibilities.
MATERIALS AND METHODS
Animals
OT KO and WT mice of C57BL/6 background strain were bred and housed initially in a viral free facility at the University of Pittsburgh. Founder mice for the breeding colony were purchased from Jackson Laboratories and were derived from mice originally generated by Dr. Scott Young (20). Experiments were performed in 14 male mice (F10 generation; n=7 OT KO, n=7 WT) that were shipped from the University of Pittsburgh breeding colony to Brooklyn College. Mice were 14 weeks old at the start of experiments. Mice were singly housed (see “Apparatus”, below) with ad libitum access to chow (5001, PMI Nutrition International, Brentwood, MO) and deionized water in a room maintained at 22° C with a 12:12 h light-dark cycle. Experimental protocols were approved by the Institutional Animal Care and Use Committees of the University of Pittsburgh and Brooklyn College, and were performed in accordance with the NIH Guidelines for the Care and Use of Laboratory Animals.
Apparatus
Mice were individually housed and tested in clear plastic cages (10 × 23.5 × 27 cm) with a stainless-steel perforated floor. Fluid was available from two stainless steel sipper spouts through slots (5 × 20 mm, 32 mm apart) in a stainless steel plate at the front of the cages. The sipper spouts, which had a 1.5 mm opening designed for mice (Ancare, Bellmore, NY), were fixed in a nylon block that positioned them 1 mm outside the drinking slot. Licking behavior was recorded with electronic lickometers (ENV-252M, Med Associates, Georgia, VT) and a microcomputer stored the number of licks in 6-sec bins for off-line analysis of drinking patterns. Chow pellets were available ad libitum from a stainless steel wire mesh tube affixed to the back wall of the cage. To control for side preferences, the left-right position of test solution and water spouts were alternated daily. Each daily session was 23 h in length, or slightly shorter on days that cages were cleaned.
During “bottle” tests the sipper spouts were inserted in rubber stoppers attached to 50 ml plastic centrifuge tubes. During operant licking experiments, one sipper spout was connected via Tygon tubing (06419-14, Cole Parmer, Chicago, IL) to a 30 ml plastic syringe mounted in a syringe pump (A-99, Razel Scientific Instruments, Stamford, CT) set at a 0.5 ml/min pump speed. A 21 gauge stainless steel tube protruded from the end of the Tygon tubing that was inserted into the sipper spout so that the tip of the 21 gauge tube was flush with the hole of the sipper spout. As the mouse licked the sipper spout, the microcomputer counted all licks and every 3 sec activated the syringe pump if the accumulated licks equaled or exceeded the operant lick requirement. In this case, the pump remained on for 3 sec, delivering approximately 0.025 ml of solution to the tip of the drinking spout, and the lick “counter” was reduced by the operant lick requirement. Note that the licks emitted by the mouse to consume the sucrose reward counted toward their next reward.
Test Fluids and Intake Measures
All test fluids were prepared daily using deionized water. Sucrose (Domino Foods, Inc., Yonkers, NY) and Polycose (Ross Laboratories, Columbus, OH) solutions were prepared at a 10% concentration. A 10% cornstarch (ACH Food Co., Memphis, TN) suspension was prepared using 0.3% xanthan gum (Sigma Chemical Co., St. Louis, MO). These test fluids were prepared on a w/w basis because intakes were recorded by weight. A 4% Intralipid emulsion was prepared by diluting 20% Intralipid (Baxter, Deerfield, IL), which contains 20% soybean oil, 2.25% glycerol and 1.2% egg yolk phospholipids. Because 20% Intralipid is formulated on a w/v basis, the 4% concentrations was prepared w/v but intakes were measured by weight. The caloric density of the 4% Intralipid was equal to that of the 10% sucrose, Polycose and cornstarch solutions (i.e., 0.4 kcal/g).
In the bottle tests fluid intakes were measured to the nearest 0.1 g by weighing the drinking bottles on an electronic balance interfaced to a laptop computer; the weights were automatically entered into a spreadsheet. Spillage was estimated each day by recording the change in weight of four drinking tubes that were placed on two empty cages; two tubes contained that day’s test solution, the other two tubes contained water. The spillage from these tubes averaged 0.2-0.3 g/tube/day and intake measures were corrected by this amount. In the operant tests, sucrose intakes were measured to the nearest 0.5 ml by reading the syringe and were expressed in grams.
Experimental Procedures
Mice were adapted to the laboratory for one week and were then given a series of choice tests as outlined in Table 1. The mice were first given a two-bottle test with 10% sucrose vs. water for 4 consecutive days (Test A). Operant licking tests were then conducted (Test B). During the first 4 days of Test B, the 10% sucrose solution was available through the operant sipper spout on a fixed ratio 20 (FR20) schedule that pumped 0.025 ml of solution to the tip of the sipper spout for every 20 licks emitted. The FR20 schedule closely approximates the normal ratio of licks emitted:volume received when mice drink freely from such spouts (16). The 10% sucrose solution was then available on a progressive ratio 4-1 (PR4-1) schedule in which the lick requirement (i.e., the number of times the mouse had to lick to obtain a sucrose reinforcement) was increased by 1 (starting at 20 licks) after every 4 reinforcements. This was followed by PR2-1 and PR1-1 schedules which increased the lick requirement by 1 every 2 and 1 reinforcements, respectively. The highest lick ratio reached during a session is defined as the break point. The PR2-1 and PR1-1 schedules were in effect for 3 consecutive days; due to an error, the PR4-1 schedule was in effect for only 2 days. Data from the last 2 days of each FR and PR schedule were averaged and used for the statistical analysis. Water was freely available from a sipper spout attached to a bottle and chow was available ad libitum.
Table 1.
Solutions used in test series A to C
| Series | Solution | Test Type and Duration |
|---|---|---|
| A | 10% Sucrose vs. water | Bottle, 4 days |
| B | 10% Sucrose (operant lick tube) vs. water (bottle) | FR-20 schedule, 4 days PR1-4, -2, -1 schedules, 2-3 days each |
| C | 10% Sucrose vs. water 10% Polycose vs. water 10% Cornstarch vs. water 4% Intralipid vs. water |
Bottle, 2 days Bottle, 2 days Bottle, 2 days Bottle, 4 days |
2-3 days of water (1-bottle) preceded each bottle test in Test series C.
After completing the operant licking procedure (Test B), mice were given one-bottle access to water for 2 days. They were then given a series of two-bottle choice tests (Test C) with water vs. 10% sucrose, 10% Polycose, 10% cornstarch, or 4% Intralipid, in that order, with each two-bottle test separated by 2 days of one-bottle water access. Except for Intralipid, each solution was presented for 2 consecutive days. The Intralipid test was extended to 4 days because many mice (i.e., 6 OT KO and 4 WT) emptied their Intralipid bottle on the first test day. More Intralipid was provided on days 2 - 4 to remove any artificial ceiling on intake. Data analysis was based on Intralipid intake averaged over all 4 days. Similar results were obtained if the analysis was based on Intralipid intake on days 2-4 only.
Statistical Analyses
Daily fluid intakes were expressed as g intake per mouse per day. Between-strain differences were assessed using repeated measures analysis of variance. Solution preferences were also expressed as percent intakes (solution intake/total intake × 100). Significant interaction effects were evaluated using simple main effects tests or Newman-Keuls test according to Winer (19). The significance of the solution preference for each nutrient was evaluated for each strain by comparing solution intake vs. water intake using paired t-tests. To control for the multiple comparisons, the α level (0.05 prior to correction) for the t-tests was corrected with the Bonferroni procedure. Drinking patterns were analyzed with a drinking bout defined as a period of drinking containing at least 30 licks and with interlick intervals no longer than 5 min (7). Mean daily bout size and number were evaluated using repeated measures analysis of variance.
RESULTS
The baseline water intakes of OT KO and WT mice prior to each test series were similar and averaged 4.9 and 4.7 g/day, respectively. OT KO mice weighed slightly less than WT mice (averaging 26.2 g vs. 28.7 g, respectively) over the course of these experiments, but this difference was not statistically significant.
Test A: Sucrose Two-Bottle Test
OT KO mice consumed significantly more sucrose overall than did the WT mice [F(1,12) = 30.462, P < 0.001]. Both groups increased their sucrose intake from the first 2-day period to the second 2-day period [F(1,12) = 19.744, P < 0.001; Figure 1]. Although both groups consumed substantially more sucrose than water in each 2-day period, OT KO mice displayed a significantly greater sucrose preference than WT mice [99% vs. 90%, F(1,12) = 5.53, P < 0.01; Figure 1]. Water intake was quite low in both groups during the sucrose preference tests, but was slightly higher in WT mice than in OT KO mice [0.5 vs. 0.2 g/day, F(1,12) = 6.406, P < 0.05].
Figure 1.
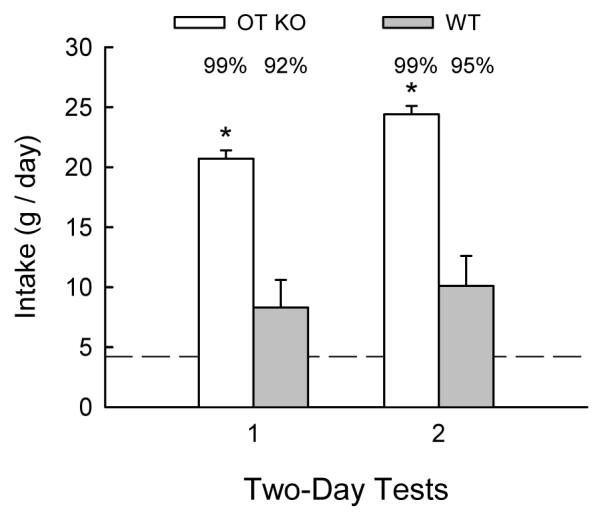
Mean (+SEM) daily 10% sucrose intakes of OT KO and WT mice during the first and second 2-day blocks of sucrose vs. water preference tests (Test A). Water intakes during the sucrose preference tests were negligible and are not presented. The daily one-bottle water intakes prior to the two-bottle sucrose preference tests were similar in OT KO and WT mice; average one-bottle water intake is indicated by the horizontal line. OT KO mice consumed significantly more 10% sucrose during each 2-day test compared to WT mice (* P < 0.05). Average preference scores for sucrose over water within each group are indicated above each bar.
Analysis of drinking bouts during the 2-day water baseline period prior to the sucrose test revealed similar mean water bout sizes and numbers in OT KO and WT mice (Figure 2). Mean sucrose bout size during sucrose access was significantly larger than bout size during the water-only baseline period [F(1,12) = 181.681, P < 0.001] (Figure 2). OT KO mice increased their sucrose bout size over water bout size to a somewhat greater extent than did WT mice [Group × Test, F(1,12) = 6.264, P < 0.05]; however, sucrose bout sizes did not differ significantly between OT KO and WT mice. In contrast, the number of sucrose bouts initiated was significantly higher in OT KO mice than in WT mice, and only OT KO mice increased their sucrose bout number above their baseline water bout number [F(1,12) = 14.674, P < 0.01] (Figure 2).
Figure 2.

Mean (+SEM) daily intakes and bout patterns of OT KO and WT mice drinking water during the one-bottle baseline period prior to sucrose intake tests, and drinking sucrose during the two-bottle 10% sucrose preference test (Test A). Sucrose intake data from the second 2-day block of Test A are presented. Compared to WT mice, OT KO mice consumed significantly more 10% sucrose (* P < 0.05) by drinking more frequently (* P < 0.05). Average bout sizes did not differ between genotypes.
Test B: Sucrose Operant Licking
Figure 3 summarizes the results of the sucrose operant licking tests. Overall, OT KO mice consumed more sucrose than WT mice [F(1,11) = 7.816, P < 0.05], similar to results obtained in Test A. Sucrose intake in both genotypes decreased as the operant schedule became more demanding [F(3,33) = 63.929, P < 0.001]. There was a Group × Test interaction, however, such that sucrose intakes of OT KO and WT mice differed only on the FR schedule [F(3,33) = 6.037, P < 0.01]. A similar pattern of results was obtained in an analysis of the number of sucrose reinforcements earned. Overall, sucrose reinforcements declined as the PR tests became more demanding [F(3,33) = 64.872, P < 0.001], and OT KO mice obtained more sucrose reinforcements than WT mice only during the FR test [Group × Test, F(3,33) = 4.297, P < 0.05] (Figure 3). The groups did not differ in their water intakes, which increased from 0.4 to 2.6 g/day as sucrose intakes decreased over the course of the operant tests [F(3,33) = 11.893, P < 0.001; water intake data not shown].
Figure 3.

Mean (±SEM) intakes, number of reinforcements, total licks, and lick break points of OT KO and WT mice in FR and PR tests with 10% sucrose (Test B). Data from the last two days on each operant schedule are presented. Compared to WT mice, OT KO mice consumed significantly more sucrose (* P < 0.05) and obtained significantly more sucrose reinforcements on the FR20 schedule (* P < 0.05). The apparent trends towards higher total licks/day and higher break point in OT KO mice compared to WT mice consuming sucrose on the FR and PR schedules were not significant.
OT KO mice emitted more total licks for sucrose compared to WT mice (Figure 3), but there was considerable variability in this measure and the group difference was not significant. Total licks/day increased and then decreased across the successive operant schedules [F(3,33) = 3.565, P < 0.05]. Lick break points tended to be higher in the OT KO mice than in the WT mice (Figure 3), but this difference also was not significant. Break points increased in both groups as the PR schedule became more demanding [F(3,33) = 4.792, P < 0.05].
Test C: Nutrient Preference Tests
Results from the two-bottle nutrient vs. water tests are summarized in Figure 4. Analysis of these data revealed that, overall, the OT KO mice consumed more nutrient than the WT mice [F(1,12) = 19.820, P < 0.001]. However, intakes varied as a function of nutrient type [F(3,36) = 31.277, P < 0.001], and there was a significant Group × Nutrient interaction [F(3,36) = 5.508, P < 0.01]. Post-hoc tests revealed significant effects of genotype on sucrose, Polycose and cornstarch intake (P < 0.05 for each nutrient), whereas Intralipid intakes in OT KO and WT mice were not significantly different (P = 0.062). Within-group analyses indicated that OT KO mice consumed more Intralipid compared to each of the three carbohydrate solutions (P < 0.05 for each comparison), and consumed more sucrose and Polycose than cornstarch [F(3,18) = 34.377, P < 0.001]. The WT mice also consumed more Intralipid than each of the three carbohydrate solutions (P < 0.05 for each comparison), but WT mice consumed similar amounts of sucrose, Polycose and cornstarch [F(3,18) = 14.449, P < 0.001]. Water intakes of the OT KO and WT mice were negligible during these tests (0.2 - 0.3 g/day). The groups did not differ in their preferences for sucrose, cornstarch or Intralipid (98-99%), but the OT KO mice displayed a stronger preference (P < 0.05) for Polycose than did the WT mice [99% vs. 92%; Group × Nutrient, F(3,36) = 3.084, P < 0.05; Figure 4].
Figure 4.

Mean (+SEM) daily intakes and bout patterns of OT KO and WT mice during two-bottle tests with isocaloric solutions of 10% sucrose, 10% Polycose, 10% cornstarch, and 4% Intralipid vs. water (Test C). Water intakes during the tests were negligible and are not presented. Average preference scores for nutrient over water within each group are indicated above each bar. One-bottle water intakes preceding each nutrient test (indicated by the horizontal line) were similar for the two groups. Compared to WT mice, OT KO mice consumed significantly more sucrose, Polycose, and cornstarch (* P < 0.05). The OT KO and WT mice did not significantly differ in their Intralipid intakes. Mean bout size was significantly larger with Intralipid than with sucrose, Polycose, and cornstarch (+ P < 0.05). Overall, bout number was greater in the OT KO mice than in the WT mice (— P < 0.01).
The drinking pattern analysis indicated that, overall, the OT KO mice initiated bouts more frequently than the WT mice during nutrient tests [F(3,36) = 11.609, P < 0.01; Figure 4]. The magnitude of genotype difference in bout number was smallest with Intralipid, but the Group × Nutrient interaction was not significant. OT KO and WT mice did not differ in their mean bout sizes during the sucrose, Polycose, cornstarch and Intralipid tests. Bout sizes were similar with the three carbohydrate solutions, but increased in both genotypes when Intralipid was available [F(3,36) = 25.252, P < 0.01; Figure 4].
DISCUSSION
Previous work by Amico and coworkers (3, 6) demonstrated that OT KO mice consume significantly greater daily amounts of 10% sucrose or 0.2% saccharin solutions compared to WT cohorts when these solutions are available ad libitum. The present results (Tests A and C) replicate, in a different experimental setting, the finding that OT KO mice overconsume 10% sucrose solution compared to WT cohorts of the same background strain. New results further reveal that the increased sucrose intake manifested by OT KO mice is the result of an increased frequency of sucrose bouts (i.e., increased sucrose “meal number”). Conversely, sucrose bout sizes were similar in WT and OT KO mice. This finding suggests that OT KO mice experience less post-ingestive satiety than WT mice following sucrose intake. Because sucrose bout sizes were similar between genotypes, within-meal satiation during sucrose intake does not appear to be affected by OT gene deletion.
Results from the operant lick tests (Test B) argue against the view that sucrose is significantly more rewarding to OT KO mice compared to WT mice. Total daily sucrose intake and the number of sucrose reinforcements received by OT KO and WT mice differed only on the FR20 schedule, which mimics the free access condition in Test A. As the operant task became more demanding, OT KO mice seemed unwilling to work any harder (i.e., lick any more) than WT mice in order to obtain sucrose reinforcements and the genotypes did not significantly differ in total licks and breakpoints on the various PR schedules. Prior work demonstrates that the effort required by the PR licking schedules does not preclude the appearance of genotype differences. In particular, 129P3/J mice lick significantly more than do C57BL/6J mice for 16% sucrose on the PR schedules used in the present study (16).
The findings obtained with the different nutrients in Test C revealed that, compared to WT mice, OT KO mice overconsume both sweet and non-sweet palatable carbohydrates. Furthermore the drinking patterns obtained when mice consumed Polycose and cornstarch were similar to those obtained when mice consumed sucrose: compared to the WT mice, the OT KO mice overconsume the various carbohydrates by increasing bout frequency but not bout size. In contrast, the OT KO and WT mice did not differ significantly in their daily intake of a palatable lipid emulsion (Intralipid) and they displayed minimal genotypic differences in their Intralipid drinking patterns.
The present data suggest that the absence of OT signaling may specifically affect intake of carbohydrate solutions, regardless of whether or not they are sweet. Conversely, intake of lipid solution appears to be under the control of neural systems that do not depend on OT signaling. Conceivably, the failure to observe a genotype effect on Intralipid intake in this study may have occurred because prior repeated testing of the mice with palatable solutions enhanced the drinking response of the WT mice to “ceiling levels” similar to those exhibited by OT KO mice. However, in subsequent tests not reported here, the same WT mice later consumed significantly less of 8% and 16% sucrose solutions than did the OT KO mice, demonstrating that the genotype difference in sugar intake remained intact. Ongoing experiments in OT KO and WT mice that are naive to carbohydrate solutions also have failed to reveal any effect of genotype on daily intake of Intralipid presented at concentrations higher and lower than the 4% concentration used in the present study (Miedlar, Vollmer, Rinaman, and Amico; unpublished). Together these findings indicate that daily Intralipid intakes do not differ between OT KO and WT mice.
It is interesting that, compared to WT cohorts, OT KO mice also overconsume 0.2% saccharin solution (6). Saccharin solutions are sweet and highly palatable to mice, but provide no calories and have no effect on blood glucose or insulin levels. It is possible that all sweet-tasting solutions are categorized centrally as “carbohydrate” regardless of their caloric content, and that the intake of nonnutritive sweet solutions is partially regulated via neural mechanisms with features common to those that regulate the intake of nutritive carbohydrates. However, the mice used in the saccharin study had prior exposure to sucrose solutions, and so the enhanced saccharin intake manifested by the OT KO mice in that study (6) may have been due to a nutrient-conditioned preference (18). Additional studies investigating the intake of saccharin and other sweet nonnutritive solutions by naïve OT KO and WT mice are needed.
Our cumulative findings indicate that the absence of OT does not affect processes related to the appetitive drive to consume 10% sucrose solution, but may selectively alter processes related to post-ingestive satiety. We hypothesize that post-ingestive satiety processes after carbohydrate intake involve neural systems that recruit hypothalamic OT neurons, and that the absence of OT in OT KO mice thereby blunts or masks carbohydrate-specific satiety. The validity of this hypothesis can be tested using other experimental approaches, such as sham feeding or intragastric infusions of various carbohydrate, lipid, and protein solutions.
Acknowledgments
This research was supported by National Institutes of Health grants HD 44898 (JAA) and DK 31135 (AS). The authors thank Karen Ackroff for her helpful comments on this paper and Martin Zartarian for his expert technical assistance.
REFERENCES
- 1.Ackroff K, Vigorito M, Sclafani A. Fat appetite in rats: The response of infant and adult rats to nutritive and nonnutritive oil emulsions. Appetite. 1990;15:171–188. doi: 10.1016/0195-6663(90)90018-4. [DOI] [PubMed] [Google Scholar]
- 2.Amico JA, Morris M, Vollmer RR. Mice deficient in oxytocin manifest increased saline consumption following overnight fluid deprivation. Am J Physiol Regulatory Integrative Comp Physiol. 2001;281:R1368–R1373. doi: 10.1152/ajpregu.2001.281.5.R1368. [DOI] [PubMed] [Google Scholar]
- 3.Amico JA, Vollmer RR, Cai HM, Miedlar JA, Rinaman L. Enhanced initial and sustained intake of sucrose solution in mice with an oxytocin gene deletion. American Journal of Physiology Regulatory Integrative Comparative Physiology. 2005;289:R1798–R1806. doi: 10.1152/ajpregu.00558.2005. [DOI] [PubMed] [Google Scholar]
- 4.Bachmanov AA, Reed DR, Tordoff MG, Price RA, Beauchamp GK. Nutrient preference and diet-induced adiposity in C57BL/6ByJ and 129P3/J mice. Physiology and Behavior. 2001;72:603–613. doi: 10.1016/s0031-9384(01)00412-7. [DOI] [PMC free article] [PubMed] [Google Scholar]
- 5.Bachmanov AA, Tordoff MG, Beauchamp GK. Sweetener preference of C57BL/6ByJ and 129P3/J mice. Chemical Senses. 2001;26:905–913. doi: 10.1093/chemse/26.7.905. [DOI] [PMC free article] [PubMed] [Google Scholar]
- 6.Billings LB, Spero JA, Vollmer RR, Amico JA. Oxytocin null mice ingest enhanced amounts of sweet solutions during light and dark cycles and during repeated shaker stress. Behavioural Brain Research. 2006;171:134–141. doi: 10.1016/j.bbr.2006.03.028. [DOI] [PubMed] [Google Scholar]
- 7.Gannon KS, Smith JC, Henderson R, Hendrick P. A system for studying the microstructure of ingestive behavior in mice. Physiology and Behavior. 1992;51:515–521. doi: 10.1016/0031-9384(92)90173-y. [DOI] [PubMed] [Google Scholar]
- 8.Hartfield AW, Moore NA, Clifton PG. Serotonergic and histaminergic mechanisms involved in intralipid drinking? Pharmacology Biochemistry and Behavior. 2003;76:251–258. doi: 10.1016/s0091-3057(03)00221-1. [DOI] [PubMed] [Google Scholar]
- 9.Kawai T, Fushiki T. Importance of lipolysis in oral cavity for orosensory detection of fat. American Journal of Physiology Regulatory Integrative Comparative Physiology. 2003;285:R447–R454. doi: 10.1152/ajpregu.00729.2002. [DOI] [PubMed] [Google Scholar]
- 10.Laugerette F, Passilly-Degrace P, Patris B, Niot I, Febbraio M, Montmayeur JP, Besnard P. CD36 involvement in orosensory detection of dietary lipids, spontaneous fat preference, and digestive secretions. Journal of Clinical Investigation. 2005;115:3177–3184. doi: 10.1172/JCI25299. [DOI] [PMC free article] [PubMed] [Google Scholar]
- 11.Lewis SR, Dym C, Chai C, Singh A, Kest B, Bodnar RJ. Genetic variance contributes to ingestive processes: A survey of eleven inbred mouse strains for fat (Intralipid) intake. Physiology and Behavior. 2006 doi: 10.1016/j.physbeh.2006.08.028. in press. [DOI] [PubMed] [Google Scholar]
- 12.Mantella RC, Rinaman L, Vollmer RR, Amico JA. Cholecystokinin and D-fenfluramine inhibit food intake in oxytocin-deficient mice. American Journal of Physiology Regulatory Integrative and Comparative Physiology. 2003;285:R1037–R1045. doi: 10.1152/ajpregu.00383.2002. [DOI] [PubMed] [Google Scholar]
- 13.Mindell S, Smith GP, Greenberg D. Corn oil and mineral oil stimulate sham feeding in rats. Physiology and Behavior. 1990;48:283–287. doi: 10.1016/0031-9384(90)90314-t. [DOI] [PubMed] [Google Scholar]
- 14.Ramirez I. Does starch taste like Polycose? Physiology and Behavior. 1991;50:389–392. doi: 10.1016/0031-9384(91)90083-z. [DOI] [PubMed] [Google Scholar]
- 15.Sclafani A. Fat and sugar flavor preference and acceptance C57BL/6J and 129 mice: experience attenuates strain differences. Physiology and Behavior. 2006 doi: 10.1016/j.physbeh.2006.11.012. submitted. [DOI] [PubMed] [Google Scholar]
- 16.Sclafani A. Sucrose motivation in sweet “sensitive” (C57BL/6J) and “subsensitive” (129P3/J) mice measured by progressive ratio licking. Physiology & Behavior. 2006;87:734–744. doi: 10.1016/j.physbeh.2006.01.017. [DOI] [PubMed] [Google Scholar]
- 17.Sclafani A. The sixth taste. Appetite. 2004;43:1–3. doi: 10.1016/j.appet.2004.03.007. [DOI] [PubMed] [Google Scholar]
- 18.Sclafani A, Glendinning JI. Sugar and fat conditioned flavor preferences in C57BL/6J and 129 mice: oral and postoral interactions. American Journal of Physiology Regulatory Integrative and Comparative Physiology. 2005;289:R712–R720. doi: 10.1152/ajpregu.00176.2005. [DOI] [PubMed] [Google Scholar]
- 19.Winer BJ. Statistical Principles in Experimental Design. McGraw Hill; New York: 1962. [Google Scholar]
- 20.Young WS, Shepard E, Amico J, Hennighausen L, Wagner KU, LaMarca ME, McKinney C, Ginns EI. Deficiency in mouse oxytocin prevents milk ejection, but not fertility or parturition. Journal of Neuroendocrinology. 1996;8:847–853. doi: 10.1046/j.1365-2826.1996.05266.x. [DOI] [PubMed] [Google Scholar]