

Abstract
Posterior parietal cortex (PPC) is thought to play a critical role in decision making, sensory attention, motor intention, and/or working memory. Research on the PPC in non-human primates has focused on the lateral intraparietal area (LIP) in the intraparietal sulcus (IPS). Neurons in LIP respond after the onset of visual targets, just before saccades to those targets, and during the delay period in between. To study the function of posterior parietal cortex in humans, it will be crucial to have a routine and reliable method for localizing specific parietal areas in individual subjects. Here, we show that human PPC contains at least two topographically organized regions, which are candidates for the human homologue of LIP. We mapped the topographic organization of human PPC for delayed (memory guided) saccades using fMRI. Subjects were instructed to fixate centrally while a peripheral target was briefly presented. After a further 3-s delay, subjects made a saccade to the remembered target location followed by a saccade back to fixation and a 1-s inter-trial interval. Targets appeared at successive locations “around the clock” (same eccentricity, ≈30° angular steps), to produce a traveling wave of activity in areas that are topographically organized. PPC exhibited topographic organization for delayed saccades. We defined two areas in each hemisphere that contained topographic maps of the contralateral visual field. These two areas were immediately rostral to V7 as defined by standard retinotopic mapping. The two areas were separated from each other and from V7 by reversals in visual field orientation. However, we leave open the possibility that these two areas will be further subdivided in future studies. Our results demonstrate that topographic maps tile the cortex continuously from V1 well into PPC.
INTRODUCTION
Early studies of posterior parietal cortex (PPC) described attention-related (Robinson et al. 1978) and movement-related (Mountcastle et al. 1975) responses for this region of the brain. More recently, a role in decision making has been proposed (Glimcher 2003). These opposing views continue to be debated today. For an overview, see, e.g., Colby and Goldberg (1999), Goldberg et al. (2002), Kusunoki et al. (2000), Andersen and Buneo (2002), Snyder (2000) and also Dorris and Glimcher (2004), Platt and Glimcher (1999), Roitman and Shadlen (2002), Shadlen and Newsome (1996). There is evidence that PPC neurons respond after the onset of a sensory stimulus, encode the attention that is paid to the stimulus, sustain the memory of the stimulus, compute the sensorimotor transformation involved in making a movement to the stimulus, encode the intention to make such a movement, and compute the decision concerning which of two or more movements to make. Clearly, these observations underline that it is difficult to neatly categorize these neurons as purely “sensory” or “motor” (Platt and Glimcher 1999). There are a number of separate and distinct cortical areas in the PPC, and it has been hypothesized that these areas have distinct functional specializations with regard to decision, attention, intention, and/or memory (e.g., Andersen and Buneo 2002). Much of the single-unit electro-physiology research on these topics has focused on the lateral intraparietal area (LIP), a small region in the macaque intraparietal sulcus (IPS), that is tied to the production of eye movements. The study of LIP in macaques has hence become a microcosm of the research on the cortical control of attention, intention, working memory, and decision-making. This in turn has led to increasing interest in the comparative study of LIP (and PPC in general) in humans and non-human primates.
Some areas of PPC have been defined with precision in the monkey brain (Andersen et al. 1990a; Colby and Duhamel 1991; Lewis and Van Essen 2000), but less so in the human brain. Topographic mapping with functional magnetic resonance imaging (fMRI) has been a particularly useful technique for defining human cortical areas objectively, precisely, and routinely. This technique, introduced originally by Engel et al. (1994), has successfully been used to measure the retinotopic organization of early visual cortex and to define a number of visual cortical areas (DeYoe et al. 1996; Engel et al. 1994, 1997; Press et al. 2001; Sereno et al. 1995). Using a variant of this method, Sereno et al. (2001) identified an area near the human IPS that they suggest might be the human homologue of macaque LIP. In their experiment, subjects made saccades to a series of targets located in sequence around the visual field. The targets were presented only briefly, and subjects had to remember their locations for several seconds before each eye movement. Sereno et al. observed a traveling wave of activity across a region of human PPC as subjects remembered consecutive target locations, implying that some neurons in this area are topographically organized for delayed saccades to remembered locations. Other experiments have provided complementary evidence for potential homologies between areas of human PPC and monkey LIP. There are numerous reports of sustained activity in human PPC during a delay period before subjects make saccades (e.g., Astafiev et al. 2003; Connolly et al. 2002; Curtis and D’Esposito 2002). It has even been argued that human PPC exhibits spatial updating after eye movements (Merriam et al. 2003), a phenomenon analogous to one that has been reported in monkey LIP (Duhamel et al. 1992). It is, however, unclear if these human regions are the same as that identified by Sereno et al. based on topography.
Here, we used the methodology introduced by Sereno et al. to measure the response to delayed saccades in human PPC. In contrast to their report of one region, we found that there are at least two candidate areas in the IPS that exhibit topographic maps. These regions covered the medial aspect of the IPS. We refer to them as IPS1 and IPS2 based on their anatomical location. They were anterior to visual areas V3A and V7 at the transverse occipital sulcus, but posterior to the area reported previously by Sereno et al. (2001). The boundaries between V7 and IPS1 and between IPS1 and IPS2 were defined by reversals in the visual field orientation (i.e., phase reversals in the topographic map). We show in a companion paper that the same areas exhibited topographic organization when subjects performed a visual detection task in which the focus of attention systematically traversed the visual field, in the absence of eye movements (M. Silver, D. B. Ress, and D. J. Heeger 2005). It is important to note that the definitions of these two regions in the IPS are tentative. We leave open the possibility that these areas may be further subdivided in future experiments. Additional experiments will also be needed to determine the functional homology between these areas in human PPC defined by topographic mapping and areas in the macaque brain. A preliminary report of these results has been presented in abstract form (Schluppeck et al. 2004).
METHODS
Subjects
Four experienced subjects participated in this study with written consent. Procedures were in compliance with the safety guidelines for MR research and approved by the human subjects Institutional Review Board at New York University. Each subject participated in a number of scanning sessions: one session to obtain a high-resolution anatomical volume; two sessions to measure the retinotopic maps in visual cortex (see following text) and two to three sessions to measure fMRI responses in the experimental conditions.
Visual stimuli and task
Stimuli were presented via an LCD projector and long-throw optics onto a back-projection screen in the bore of the MR scanner. Subjects were supine and viewed the projected stimuli (maximum eccentricity: 11°) through an angled mirror. Subjects performed a delayed saccade task in which targets appeared at successive locations around the clock at the same eccentricity, separated by 30° angular steps (see Fig. 1) (see also Sereno et al. 2001). On each trial, a small random angular offset was added to the target locations (range, ±5°). Each cycle lasted 54 s (number of target locations × trial duration = 12 × 4.5 s). Subjects performed the task for five cycles, resulting in scans lasting 270 s. We alternated scans in which the target progressed in clockwise and counterclockwise directions (Fig. 1) and allowed subjects to rest for several seconds between scans. Each subject took part in two to three scanning sessions, each lasting ~1.5 h. In total, each subject performed between 720 and 1,440 saccades to remembered locations.
FIG. 1.

Stimulus and behavioral task. A: subjects were instructed to fixate centrally while a peripheral target was briefly presented. B: during a 3-s delay period, an annulus of distractor dots was presented at the same eccentricity as the target (10°, dot size: 0.25°, lifetime: 0.05 s). C: on dimming of the fixation spot, subjects made a saccadic eye movement to the remembered target location. On brightening of the central fixation spot 0.25 s later, subjects made a return saccade. The next trial began after a 1-s interval. Targets appeared at successive locations “around the clock” (same eccentricity, 30° angular steps), to produce a traveling wave of activity in areas that are topographically organized.
In each scanning session, we also included one or two scans (same duration, 270 s), in which subjects alternated between blocks of central fixation (27 s) and blocks consisting of a rapid series (1 every 750 ms) of eye movements (27 s). During the eye-movement block, subjects shifted their gaze between the central fixation spot and a series of peripheral targets. The presentation of the peripheral targets (750 ms, 10° eccentricity, random angles) alternated with the central fixation spot (750 ms), only one of which was visible at any time.
Functional imaging
We used functional magnetic resonance imaging at 3T (Allegra, Siemens, Erlangen) to measure blood-oxygen-level-dependent changes in cortical activity (BOLD). During each fMRI scan, a time series of volumes were acquired using a T2*-sensitive EPI pulse sequence (TR: 1,500 ms, TE: 30 ms, flip angle: 75°, 24 slices, 3 × 3 × 3 mm3voxels, FOV: 192 mm). We acquired images using custom RF coils (NM-011 transmit head-coil and NMSC-021 4-channel phased array receive coil, NOVA Medical, Wakefield, MA).
Preprocessing and motion correction
To minimize head motion, subjects were stabilized by use of a bite bar and/or foam padding. Post hoc image registration was used to correct for residual motion in the functional data (MCFLIRT) (Jenkinson et al. 2002). Data from the first 14 s of each fMRI scan were discarded to minimize transient effects of magnetic saturation. Further preprocessing of the fMRI data were as follows: high-pass filtering of the time series at each voxel to compensate for the slow drift typical in fMRI measurements (Smith et al. 1999) and dividing each voxel’s time series by its mean intensity to convert the data from arbitrary image intensity units to percent signal modulation (and to compensate for the decrease in mean image intensity with distance from the receive coil). The resulting time series were either analyzed for each voxel or averaged over a region of cortical gray matter corresponding to a given region of interest (ROI).
Topography for delayed saccades
In the saccade experiment the main difference across trials was the target location. Subjects made sequential delayed eye movements to different locations in the visual field (Fig. 1). If a topographic map exists, adjacent parts of the cortical gray matter should represent adjacent parts of the visual field, and successive delayed eye-movements to targets “around the clock” will therefore lead to a traveling wave of activity across the cortical surface.
Data were analyzed by fitting a sinusoid (same 54-s period as that of the stimulus/cue cycle) to the time series at each voxel and computing: the correlation (technically, coherence) between the time series and the corresponding best-fitting sinusoid and the phase of the best-fitting sinusoid. The coherence measures signal-to-noise (Engel et al. 1994, 1997), taking a value near 1 when the fMRI signal modulation at the stimulus/cue period is large relative to the noise (at the other frequency components) and a value near 0 when there is no signal modulation or when the signal is small compared with noise. The phase measures the temporal delay of the fMRI signal relative to the beginning of the experimental cycle and consequently corresponds to the polar angle component of the topographic map. A topographic map should be visible on the cortical surface as a smooth progression of early to late “phase values,” corresponding to different target locations in the visual field.
We combined data from “clockwise” and “counter-clockwise” scans by time shifting the time series at each voxel to remove the hemodynamic delay (Δt = 4.5 s). We then time-reversed the counterclockwise scans and averaged across the time-shifted and time-reversed scans, separately for each subject, across scanning sessions. The resulting mean time series therefore reflected the timing of clockwise scans, in which targets progressed through the right hemifield in the first part of each cycle and through the left hemifield field in the second half of the cycle.
Regions of posterior parietal cortex that were topographically organized for delayed saccades were visualized on flattened representations of each subject’s posterior parietal cortex (see following text). Candidate cortical areas were defined when they were observed to be consistent across hemispheres/subjects. Consistency was determined using the following criteria: the location of each area with respect to the gross anatomy, the size of each area, the distances between the areas and their placement relative to one another, and the visual field orientations (see following text) within the areas. Each candidate cortical area was defined by hand on the flat map. We defined each area conservatively by locating two features: the representation of the vertical meridia (at reversals in the phase map; see Visual field orientation), which indicated the borders between areas, and the medial and lateral borders of the maps. These borders were defined by including regions on the map that showed a significant response (coherence, c > 0.2) in the topography experiment. We also verified the definition of areas by comparing them to the region on the maps that showed significant response (c > 0.3) in the saccade-versus-fixation control condition (see Fig. 8). Because subjects performed the saccade tasks only at one eccentricity, the regions we defined likely represent only a portion of the true extent of these topographic maps.
FIG. 8.

fMRI responses to eye movements vs. fixation. Right hemisphere flat map of subject S1. The 3 regions of interest defined in the topography experiment are outlined in white. The colored overlay shows regions that responded more (coherence, c > 0.3, P < 2.14 × 10⁻⁵) during a period of rapid eye movements than fixation in an average of 2 270-s scans (see METHODS). The color corresponds to response phase (red, orange: in phase with the period of eye movements). Scale bar, 1 cm.
Statistics
The statistical significance of the coherence values c can be determined with a t-test (H0: c = 0, number of trials − 2 = 178 df) (Sokal and Rohlf 1995). The probability of observing a coherence value of 0.2 under the null hypothesis (c = 0), is P < 0.0035, t = 2.72. For c = 0.35, P < 7.31 × 10⁻⁷ and for c = 0.75, the highest coherence thresholds used, P = 0 (within numerical precision in Matlab). To calculate these P values, we assumed that consecutive time points were independent. This assumption is known to be false because there is considerably more noise in fMRI time series at low frequencies (≤0.25 Hz) than at higher frequencies (Aguirre et al. 1997; Biswal et al. 1995, 1997a,b; Purdon and Weisskoff 1998; Smith et al. 1999; Woolrich et al. 2001; Zarahn et al. 1997). Hence the P values should be taken only as a rule of thumb. There is a one-to-one correspondence between coherence and P values, but precise calculation of the P values would require further assumptions about the properties of the noise in the measurements. The c- (or corresponding P) values were used only for the purpose of thresholding the data to visualize the phase maps. Because of the arbitrariness of these statistical thresholds, we performed additional analyses to quantify the lateralization and visual field orientations in the identified areas of PPC.
Visual field orientation
To characterize the reversals in the topographic maps, we computed the visual field orientation for each cortical area. There are two diagnostic features of topographic maps for defining cortical areas. 1) The response phases progress across each visual area (indicating a topographic organization of the visual field on the cortical surface). 2) The adjacent maps are mirror images of each other so the phase progressions are in opposite directions along the cortical surface, resulting in a phase reversal at their shared boundary. The local visual field orientation at each voxel was determined by comparing its response phase to the phases of each of its eight neighboring voxels on the flat map. In particular, the local horizontal component of visual field orientation was determined by computing the difference between the sine of the response phase of the central voxel and the sine of the phase of each of its neighboring voxels and computing the difference between the resulting values from the three voxels on the right minus the values from the three voxels on the left. The local vertical component of the visual field orientation was determined analogously. The visual field orientation of an entire cortical area was computed as the vector average of the local orientations at each voxel (as in Figs. 4 and 5, arrows).
FIG. 4.
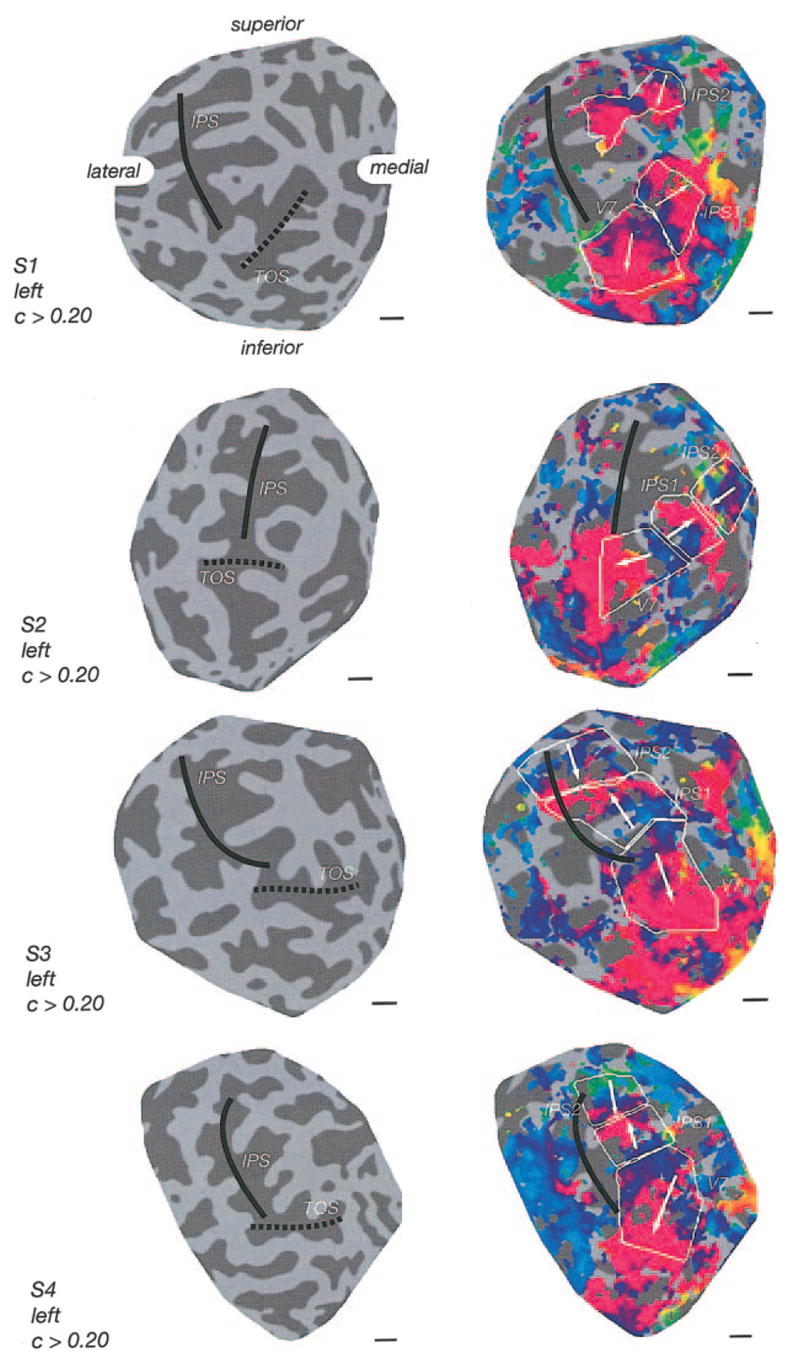
Topography for delayed saccades (left hemispheres). First column, underlying anatomy. The IPS lies in the center for the flat maps (see annotations). The TOS is marked by the dashed line. Second column, fMRI response phases with identified topographic regions indicated. Color map, correspondence between the color coded fMRI response phase and target position in the visual field. UVM: upper vertical meridian, LVM: lower vertical meridian. Scale bars: 1 cm. Each row shows data for 1 of the 4 subjects.
FIG. 5.

Topography for delayed saccades (right hemispheres). Same format as Fig. 4.
Retinotopy
Retinotopic visual areas (V1, V2, V3, V3A, V3B, hV4, V7) were defined using standard methods (DeYoe et al. 1996; Engel et al. 1994, 1997; Sereno et al. 1995). Briefly, to estimate the angular component of the retinotopic maps, we used a 45° wedge of flickering checkerboard that rotated slowly (f = 1/24s) about a central fixation point. Analogously, to estimate the radial component of the retinotopic maps, we used an expanding annulus (f = 1/24s, 25% duty cycle). These stimuli evoked traveling waves of activity across each of the retinotopic areas. As for the delayed-saccade data, we fit the measured time series with a sinusoid and calculated the response phase and coherence separately for each voxel. The phase values measured temporal delay of the fMRI responses relative to the beginning of the experimental cycle and, therefore corresponded to the polar (or radial) component of the topographic map.
Anatomical imaging, registration, and flat maps
A high-resolution anatomical volume was acquired of each subject’s brain using a T1-weighted, 3D-MPRAGE pulse sequence (1 × 1 × 1 mm3 voxels). These anatomical volumes were used to register the functional data across scanning sessions, restrict the functional data analysis to gray matter voxels, and computationally flatten the gray matter to create flattened visualizations of the cortical activity. Gray and white matter were segmented, and flat maps were computed using custom software (Fig. 2) (Larsson 2001). A surface corresponding to the gray-white matter boundary was extracted and computationally inflated. In a further step, selected regions containing the transverse occipital (TOS) and intraparietal (IPS) sulci were selected and then computationally flattened (Larsson 2001; Smith 2002). Flat maps were rendered such that areas that were concave on the original surface (buried in sulci) are dark gray, and areas that were convex (top of gyri) are light gray.
FIG. 2.

Gray matter segmentation and flat maps of posterior parietal cortex. A: Tesselated surface representation of the gray/white matter boundary in lateral and posterior aspect (1 subject, 1 hemisphere). B: inflated surface representation of the same hemisphere. Dark gray areas, sulci in the uninflated surface; light gray areas, gyri. The selected region shows the part of the patch of cortical surface that was computationally flattened and used for visualization. We used corresponding regions in all other subjects to create flat maps. C: flattened representation of the selected region of posterior parietal cortex (scale bar: 1 cm).
Each session began by acquiring a set of anatomical images in the same slices as the functional images (T1-weighted, MPRAGE pulse sequence). An image registration algorithm (Nestares and Heeger 2000) was used to align these inplane anatomical images to the high-resolution anatomical volume of the observers brain (see preceding text), so that the data from a given subject were co-registered across scanning sessions.
We determined the mean Talairach coordinates of the topographic regions by mapping each subject’s high-resolution anatomy volume into Talairach space using an affine transformation. The transform was based on definitions of the standard landmarks: anterior (AC) and posterior commissures (PC), points intersecting the anterior and posterior cortical surface on the AC-PC line, a point on the mid-sagittal plane, and points intersecting the cortical surface left and right of the anterior commissure (Dougherty et al. 2003; Talairach and Tournoux 1988). Table 1 shows mean ± SD of Talairach x, y, and z coordinates across eight hemispheres. The Euclidean (root mean square distance) between the coordinates reported here and by Sereno et al. was calculated. As their coordinates referred only to a region in the right hemisphere, we disregarded the sign of the Talairach x coordinate for this comparison.
TABLE 1.
Talairach coordinates of parietal regions
| Coordinates, mm
|
||||
|---|---|---|---|---|
| Region of Interest | x | y | z | Orientation |
| V7 | ± 25(5) | −80(5) | 27(8) | down |
| IPS1 | ± 21(4) | −76(5) | 42(8) | up |
| IPS2 | ± 18(6) | −71(6) | 52(6) | down |
Parietal regions V7 and intraparietal solcus regions 1 and 2 (IPS1 and IPS2) are shown. x, y, and z coordinates are the mean across 8 hemispheres [disregarding the sign for x coordinates reported by Sereno et al.: (24, −65, 53)]. Orientation indicates the mapping of the visual field representation from caudal to rostral on the cortical surface: up for a progression from lower to upper vertical meridia, down for vice-versa (cf. white arrows in Figs. 4 and 5; see METHODS for details).
We calculated cortical surface areas of the topographic maps that we found in human PPC. To avoid distortions introduced by the flattening procedure, surface areas were measured in the three-dimensional cortical manifold (the boundary between gray and white matter) using custom software (Dougherty et al. 2003).
RESULTS
The responses in the flat maps (Figs. 3–5) should be read as follows. Each panel displays a flat map of one hemisphere. The superimposed colors represent the fMRI response phases that correspond to angular position in the visual field. The relationship between the phase values and the corresponding portions of the visual field is indicated by the color wheel (inset). The colors corresponding to upper vertical meridian (UVM, orange) and lower vertical meridian (LVM, blue) of the visual field provide a reference point for comparing maps in the left and right hemispheres. The arrows represent the visual field orientations, computed from the response phases, and indicate the progression in topography from the lower vertical to the horizontal and then to the upper vertical meridian as one moves across the cortical surface.
FIG. 3.

Topography for delayed saccades (right hemisphere of subject S1). A: fMRI time courses in two small ROIs, averaged across repeated scans and cycles. Shading, SE across 10 cycles. Arrows indicate approximate phase shift (see marked locations on color wheel in F). B: fMRI response phases superimposed on a flat map of PPC, for regions with strong (coherence c > 0.2, P < 0.0035) responses at the periodicity of cued locations. Identified topographic regions are outlined in white. C: response phase as a function of distance in the flat map, for the region of interest outlined on the flat map in red. Points, phase values at individual pixels. Red curve, average phase value as a function of position. Dotted lines, correspondence between “phase reversals” in the flat map and phase reversals in the graph. D: rendering of the right hemisphere gray/white matter boundary in the same subject. Red patch, region corresponding to the flat maps in B and E. The locations of the intraparietal sulcus (IPS) and transverse occipital sulcus (TOS) are marked. E: flat map of the underlying anatomy for direct comparison to B. Scale bar, 1 cm. F: color map, correspondence between the color coded fMRI response phase and target position in the visual field. UVM: upper vertical meridian, LVM: lower vertical meridian. Numbers correspond to phase values in C.
There were three notable properties of the responses in PPC (Figs. 3–5). First, there was a bias in the distribution of response phases for the contralateral visual field (Figs. 3–5), as one set of colors (red, magenta, purple) appeared in the left hemispheres, whereas a different set of colors (yellow, green cyan) appeared in the right hemispheres. This contralateral bias was evident along the TOS, spanning the medial aspect of the IPS, and continued anterior and rostral along the IPS. Second, there was a smooth progression of phase values across the TOS and medial aspect of the IPS (Figs. 3–5), implying traveling waves of activity across this region of cortex with the periodicity of the clockwise advancing targets. Because there was a clockwise change of target positions, the phase change corresponded to a progression from upper to lower vertical meridian. Third, there were phase reversals (reversals in the visual field orientation), indicated by the arrows pointing in opposite directions.
Based on the phase reversals, we inferred that there were at least two topographically organized regions in PPC beyond V7 (Figs. 3–5). It is known that such phase reversals, in early visual cortex, correspond to boundaries between cortical areas. We therefore inferred that that the locations of these phase reversals corresponded to boundaries between adjacent topographically-organized cortical areas. To define these regions of interest in each hemisphere, we first located the phase reversal corresponding to the UVM representation at V7. We then looked for the first phase reversal corresponding to the LVM. The cortical area between these two meridian representations corresponded to V7. From this LVM representation, we then searched for areas corresponding to the next UVM and further to the next LVM. The two intervening cortical areas were tentatively labeled IPS1 and IPS2, reflecting their anatomical location, to avoid implying any particular functional homology with areas of macaque PPC.
Although it was not always clear precisely where to draw the boundaries between areas, there was no doubt that both IPS1 and IPS2 were identifiable in all four subjects (all 8 hemispheres). The phase reversals were evident in each hemisphere. The visual field orientations (i.e., whether the arrows point up or down) were comparable in all eight hemispheres. The locations of the areas with respect to the gross anatomy were similar in each hemisphere. Each subject participated in two or more scanning sessions on different days, and the results across scanning sessions were comparable. It is important to note, however, that our measurements were conducted at one eccentricity only (~10°); our definition of these regions is therefore likely a conservative estimate and the true extent of the regions in the medial-lateral direction may actually be larger.
The mean location of the areas across subjects in Talairach coordinates is shown in Table 1. Just as there were obvious individual differences in the gross anatomy of the brain, there were also clear differences in the precise locations, sizes, and shapes of the proposed cortical areas. Specifically, the size of IPS1 varied by a factor of ~2.6 across our subjects, and the size of IPS2 varied by a factor of ~2.4 (Table 2). This variability is comparable to previously reported intersubject variability in the sizes of early visual cortical areas. Specifically, V1–V3 have been reported to vary in size by about a factor of 2.5 across subjects (Andrews et al. 1997; Dougherty et al. 2003; Duncan and Boynton 2003; Ejima et al. 2003).
TABLE 2.
Cortical surface area measurements of parietal regions V7, IPS1, and IPS2
| Region of Interest | Surface Area, mm2 |
|---|---|
| V7 | 1225 ± 435 |
| IPS1 | 925 ± 235 |
| IPS2 | 902 ± 276 |
To avoid distortions introduced by the flattening procedure, cortical area sizes were measured in the three-dimensional cortical manifold (the boundary between gray and white matter) using custom software (Dougherty et al. 2003). Values are means ± SD.
The observed topography for delayed saccades extended anterior and rostral from the early visual areas (V1, V2, V3, V3A, V3B, V7). We localized the visual cortical areas by standard retinotopic mapping in each subject. Although the exact layout of areas V3A and V3B is controversial, there is general agreement that the location of the ventral/posterior boundary of V7 corresponds to a representation of the UVM(Wandell et al. 2004). In every hemisphere, the ventral/posterior boundary of V7 as defined by conventional retinotopic mapping coincided precisely with that determined from our delayed-saccade experiments. Area V7 is the most rostral/anterior visual area that has been reported consistently from retinotopic mapping experiments. Wandell et al. (2004) have, however, reported hints of topographic maps extending into the intraparietal sulcus, using standard retinotopic mapping techniques. These topographic maps appear to be more easily visualized with the delayed-saccade mapping protocol used here, although we did not perform a direct comparison (with the same cycle times, equal numbers of repeated scans, etc.) between the two protocols.
The response phases are shown on the flat maps (Figs. 3–5) for all gray matter patches that exceeded a statistical threshold, and hence, there are regions that appear noisy. The noisy patches outside the marked regions may correspond to additional topographic regions or they might just be noise. There are also some “dropouts” (uncolored patches) within the indicated cortical areas, where the responses fell below the statistical threshold. Even so, these dropout regions may correspond to topographically organized regions of cortex that happened to fall below the statistical threshold (for any of a number of reasons). We chose a statistical threshold of c > 0.2 because it resulted in the most easily interpretable maps across subjects. Because of the arbitrariness of the statistical thresholds, and to complement the qualitative interpretation of the phase reversals in the flat maps, we performed additional analyses to quantify the lateralization and visual field orientations in the proposed areas.
To further illustrate the contralateral bias in the responses, we plotted response coherence as a function of response phase, for each voxel in V7, IPS1, and IPS2 (Fig. 6). Unlike the phase maps in Figs. 3–5, this analysis included all voxels in each of the ROIs that responded (coherence threshold, c > 0.3, P < 2.14 × 10⁻⁵) during a separate localizer scan in which subjects alternated between making a series of saccades and holding fixation (Fig. 8). Voxels the activity of which was highly correlated with the periodic experimental design exhibited fMRI responses with large coherence values. The left and right hemisphere ROIs each covered a complementary range of response phases (π radians). fMRI response phases in the left hemisphere took on values between 0 and π radians, indicating that they were more active during the first half of each cycle of the clockwise progression of targets starting at the upper vertical meridian. Conversely, the right hemisphere ROIs exhibited response phases between π and 2π radians, indicating that they were more active during the second half of the cycle.
FIG. 6.
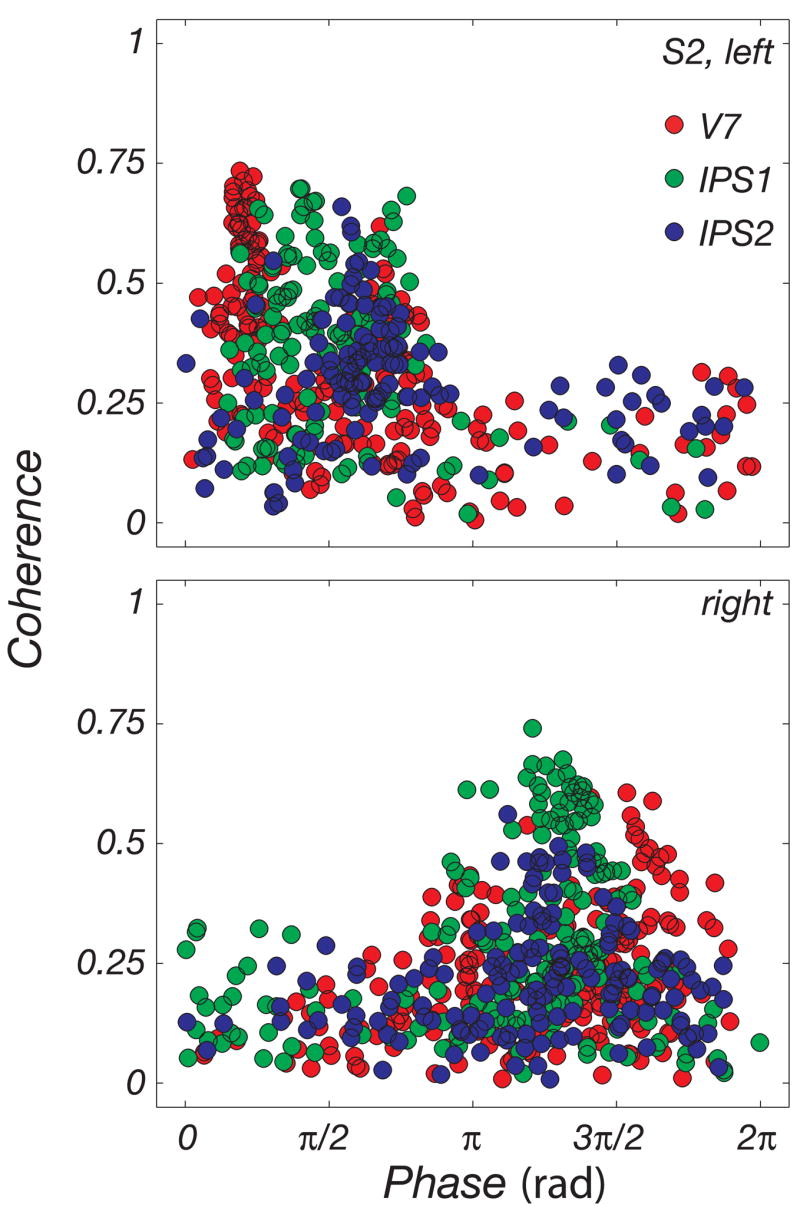
Contralateral response bias. A: distribution of coherence and phase values in the IPS. The analysis included all voxels in the PPC that responded significantly (coherence, c > 0.3, P < 2.14 × 10⁻⁵) in a separate saccade versus fixation localizer scan. Possible values for phases lie on [0,2π]. Coherence values can range between 0 and 1. Left hemisphere fMRI response phases covered a range of 0 to π radians, corresponding to contralateral target presentations. Right hemisphere response phases covered the complementary range of values.
The relationship among the measured time courses, underlying anatomy on the flat maps, and the color scale of the superimposed phase values is illustrated in Fig. 3. The smooth progression of phase on the maps can be illustrated by plotting the phase value as a function of distance on the flat map (Fig. 3, B and C). We defined a large rectangular ROI that included several phase reversals. For each pixel in the ROI, we determined the phase and coherence values and the vertical distance from the top edge of the ROI, which was defined as the origin. We found a smooth progression of tightly distributed phase values as a function of distance on the map and local maxima and minima in the progression of phase values. This complementary approach confirmed our method for defining topographic areas based on the maps of response phase.
The measured fMRI responses reflected three separate components of the delayed-saccade task (Fig. 7). First, if these IPS regions reflected only topography for delay period activity, we would have observed responses that modulated only with the periodicity of the cued locations (54-s period, f = 5 cycles/scan in our experiment). Second, if these regions reflected only motor commands for particular saccade directions, we would have observed a “frequency-doubled” response (27-s period, 2f = 10 cycles/scan) because there were two saccades on every trial. For example, an area of the right hemisphere that responded to only leftward saccades would have responded both when subjects made a saccade to a cued location on the left (followed by a rightward return saccade) and when they made a leftward return saccade (preceded by a saccade to a cued location on the right). Although the cued location moved around the visual field with a period of 54 s, activity would have modulated with a period of 27 s.1 Third, if these regions reflected an aspect of the task that occurred on each trial (e.g., the onset of the distractor annulus, arousal/attention to the target flashes regardless of their locations), we would have observed responses at the much higher frequency (4.5-s period, 12f = 60 cycles/scan) corresponding to the duration of each trial. In fact, we observed all three of these components in the time courses, suggesting that each of these factors contributed to the neural activity in these regions.
FIG. 7.
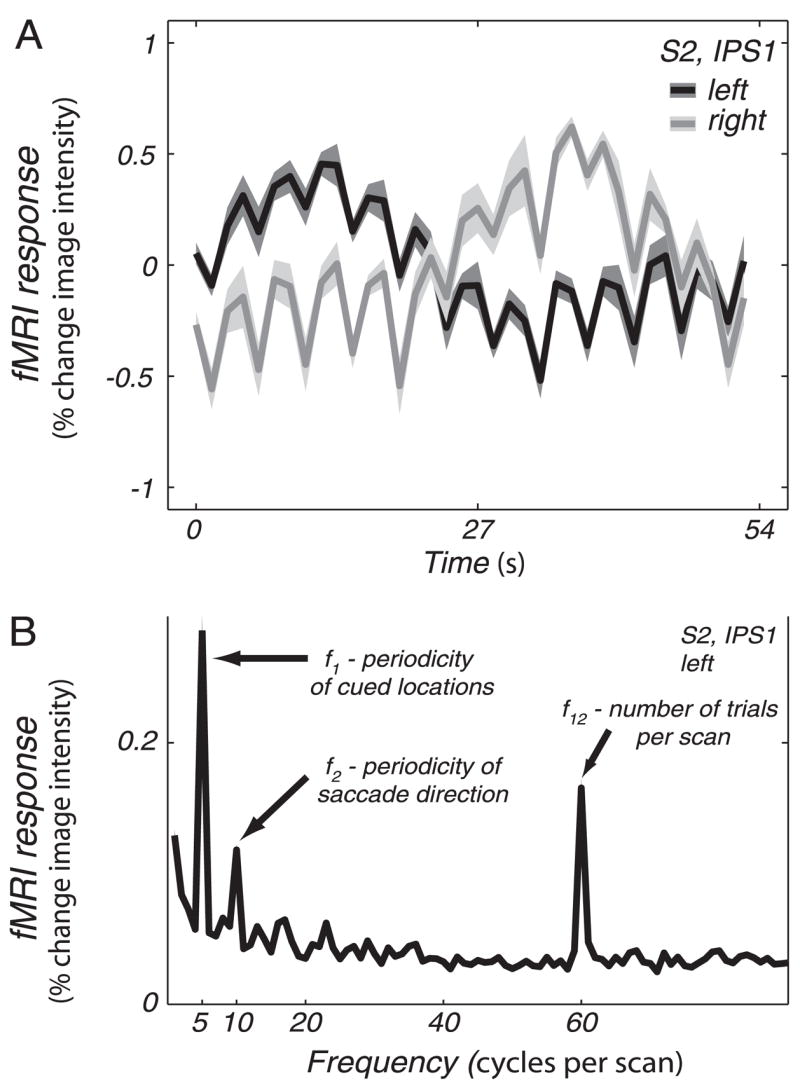
Multiple task components reflected in the fMRI responses. A: example time course for left and right hemisphere IPS1 in subject S2 (mean ± SE across cycles). Because targets progressed clockwise, starting at the upper vertical meridian, the right visual field was swept out first. Right hemisphere IPS1 responded more during this period, confirming the contralateral bias in this region of PPC. B: mean amplitude spectrum of the time courses of all voxels in IPS1 of subject S2. Note the peaks at 5, 10, and 60 cycles per scan. Five cycles per scan corresponds to the periodicity of the cued location, 10 cycles per scan to periodicity of saccades in a particular direction, and 60 cycles per scan to each individual trial (12 trials in each of 5 cycles).
The topographic organization for delayed saccades corresponds with independent measurements of topography during a visual spatial attention task in the absence of overt eye movements (Fig. 9). This is of particular relevance because neurons in macaque PPC have been reported to respond to both attention and saccade production under similar conditions (for review, see Andersen and Buneo 2002; Colby and Goldberg 1999). Two subjects (S1 and S4) in this study also took part in a separate experiment, which is presented in the companion paper (M. Silver, D. B. Ress, and D. J. Heeger, 2005). That experiment also revealed topographically organized areas in PPC; for the two subjects who participated in both experiments, the locations of areas V7, IPS1, and IPS2 and the orientations of the topographic maps within these areas corresponded well across the two experiments. Unlike the present study, the other experiment measured topography for visual spatial attention in the absence of overt eye movements. Note that the range of eccentricities in the attention topography experiment (1.5–4.5°) was different from the 10° eccentricity in the delayed-saccade experiment. Interestingly, although there was generally a good correspondence between the topographic maps revealed by these two experiments, there was a bias in the location of attention topography to more lateral positions on the cortical surface. It is therefore possible that the IPS regions map eccentricity in the medial-lateral direction with foveal locations being represented more laterally on the cortical surface in and near the IPS.
FIG. 9.

Comparison of cortical areas in current study with those from a study of topography for attention in the absence of eye movements (M. Silver, D. B. Ress, and D. J. Heeger, 2005). Right hemisphere flat map of subjects S1 (A) and S4 (B), who took part in both experiments. Landmarks and conventions as in Figs. 4 and 5. The regions outlined in red were obtained in the current (saccadotopy) experiment, those in white in the Silver et al. (attention) study. Scale bar, 1 cm.
DISCUSSION
PPC has been implicated in sensory attention, motor intention, decision making, and working memory. In extensive single-unit work during the last two decades, it has been established that there are several distinct subregions in PPC in non-human primates, although their individual functions remain a subject of hot debate. Decades of research in visual cortex have taught us that there is little hope of understanding the function of these cortical areas without first having precise, routine, and reliable methods for defining them. This is self-evident from an experimental point of view; one must be confident about performing the same measurement repeatedly in the same bit of cortical tissue for the necessary replications and controls. Cortical areas are defined using a variety of methods and a confluence of factors. One of the factors is topography, which refers to the orderly layout of information across a cortical area.
Here, we used the methodology introduced by Sereno et al. to measure the topography of delayed saccades in human PPC. We observed at least two phase reversals beyond the V3A/V7 vertical meridian representation, signaling boundaries between two adjacent cortical areas in IPS, which we tentatively refer to as IPS1 and IPS2. Wandell et al. (2004) report activity in posterior parietal cortex in standard retinotopy experiments, albeit weaker than the responses in early visual areas. This suggests that the topographic organization that we have found with delayed saccades might be revealed using standard retinotopic mapping, by averaging across a sufficient number of repeated scans.
There are possible alternative interpretations of our results (Fig. 10). There is no doubt that there is a phase reversal separating V7 from what we labeled IPS1 and another reversal separating IPS1 from what we labeled IPS2, but we leave open the possibility that IPS1 and IPS2 might be further subdivided. One possible alternative interpretation would subdivide the same region of cortex into two quarter-field representations (1a/b, Fig. 10) and two hemifield representations (2a/b, Fig. 10). The subdivision we suggest is more parsimonious for the following reasons: 1) the IPS1/2 division appears in all hemispheres in this and the companion study (M. Silver, D. B. Ress, and D. J. Heeger, 2005). 2) With our delineation, the sizes of IPS1/2 roughly match that of V7. The quarter-field representations would be substantially smaller. And 3) in the alternative (quarter-field) model, the sizes of the cortical areas are close to the limits of spatial accuracy imposed by our measurements. Hence, further measurements would have to be performed with smaller voxels to assess the plausibility of this alternative.
FIG. 10.

Alternative area boundaries for topographic maps. A: same map as in Fig. 3B but with alternative visual field delineations. V7 is smaller, areas 1a and 1b represent a quarter field each, areas 2a and 2b a hemifield each. B: phase values as a function of distance on cortical surface. C: color map (cf. Fig. 3, C and F).
The IPS1 and IPS2 regions we report here are distinct from the area previously proposed Sereno et al. as the human homologue of macaque LIP. The locations of IPS1 and IPS2 are more posterior (closer to V7 and other retinotopic visual areas) than their reported Talairach coordinates. The mean (Euclidean) distance from the locus reported by Sereno et al. to our area V7 is 30 mm, to IPS1 16 mm, and to IPS2 9 mm (see METHODS). Further, the more anterior IPS2 region had a visual field orientation that was opposite to that reported by Sereno et al. (2001). They reported a topographic map that represented a whole hemifield from lower to upper vertical meridia rostrally across the cortical surface. We found exactly the opposite in IPS2, a mapping of upper to lower visual meridia in the rostral direction on the cortical surface. It is possible that the area described by Sereno et al. lies just rostral to IPS2, with visual field sign opposite to that of IPS2 (consistent with the visual field sign reported by Sereno et al.). If this is correct, however, then our measurements failed to reveal it consistently.
One further notable difference between the results presented here and those of Sereno et al. relates to the time courses of the measured fMRI responses. We observed “frequency-doubled” responses corresponding to the two saccades on each trial (first, a saccade out to the cued location followed by a return saccade to central fixation), suggesting that these cortical areas reflect motor commands. Sereno et al. (2001) did not observe such a frequency-doubled response in the area they proposed as human LIP. The interpretation they offered is that the activity in that area was not primarily related to the saccades themselves but rather that it was dominated by the delay-period activity preceding the first saccade on each trial. Unlike Sereno et al., we also observed responses at the much higher frequency (4.5-s period, 60 cycles/scan) corresponding to the duration of each trial. However, neither the frequency-doubled responses nor the higher frequency exhibited a topographic organization that was consistent across subjects. This suggests that the neurons in these cortical areas may be topographically organized, not with respect to the direction of the executed movement per se but rather with respect to factors that covary with the location of the cue. For example, the position of the eye in the orbit, the desirability of a saccade, or the allocation of attention during the delay period could all contribute to this topographically organized activity.
There are purely methodological reasons for why the pattern of responses seen by Sereno et al. differ from those reported here. Our data were collected at 3T using an occipital surface coil with four receive channels, whereas they used a 1.5T scanner. The resulting improvement in signal-to-noise ratio may have helped to reveal the topographic maps more clearly in occipital and posterior parietal cortex. Further methodological differences with the previous study were voxel size (Sereno et al. 2001: 3 × 3 × 4 mm3; this study: 3 × 3 × 3 mm3), acquisition time (Sereno et al. 2001: 4 s; this study 1.5 s), and the software we used for gray/white matter segmentation, inflation, and flattening.
Several other groups have recently presented preliminary results that showed hints of topographic organization in posterior parietal cortex, although none of them reported two complete hemifield representations (as we found). Nor did they report the pattern observed by Sereno et al. (DeSimone et al. 2004; Huddleston and DeYoe 2004; Jack et al. 2004).
Our results are consistent with the interpretation that the topography in the IPS may be due to a relatively small bias toward contralateral responses in neurons that respond primarily bilaterally. It is important to note that our subjects performed between 720 and 1,440 saccades across several scanning sessions to yield the resulting topographic maps. In comparison, we obtained similar levels of statistical significance in about 1/10 of the time when subjects alternated between rapid eye movements and fixation (Fig. 8), a protocol that evoked strong responses but with no means for assessing topography. The weak topographic specificity that we observed in PPC might be caused by at least two factors. First, these areas might have precise topographic organization but large and broadly tuned response fields. Neurons with large response fields would be active through most of each cycle of the experiment, regardless of their topographic organization, evoking only weak response modulations. Second, the response fields might be small but poorly organized topographically. If a single voxel includes neurons with a number of different response field locations, spanning a large part of the visual field, then this would again yield only weak response modulations. Of course, the response fields might be both large and poorly organized because these two possibilities are not mutually exclusive. Either or both would suggest that the topographically organized component of the responses is superimposed on a background of bilateral activity. Consistent with this interpretation, previous fMRI measurements have reported only weak, if any, lateralization in many regions of PPC (Brown et al. 2004; Konen et al. 2004; Koyama et al. 2004; Simon et al. 2004).
The observation that these human IPS regions appear to have at least weak topographic organization is of particular interest because studies of this issue have yielded mixed results in monkeys. There are some reports that monkey LIP neurons are topographically organized, i.e., that each neuron has a response field that corresponds to a particular location in visual space and that there is an orderly layout of these response field locations across the cortical surface. Anecdotally, most researchers who have examined receptive field or movement field organization in macaque LIP have reported that as electrodes are advanced tangentially to the cortical surface the locations of sequentially encountered response field centers progress gradually through the visual/motor field. Most, however, also report occasional abrupt discontinuities in this progression within the anatomical boundaries of LIP. This has led to uncertainty about the topographic organization of LIP.
To explore this issue, Blatt et al. (1990) mapped the visual field locations that activated LIP neurons using classical visual stimuli consisting mostly of light bars. Their experiments were conducted in anesthetized animals. They reported that neurons in LIP preferentially represented locations in the contralateral visual field; a result commensurate with our findings here. A study by Ben Hamed et al. (2001) reported data from 171 LIP neurons in awake behaving rhesus monkeys performing a passive fixation task. They concluded that there exists a coarse but systematic topographic map in LIP of visual stimulus locations with a gradient from lower to upper visual field represented anterior to posterior (the opposite mapping of IPS1 reported here; the same as IPS2). Platt and Glimcher (1997), however, examined the response fields of 100 LIP in awake behaving animals performing a saccade task and reported that LIP was not biased to represent the contralateral visual or motor field. Their study used an experimental protocol that was the most similar to ours.
Adding to this complexity is the observation that neurons in LIP are also modulated by the position of the eye in the orbit (Andersen et al. 1985, 1990b; Snyder et al. 1998; Stricanne et al. 1996). Saccades of the same amplitude and direction initiated from different starting positions in the orbit give rise to different activity in the same neuron. Although the precise structure of this position dependent response, the gain field, is unknown, this must also be considered in interpreting our fMRI data. When in our experiment subjects made saccades from an eccentric target at an angle of 45° back to fixation and from fixation to a 225° target, they produced the same saccade amplitude and direction but from different orbital positions. Hence these two saccades would be expected to influence the activity of LIP neurons differently. Because we do not know the topographic organization of the gain field properties, even in the monkey, some of the responses we observed may have been due to gain field organization. Consistent with this possibility, we observed topographic organization only for the periodicity of the cued locations, not with respect to movement direction. Note, however, that movement direction is the property most often examined in single-unit electrophysiology.
There is now widespread agreement that the intraparietal sulcus of the macaque is lined with a series of separate and distinct cortical areas. Both anatomical studies and physiological studies attest to this fact. Medial to area LIP, for example, lies the anatomically defined area MIP which corresponds to the physiologically defined parietal reach region (PRR). The results from IPS1 and IPS2 in this study contribute to this debate in an interesting way. It is possible that one of the IPS areas reported here corresponds to macaque LIP and the other to MIP/PRR.
Although MIP/PRR was initially believed to be a saccade-related area, Snyder et al. (2000) demonstrated that this area is involved in the control of reaching movements by the fore-limbs. The initial confusion about the function of this region stems, at least in part, from the observation that during saccadic tasks, when no arm movement is required, neurons in this area show LIP-like responses. When, however, arm movements are required as well in more complex tasks, these neurons almost invariably covary with arm rather than eye movements. These data have led to the suggestion that PRR neurons are activated during purely saccadic tasks because eye and arm movements are often made in concert. Indeed, many of the areas lining the monkey IPS may be similar. Areas for hand shaping, reaching, lip movement, and eye movement may all be heavily interconnected and correlated in their activity.
These intercorrelations between representations of eye and limb movements may also bear on the topographic organization of these areas. In the monkey, for example, neurons in MIP/PRR appear to encode the locations of reaching targets with respect to fixation, a framework known as oculocentric coordinates. There also appears to be lateralization in this area with regard to effector; movements of the right arm seem to be preferentially represented in the left PRR. fMRI studies of humans, however, have been controversial in this regard. Connolly et al. (2002) reported an area that they proposed is homologous to PRR in the human, but there was no clear evidence for topography or lateralization of any kind in their data. In contrast, Medendorp et al. (2004) have recently reported a possible homologue for PRR that does show lateralization with regard to effector.
Another possible interpretation of our results rests on the possible subdivision of macaque LIP into more than one topographic map. The occasional discontinuities in the LIP topography observed by monkey physiologists, and the segmentation into ventral (LIPv) and dorsal (LIPd) subareas that has been observed anatomically (Ben Hamed et al. 2001; Lewis and Van Essen 2000) may in fact correspond to the subdivisions in human PPC that we found with fMRI.
All three regions of interest in this study (V7, IPS1, and IPS2) showed a similar topographic organization, similar responses to contraversive saccades, and similar responses at the frequency of individual trials. These regions are therefore indistinguishable—functionally—in the current experiment. Any conclusion about possible functional homologies between these areas and macaque LIP are therefore not warranted. Further experiments are needed to establish which of these areas might correspond to the various regions in macaque PPC. Of particular importance will be to establish whether these human cortical areas exhibit the defining physiological features of monkey LIP, namely: responses to visual stimuli, activity before saccadic eye movements, sustained delay-period activity, and sensitivity to reward magnitude and probability.
Acknowledgments
We thank J. Larsson and M. Silver for helpful discussion and comments on the manuscript.
GRANTS
This research was supported by National Eye Institute Grant R01-EY-11794 and by a grant from the Seaver Foundation.
Footnotes
Some frequency-doubled modulation is also expected in topographically organized cortical areas because of the uneven duty-cycle (each target appeared on 1/12 of the trials).
References
- Aguirre GK, Zarahn E, D’Esposito M. Empircal analysis of BOLD fMRI statistics. II. Spatially smoothed data collected under null-hypothesis and experimental conditions. Neuroimage. 1997;5:199–212. doi: 10.1006/nimg.1997.0264. [DOI] [PubMed] [Google Scholar]
- Andersen RA, Asanuma C, Essick G, Siegel RM. Cortico-cortical connections of anatomically and physiologically defined subdivisions within the inferior parietal lobule. J Comp Neurol. 1990a;296:65–113. doi: 10.1002/cne.902960106. [DOI] [PubMed] [Google Scholar]
- Andersen RA, Bracewell RM, Barash S, Gnadt JW, Fogassi L. Eye position effects on visual, memory, and saccade-related activity in areas LIP and 7a of macaque. J Neurosci. 1990b;10:1176–1196. doi: 10.1523/JNEUROSCI.10-04-01176.1990. [DOI] [PMC free article] [PubMed] [Google Scholar]
- Andersen RA, Buneo CA. Intentional maps in posterior parietal cortex. Annu Rev Neurosci. 2002;25:189–220. doi: 10.1146/annurev.neuro.25.112701.142922. [DOI] [PubMed] [Google Scholar]
- Andersen RA, Essick GK, Siegel RM. Encoding of spatial location by posterior parietal neurons. Science. 1985;230:456–458. doi: 10.1126/science.4048942. [DOI] [PubMed] [Google Scholar]
- Andrews TJ, Halpern SD, Purves D. Correlated size variations in human visual cortex, lateral geniculate nucleus, and optic tract. J Neurosci. 1997;17:2859–2868. doi: 10.1523/JNEUROSCI.17-08-02859.1997. [DOI] [PMC free article] [PubMed] [Google Scholar]
- Astafiev SV, Shulman GL, Stanley CM, Snyder AZ, Van Essen DC, Corbetta M. Functional organization of human intraparietal and frontal cortex for attending, looking, and pointing. J Neurosci. 2003;23:4689–4699. doi: 10.1523/JNEUROSCI.23-11-04689.2003. [DOI] [PMC free article] [PubMed] [Google Scholar]
- Ben Hamed S, Duhamel JR, Bremmer F, Graf W. Representation of the visual field in the lateral intraparietal area of macaque monkeys: a quantitative receptive field analysis. Exp Brain Res. 2001;140:127–144. doi: 10.1007/s002210100785. [DOI] [PubMed] [Google Scholar]
- Biswal B, Hudetz AG, Yetkin FZ, Haughton VM, Hyde JS. Hypercapnia reversibly suppresses low-frequency fluctuations in the human motor cortex during rest using echoplanar MRI. J Cereb Blood Flow Metab. 1997a;17:301–308. doi: 10.1097/00004647-199703000-00007. [DOI] [PubMed] [Google Scholar]
- Biswal BB, Van Kylen J, Hyde JS. Simultaneous assessment of flow and bold signals in resting-state functional connectivity maps. NMR Biomed. 1997b;10:165–170. doi: 10.1002/(sici)1099-1492(199706/08)10:4/5<165::aid-nbm454>3.0.co;2-7. [DOI] [PubMed] [Google Scholar]
- Biswal B, Yetkin FZ, Haughton VM, Hyde JS. Functional connectivity in the motor cortex of resting human brain using echoplanar MRI. Magn Reson Med. 1995;341:537–541. doi: 10.1002/mrm.1910340409. [DOI] [PubMed] [Google Scholar]
- Blatt GJ, Andersen RA, Stoner GR. Visual receptive field organization and cortico-cortical connections of the lateral intraparietal area (area LIP) in the macaque. J Comp Neurol. 1990;299:421–445. doi: 10.1002/cne.902990404. [DOI] [PubMed] [Google Scholar]
- Brown MRG, DeSouza JFX, Goltz HC, Ford K, Menon RS, Goodale MA, Everling S. Comparison of memory and visually guided saccades using eventrelated fMRI. J Neurophysiol. 2004;91:873–889. doi: 10.1152/jn.00382.2003. [DOI] [PubMed] [Google Scholar]
- Colby CL, Duhamel JR. Heterogeneity of extrastriate visual areas and multiple parietal areas in the macaque monkey. Neuropsychologia. 1991;29:517–537. doi: 10.1016/0028-3932(91)90008-v. [DOI] [PubMed] [Google Scholar]
- Colby CL, Goldberg ME. Space and attention in parietal cortex. Annu Rev Neurosci. 1999;22:319–349. doi: 10.1146/annurev.neuro.22.1.319. [DOI] [PubMed] [Google Scholar]
- Connolly JD, Goodale MA, Menon RS, Munoz DP. Human fMRI evidence for the neural correlates of preparatory set. Nat Neurosci. 2002;5:1345–1352. doi: 10.1038/nn969. [DOI] [PubMed] [Google Scholar]
- Curtis CE, Rao VY, D’Esposito M. Maintenance of spatial and motor codes during oculomotor delayed response tasks. J Neurosci. 2004;24:3944–3952. doi: 10.1523/JNEUROSCI.5640-03.2004. [DOI] [PMC free article] [PubMed] [Google Scholar]
- DeSimone K, Schneider K, Pinsk M, Norman K, Kastner S. Response properties of a putative LIP area in human parietal cortex. Soc Neurosci Abstr. 2004:751.16. [Google Scholar]
- DeYoe EA, Carman GJ, Bandettini P, Glickman S, Wieser J, Cox R, Miller D, Neitz J. Mapping striate and extrastriate visual areas in human cerebral cortex. Proc Natl Acad Sci USA. 1996;93:2382–2386. doi: 10.1073/pnas.93.6.2382. [DOI] [PMC free article] [PubMed] [Google Scholar]
- Dorris MC, Glimcher PW. Activity in posterior parietal cortex is correlated with the relative subjective desirability of action. Neuron. 2004;44:365–378. doi: 10.1016/j.neuron.2004.09.009. [DOI] [PubMed] [Google Scholar]
- Dougherty RF, Koch VM, Brewer AA, Fischer B, Modersitzki J, Wandell BA. Visual field representations and locations of visual areas V1/2/3 in human visual cortex. J Vis. 2003;3:586–598. doi: 10.1167/3.10.1. [DOI] [PubMed] [Google Scholar]
- Duhamel JR, Colby CL, Goldberg ME. The updating of the representation of visual space in parietal cortex by intended eye movements. Science. 1992;255:90–92. doi: 10.1126/science.1553535. [DOI] [PubMed] [Google Scholar]
- Duncan RO, Boynton GM. Cortical magnification within human primary visual cortex correlates with acuity thresholds. Neuron. 2003;38:659–671. doi: 10.1016/s0896-6273(03)00265-4. [DOI] [PubMed] [Google Scholar]
- Ejima Y, Takahashi S, Yamamoto H, Fukunaga M, Tanaka C, Ebisu T, Umeda M. Interindividual and interspecies variations of the extrastriate visual cortex. Neuroreport. 2003;14:1579–1583. doi: 10.1097/00001756-200308260-00008. [DOI] [PubMed] [Google Scholar]
- Engel SA, Glover GH, Wandell BA. Retinotopic organization in human visual cortex and the spatial precision of functional MRI. Cereb Cortex. 1997;7:181–192. doi: 10.1093/cercor/7.2.181. [DOI] [PubMed] [Google Scholar]
- Engel SA, Rumelhart DE, Wandell BA, Lee AT, Glover GH, Chichilnisky EJ, Shadlen MN. fMRI of human visual cortex. Nature. 1994;369:525. doi: 10.1038/369525a0. [DOI] [PubMed] [Google Scholar]
- Glimcher PW. The neurobiology of visual-saccadic decision making. Annu Rev Neurosci. 2003;26:133–179. doi: 10.1146/annurev.neuro.26.010302.081134. [DOI] [PubMed] [Google Scholar]
- Goldberg ME, Bisley J, Powell KD, Gottlieb J, Kusunoki M. The role of the lateral intraparietal area of the monkey in the generation of saccades and visuospatial attention. Ann NY Acad Sci. 2002;956:205–215. doi: 10.1111/j.1749-6632.2002.tb02820.x. [DOI] [PubMed] [Google Scholar]
- Huddleston W, DeYoe E. Behavioral modulation of visuospatial attention maps in human parietal cortex. Soc Neurosci Abstr. 2004:709.8. [Google Scholar]
- Jack A, Patel G, Astafiev S, Snyder A, McAvoy M, Shulman G, Corbetta M. Retinotopic specificity in human parietal, temporal and frontal cortices. Soc Neurosci Abstr. 2004:717.3. [Google Scholar]
- Jenkinson M, Bannister P, Brady J, Smith S. Improved optimisation for the robust and accurate linear registration and motion correction of brain images. NeuroImage. 2002;17:825–841. doi: 10.1016/s1053-8119(02)91132-8. [DOI] [PubMed] [Google Scholar]
- Konen CS, Kleiser R, Wittsack HJ, Bremmer F, Seitz RJ. The encoding of saccadic eye movements within human posterior parietal cortex. Neuroimage. 2004;22:304–314. doi: 10.1016/j.neuroimage.2003.12.039. [DOI] [PubMed] [Google Scholar]
- Koyama M, Hasegawa I, Osada T, Adachi Y, Nakahara K, Miyashita Y. Functional magnetic resonance imaging of macaque monkeys performing visually guided saccade tasks: comparison of cortical eye fields with humans. Neuron. 2004;41:795–807. doi: 10.1016/s0896-6273(04)00047-9. [DOI] [PubMed] [Google Scholar]
- Kusunoki M, Gottlieb J, Goldberg ME. The lateral intraparietal area as a salience map: the representation of abrupt onset, stimulus motion, and task relevance. Vision Res. 2000;40:1459–1468. doi: 10.1016/s0042-6989(99)00212-6. [DOI] [PubMed] [Google Scholar]
- Larsson J. PhD thesis. Stockholm, Sweden: Karolinska Institutet; 2001. Imaging Vision: Functional Mapping of Intermediate Visual Processes in Man. [Google Scholar]
- Lewis JW, Van Essen DC. Mapping of architectonic subdivisions in the macaque monkey with emphasis on parieto-occipital cortex. J Comp Neurol. 2000;428:79–111. doi: 10.1002/1096-9861(20001204)428:1<79::aid-cne7>3.0.co;2-q. [DOI] [PubMed] [Google Scholar]
- Medendorp W, Goltz HC, Crawford JD, Vilis T. Integration of target and effector information in human posterior parietal cortex for the planning of action. J Neurophysiol. 2004;93:954–962. doi: 10.1152/jn.00725.2004. [DOI] [PubMed] [Google Scholar]
- Merriam EP, Genovese CR, Colby CL. Spatial updating in human parietal cortex. Neuron. 2003;39:361–373. doi: 10.1016/s0896-6273(03)00393-3. [DOI] [PubMed] [Google Scholar]
- Mountcastle VB, Lynch JC, Georgopoulos A, Sakata H, Acuna C. Posterior parietal association cortex of the monkey: command functions for operations within extrapersonal space. J Neurophysiol. 1975;38:871–908. doi: 10.1152/jn.1975.38.4.871. [DOI] [PubMed] [Google Scholar]
- Nestares O, Heeger DJ. Robust multiresolution alignment of MRI brain volumes. Magn Reson Med. 2000;43:705–715. doi: 10.1002/(sici)1522-2594(200005)43:5<705::aid-mrm13>3.0.co;2-r. [DOI] [PubMed] [Google Scholar]
- Platt ML, Glimcher PW. Responses of intraparietal neurons to saccadic targets and visual distractors. J Neurophysiol. 1997;78:1574–1589. doi: 10.1152/jn.1997.78.3.1574. [DOI] [PubMed] [Google Scholar]
- Platt ML, Glimcher PW. Neural correlates of decision variables in parietal cortex. Nature. 1999;400:233–238. doi: 10.1038/22268. [DOI] [PubMed] [Google Scholar]
- Press WA, Brewer AA, Dougherty RF, Wade AR, Wandell BA. Visual areas and spatial summation in human visual cortex. Vision Res. 2001;41:1321–1332. doi: 10.1016/s0042-6989(01)00074-8. [DOI] [PubMed] [Google Scholar]
- Purdon P, Weisskoff R. Effect of temporal autocorrelation due to physiological noise and stimulus paradigm on voxel-level false-positive rates in fMRI. Hum Brain Mapp. 1998;61:239–249. doi: 10.1002/(SICI)1097-0193(1998)6:4<239::AID-HBM4>3.0.CO;2-4. [DOI] [PMC free article] [PubMed] [Google Scholar]
- Robinson DL, Goldberg ME, Stanton GB. Parietal association cortex in the primate: sensory mechanisms and behavioral modulations. J Neurophysiol. 1978;41:910–932. doi: 10.1152/jn.1978.41.4.910. [DOI] [PubMed] [Google Scholar]
- Roitman JD, Shadlen MN. Response of neurons in the lateral intraparietal area during a combined visual discrimination reaction time task. J Neurosci. 2002;22:9475–9489. doi: 10.1523/JNEUROSCI.22-21-09475.2002. [DOI] [PMC free article] [PubMed] [Google Scholar]
- Schluppeck D, Muller J, Sayres R, Glimcher P, Heeger D. Topographic organization for delayed saccades in human posterior parietal cortex. Soc Neurosci Abstr. 2004:991.7. doi: 10.1152/jn.01290.2004. [DOI] [PMC free article] [PubMed] [Google Scholar]
- Sereno MI, Dale AM, Reppas JB, Kwong KK, Belliveau JW, Brady TJ, Rosen BR, Tootell RB. Borders of multiple visual areas in humans revealed by functional magnetic resonance imaging. Science. 1995;268:889–893. doi: 10.1126/science.7754376. [DOI] [PubMed] [Google Scholar]
- Sereno MI, Pitzalis S, Martinez A. Mapping of contralateral space in retinotopic coordinates by a parietal cortical area in humans. Science. 2001;294:1350–1354. doi: 10.1126/science.1063695. [DOI] [PubMed] [Google Scholar]
- Shadlen MN, Newsome WT. Motion perception: seeing and deciding. Proc Natl Acad Sci USA. 1996;93:628–633. doi: 10.1073/pnas.93.2.628. [DOI] [PMC free article] [PubMed] [Google Scholar]
- Silver MA, Ress D, Heeger DJ. Topographic maps of visual spatial attention in human parietal cortex. J Neurophysiol. 2005;94:1357–1370. doi: 10.1152/jn.01316.2004. [DOI] [PMC free article] [PubMed] [Google Scholar]
- Simon O, Mangin JF, Cohen L, Le Bihan D, Dehaene S. Topographical layout of hand, eye, calculation, and language related areas in the human parietal lobe. Neuron. 2004;33:475–487. doi: 10.1016/s0896-6273(02)00575-5. [DOI] [PubMed] [Google Scholar]
- Smith AM, Lewis BK, Ruttimann UE, Ye FQ, Sinnwell TM, Yang Y, Duyn JH, Frank JA. Investigation of low frequency drift in fMRI signal. Neuroimage. 1999;93:526–533. doi: 10.1006/nimg.1999.0435. [DOI] [PubMed] [Google Scholar]
- Smith S. Fast robust automated brain extraction. Hum Brain Mapp. 2002;17:143–155. doi: 10.1002/hbm.10062. [DOI] [PMC free article] [PubMed] [Google Scholar]
- Snyder LH. Coordinate transformations for eye and arm movements in the brain. Curr Opin Neurobiol. 2000;10:747–754. doi: 10.1016/s0959-4388(00)00152-5. [DOI] [PubMed] [Google Scholar]
- Snyder LH, Batista AP, Andersen RA. Saccade-related activity in the parietal reach region. J Neurophysiol. 2000;83:1099–1102. doi: 10.1152/jn.2000.83.2.1099. [DOI] [PubMed] [Google Scholar]
- Snyder LH, Grieve KL, Brotchie P, Andersen RA. Separate body and world-referenced representations of visual space in parietal cortex. Nature. 1998;394:887–191. doi: 10.1038/29777. [DOI] [PubMed] [Google Scholar]
- Sokal RR, Rohlf FJ. Biometry: The Principles and Practice of Statistics in Biological Research. 3. NewYork: Freeman; 1995. [Google Scholar]
- Stricanne B, Andersen RA, Mazzoni P. Eye centered, head centered, and intermediate coding of remembered sound locations in area lip. J Neurophysiol. 1996;76:2071–2076. doi: 10.1152/jn.1996.76.3.2071. [DOI] [PubMed] [Google Scholar]
- Talairach J, Tournoux P. Co-Planar Stereotaxic Atlas of the Human Brain. Thieme Medical Publishers; New York: 1988. [Google Scholar]
- Wandell BA, Brewer AA, Dougherty RF. Visual field map clusters in human cortex. Phil Trans R Soc B. 2005;360:1628. doi: 10.1098/rstb.2005.1628. [DOI] [PMC free article] [PubMed] [Google Scholar]
- Woolrich MW, Ripley BD, Brady M, Smith SM. Temporal autocorrelation in univariate linear modeling of FMRI data. Neuroimage. 2001;14:1370–1386. doi: 10.1006/nimg.2001.0931. [DOI] [PubMed] [Google Scholar]
- Zarahn E, Aguirre GK, D’Esposito M. Empircal analysis fo BOLD fMRI statistics I. spatially unsmoothed data collected under null hypothesis conditions. Neuroimage. 1997;5:179–197. doi: 10.1006/nimg.1997.0263. [DOI] [PubMed] [Google Scholar]