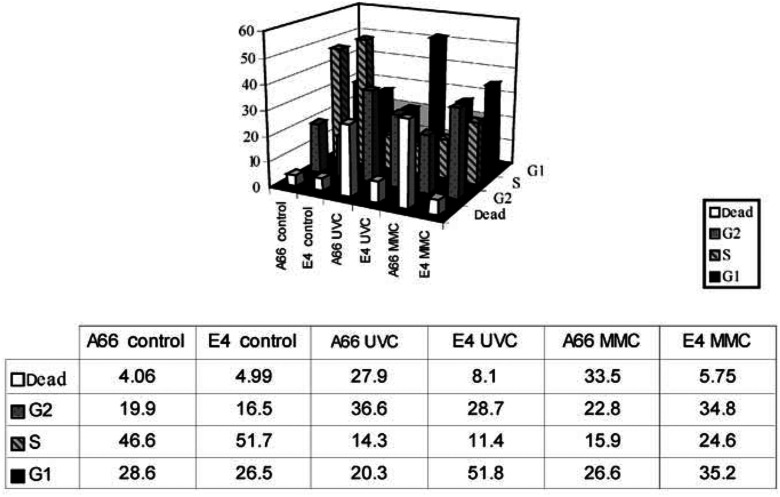
Figure 5.
UVC and mitomycin C induced cell death in Fhit-positive but not in Fhit-negative cells. Cells were synchronised first by growth in low serum and then by aphidicolin treatment for 16 h. Cells were released into S phase for 3–5 h and then left untreated (control) or mitomycin C or UVC treated. FACs analysis was performed at 18–21 h afterward, as shown for a representative experiment (21 h). The fraction of cells in specific phases of the cell cycle are illustrated in the bar graph and listed in the table below the bar graph.

