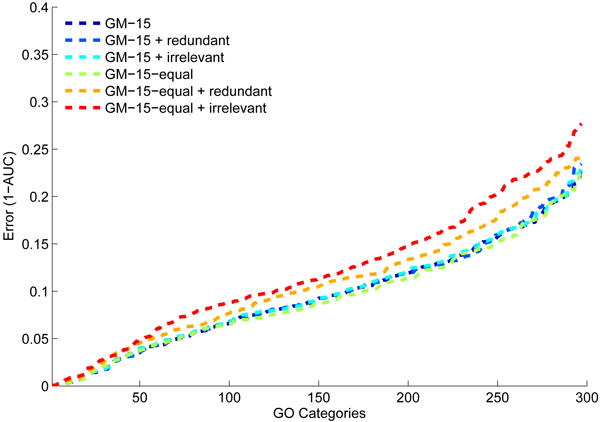
Figure 8.
Prediction performance of GeneMANIA in the presence of irrelevant and redundant networks. Cumulative distribution of 1 - area under the receiver operating characteristic curve (1 - AUC) scores on 300 yeast Gene Ontology (GO) categories using GeneMANIA optimized weights and equal weights in the presence of redundant and irrelevant networks.

