

Abstract
Thalamocortical afferents in the visual cortex of the adult sable ferret are segregated into eye-specific ocular dominance bands. The development of ocular dominance bands was studied by transneuronal labeling of the visual cortices of ferret kits between the ages of postnatal day 28 (P28) and P81 after intravitreous injections of either tritiated proline or wheat germ agglutinin-horseradish peroxidase. Laminar specificity was evident in the youngest animals studied and was similar to that in the adult by P50. In P28 and P30 ferret kits, no modulation reminiscent of ocular dominance bands was detectable in the pattern of labeling along layer IV. By P37 a slight fluctuation in the density of labeling in layer IV was evident in serial reconstructions. By P50, the amplitude of modulation had increased considerably but the pattern of ocular dominance bands did not yet appear mature. The pattern and degree of modulation of the ocular dominance bands resembled that in adult animals by P63. Flat mounts of cortex and serial reconstructions of layer IV revealed an unusual arrangement of inputs serving the two eyes in the region rostral to the periodic ocular dominance bands. In this region, inputs serving the contralateral eye were commonly fused along a mediolateral axis, rostral to which were large and sometimes fused patches of ipsilateral input.
Keywords: area 17, transneuronal, cortical columns, thalamocortical, functional architecture, critical period
The ferret (Mustela putorius) is a domesticated carnivore with a visual system similar to that of the cat (Vitek et al., 1985; Rockland, 1985; Zahs and Stryker, 1985; Law et al., 1988; Baker et al., 1998). The ferret visual cortex, like that of the cat, consists of feature maps of visual field topography, eye dominance, stimulus orientation preference, and direction selectivity (Law et al., 1988; Redies et al., 1990; Chapman et al., 1996; Weliky et al., 1996; Rao et al., 1997). In addition, thalamocortical afferents from the lateral geniculate nucleus (LGN) are segregated in the cortex into columns of ON- and OFF-center contrast preference in the ferret (Zahs and Stryker, 1988). Ferrets have relatively immature visual systems at birth (Linden et al., 1981; Jackson et al., 1989), making them appealing for studies of visual system development and cortical map formation.
The functional map of ocular dominance has a direct anatomical correlate (Shatz and Stryker, 1978). Afferent terminals from each of the monocular laminae of the lateral geniculate nucleus (LGN) project to cortical layer IV as segregated eye-specific patches in adult animals (Hubel and Wiesel, 1972). These anatomical ocular dominance bands can be revealed by injecting a transynaptic anterograde tracer into one eye (Wiesel et al., 1974; Shatz et al., 1977). In the cat, ocular dominance bands are not present at birth, but instead emerge from an initially intermingled set of inputs from both eyes (LeVay et al., 1978). The segregation of afferents into eye-specific bands relies on an activity-dependent mechanism that exploits the fact that the exact patterns of neural activity in the two eyes are mostly uncorrelated with each other. This permits the inputs representing each eye to be distinguished purely on the basis of their patterns of electrical activity (Stryker and Strickland, 1984; Stryker and Harris, 1986). Their segregation into patches has been proposed to result from the strengthening or weakening of inputs whose activity is, respectively, strongly or weakly (negatively) correlated with the local network of postsynaptic neurons (Stent, 1973; Reiter and Stryker, 1988; Bear et al., 1990; Hata and Stryker, 1994; reviewed in Miller and Stryker, 1990).
Here, we present the time course of the formation of ocular dominance bands in the sable ferret with the aim of facilitating a direct comparison to the extensively characterized development of cat visual cortex. This study uses tangential reconstructions of transneuronal labeling in layer IV made from montaged serial autoradiographic sections of visual cortex and from tangential sections through layer IV of unfolded, flattened visual cortex. The reconstructions reveal that, like ocular dominance bands in cat, ferret ocular dominance bands emerge from an initially mixed distribution of afferents representing the two eyes, but the basic layout of the bands differs somewhat between cats and ferrets, most notably in the rostral region of visual cortex. Some of this work has been presented earlier in abstract form (Ruthazer et al., 1995).
MATERIALS AND METHODS
Thirteen normally pigmented, sable ferrets obtained from Marshall Farms (North Rose, NY) were used in this study. The day of birth was counted as postnatal day 0 (P0) in our nomenclature. All animals in this study had coloration and markings within the normal range for fully pigmented sable ferrets. All experiments were approved by the University of California at San Francisco Committee on Animal Research and conform to NIH guidelines on animal research.
Transneuronal labeling of ocular dominance bands
Tritiated proline
Ferrets ranging in age from P21 to P71 were anesthetized by inhalation of halothane (0.5−5%) in a 2:1 nitrous oxide:oxygen mixture. The fur around the left eye was shaved and swabbed with disinfectant (Zephiran). Under aseptic conditions, the eyelids were separated, the lateral canthus of the left eyelid was cut, and connective tissue was blunt dissected away to reveal the lateral margin of the eye. A small hole was made in the sclera by using a sterile 30-gauge needle to accommodate insertion of a glass micropipette attached by polyethylene tubing to a Hamilton microsyringe filled with silicone oil. The tip of the pipette contained the tracer solution of 2 mCi lyophilized [3H]proline (Amersham) reconstituted in 10 μl of sterile saline, separated from the oil in the injection apparatus by a small air bubble. The tracer was injected slowly into the eye over eight minutes. The injection pipette was then retracted from the eye, and the hole was gently blotted with a cotton swab to absorb any solution that may have leaked from the hole. A small drop of cyanoacrylate glue was used to seal the hole, and the lateral canthus was sutured shut, taking care not to occlude vision through the eye. The ferret kits were then given a prophylactic injection of ampicillin and returned to their mothers when sternally recumbent. After each injection, the radioactivity in the micropipette, cotton swab, and mixing vial was measured by using a Beckman LS2800 scintillation counter to calculate the proportion of the original 2 mCi of tracer that had been successfully injected. If it was determined that less than 1 mCi had been injected, a second injection was made.
Typically, 7−10 days later (the sole exception being the P56 kit that was injected at P38), ferret kits were deeply anesthetized by intraperitoneal injection of pentobarbital sodium (Nembutal) and perfused transcardially with 0.1 M phosphate buffer (pH 7.4) followed by 4% paraformaldehyde in 0.1 M phosphate buffer. After several days post-fixation in 30% sucrose/4% paraformaldehyde in 0.1 M phosphate buffer, the cortices and lateral geniculate nuclei (LGN) were separated, the LGNs were cut in the parasagittal plane on a Vibratome either at 50 μm or as a repeating series of 50-μm, 50-μm, and 100-μm sections, the 100-μm section being cut later into semithin sections for spillover measurements as described below. LGN sections were mounted on gelatinized slides and were processed for autoradiography by dipping in Kodak-2 emulsion and exposing in darkness for two weeks before developing with Kodak D19. If the LGN sections showed successful labeling after two weeks exposure time, 30-μm frozen sections of the occipital cortices were then cut in a plane approximately midway between horizontal and sagittal, parallel to the long axis of the posterior lateral gyrus, and processed for autoradiography as above except that up to two months exposure time was used. This plane of section maximized the amount of binocular cortex in each section based on the maps of Law et al. (1988). All cortical sections in a series were processed for autoradiography except for one section in six that was Nissl stained. In the case of three of the animals perfused at P30, the occipital cortices were physically unfolded and post-fixed several days between two glass slides separated by 1.2-mm-thick spacers and then cut at 40-μm on the freezing microtome tangentially to the pial surface. The flattening procedure was essentially identical to that described in Ruthazer and Stryker (1996).
Measuring spillover of radioactivity in the LGN
For five of the experimental animals, small tissue blocks (approximately 1 × 2 mm) containing both the A and A1 laminae of the LGN were cut from parasagittal Vibratome sections of the thalamus taken at 50 or 100 μm. These were osmicated, embedded in plastic (glycolmethacrylate), cut into 2-μm sections, and mounted onto slides. The slides were then processed for autoradiography and counter-stained in toluidine blue. In topographically corresponding regions of laminae A and A1, about 100 cell bodies and their nuclei were traced per lamina by using a microscope with a 100× oil immersion objective and drawing tube. The number of autoradiographic silver grains contained within the nuclear profile of each of these cells was counted. Measurements were confined to cell nuclei so as to examine transport of radioactivity into a cellular compartment distinct from somatic cytosol and to exclude radioactivity in fibers of passage from the spillover estimate. The areas of all the nuclei were measured by using NIH Image software after scanning the camera lucida drawings with a flatbed scanner. Spillover was calculated as the ratio (corrected for background silver grain levels) of the number of nuclear silver grains per nuclear area in the unlabeled lamina to that in the labeled lamina.
Wheat germ agglutinin-horseradish peroxidase
Intravitreous injections of 10 μl of wheat germ agglutinin-horseradish peroxidase (WGA-HRP, 5% in saline, Sigma) were made by using the same basic technique as for injections of [3H]proline, except that injections were made both at six and at four days before perfusion. Animals were perfused transcardially with 0.1 M phosphate buffer followed by 2% glutaraldehyde in 0.1 M phosphate buffer. The cortices were unfolded and flattened between glass slides as above and cryoprotected overnight in 30% sucrose in 0.1 M phosphate buffer. Forty-micrometer frozen sections were cut and immediately reacted by using the enhanced TMB method of Anderson et al. (1988).
Two-dimensional reconstructions of the pattern of labeling
A series of autoradiographic sections, separated by no more than 120 μm, were photographed at low magnification (3×−8×) under darkfield optics. Photographic negatives were then scanned at high resolution (2700 d.p.i.) by using a Polaroid SprinScan 35-slide scanner. By using Adobe Photoshop 3.0 software, layer IV from each section was cut out, rotated, and pasted into a montage of layer IV from the entire series. Images of sections were never warped or distorted, but “relieving cuts” were made occasionally to permit alignment of columns in distant parts of the sections. This method was particularly useful for flat mounts and for cases in which several sections contained large, nearly tangential stretches through layer IV, as occasionally occurred fortuitously in sections near the occipitotemporal sulcus (a concavity on the ventral aspect of the posterior lateral gyrus, which accommodates the anterior cerebellum). To compensate for variation in the degree of contrast between different photographs, the look-up tables for all the images were always stretched linearly to occupy the full eight bits of dynamic range without altering the relative intensities of pixels within an image.
Quantitative analysis
A suitable region for grain counting was selected under darkfield optics at low magnification (2×). Video images along the middle of layer IV were then captured under brightfield optics at high magnification (40× objective with 2× optivar) and bandpass filtered by using NIH Image software (image convolution with difference-of-Gaussians kernel: half-widths at half-height = 0.18 and 0.40 μm) to separate occasional adjacent pairs of silver grains. Filtered images were then thresholded at 50% intensity and the number of labeled particles within analysis windows of 80 × 12 μm (640 × 96 pixels) was counted by the software. To measure the laminar distribution of silver grains (Figs. 1, 2) or the modulation along a strip of layer IV (Fig. 5), this procedure was repeated for many iterations, each time shifting the microscope stage one full video field along the 12-μm axis of the analysis windows. At the magnification used, this automated process produced identical results to counting by eye.
Fig. 1.
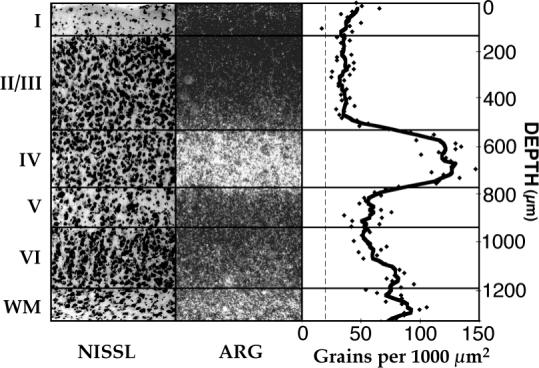
Mature laminar distribution of transneuronal label. Autoradiographic label forms a prominent band in layer IV and falls to near background levels in the upper part of layer II/III. Intermediate labeling is evident in layer VI. A Nissl-stained adjacent section (left) and the autoradiographic section (ARG) from which the silver grain counts were made (middle) are included for reference. Measurements were made in the monocular segment of area 17 contralateral to the injected eye of a P81 ferret. Density is given in silver grains per 1,000 μm2. The thick curve is the mean sliver grain density averaged across a distance of 108 μm (nine bins of 12 × 80 μm). The dashed line indicates background silver grain counts, measured in auditory cortex. WM, white matter.
Fig. 2.

Laminar distribution of transneuronal label during development. At all ages studied (postnatal day [P] 28, P37, P50, P63), labeling is greatest in layer IV, but the density of label within layer IV relative to the surrounding layers increases gradually with age and achieves a qualitatively mature distribution by P50. Label density is near background levels in upper layer II/III at all ages, consistent with a selective increase in layer IV label during development, rather than exuberance and pruning. There is also a slight increase in the thickness of the visual cortex between P28 and P37. Conventions are the same as in Figure 1.
Fig. 5.

Development of modulation in the eye-specific pattern of transneuronal label. Silver grain counts along layer IV in the binocular regions of area 17 from transneuronal autoradiographs are plotted for both hemispheres at various ages. At postnatal day (P)30, a modulation in the pattern of labeling is not evident. By P37, a faint fluctuation is detectable. The amplitude of this modulation increases by P50 but appears to be restricted to small patches in the ipsilateral hemisphere. The crisp, almost square wave pattern of label in the P63 and P81 ferrets indicates that a high degree of segregation is present at these ages. Conventions are the same as in Figure 1.
RESULTS
Maturation of the thalamocortical projection
Figure 1 shows the mature laminar profile of silver grain counts from an autoradiographic section in the monocular segment of area 17 in a P81 ferret injected with 2 mCi of [3H]proline in the contralateral eye on P71. At this age, the thalamocortical projection was mature, terminating primarily in layer IV, with a smaller component in layer VI. A faint, but continuous, projection to layer I also was observed. Silver grain density was greater in layer V than in layer II and upper layer III, where it approached background levels, but it is likely that much of the label in layer V was due to fibers of passage that terminated in layer IV and more superficially. There was an abrupt change in the density of thalamocortical input at the layer IV/V boundary, presumably due to the increased branching of thalamocortical axons within layer IV.
In cats, LGN afferents first arrive in layer IV of the visual cortex several days before birth, and the density of their arbors in layer IV greatly increases over the following month (Shatz and Luskin, 1986; Ghosh and Shatz, 1992; Antonini and Stryker 1993). In ferrets, we examined the laminar distribution of thalamocortical afferents at a series of ages during the presumed period of thalamocortical maturation, from P28 to P81, in autoradiographic sections of the monocular segment of area 17 labeled transneuronally by [3H]proline injections into the contralateral eye.
The youngest ferret kit in which cortical afferents were successfully transneuronally labeled was injected on P21 and perfused on P28. Despite the high level of blood-born radioactivity at this age, the higher density of silver grains in bands centered around layers I, IV, and VI were readily discernible in the density plot (Fig. 2). In addition, it appeared that the main band in layer IV was both less intense and less tightly restricted to the confines of the layer than that seen in mature ferrets. The most parsimonious explanation for this finding is that at this early age the afferents to layer IV are probably relatively sparsely branched and that the bulk of later branching takes place primarily within layer IV.
At P37, the laminar distribution of afferents more closely resembled the mature pattern. However, the transition between the intense labeling in layer IV and adjacent layers was less abrupt than in older animals. This finding was revealed in the silver grain density plot as a sharp peak in density centered in layer IV in contrast to the elevated plateau of density across layer IV in mature ferrets. By P50, the laminar distribution of thalamic afferents in area 17 appeared mature, qualitatively resembling that of the P63 and P81 ferrets.
LeVay et al. (1978) pointed out the presence of a prominent band of label in the upper part of layer I in visual cortex of kittens P22 and younger. We did not consistently find especially intense labeling throughout the thickness of layer I in ferrets at comparable ages, P45 and younger.
Segregation of afferents into ocular dominance bands
Autoradiographs of the binocular segment in area 17 showed a periodic modulation along layer IV in the pattern of transneuronal label both ipsilateral and contralateral to the injected eye in all but the youngest ferret kits in this study (Fig. 3). Ferrets perfused on P28 or P30 showed no evidence of ocular dominance bands in either hemisphere, even in tangentially sectioned cortical flatmounts as exemplified in Figure 4, despite a substantial level of transneuronal labeling within layer IV in the binocular segment (n = four animals). The slight modulation visible in such montages, which is of lower spatial frequency than that expected for ocular dominance bands, is not evident in adjacent sections and, thus, is most likely attributable to imperfections in unfolding and flattening the delicate P30 tissue.
Fig. 3.

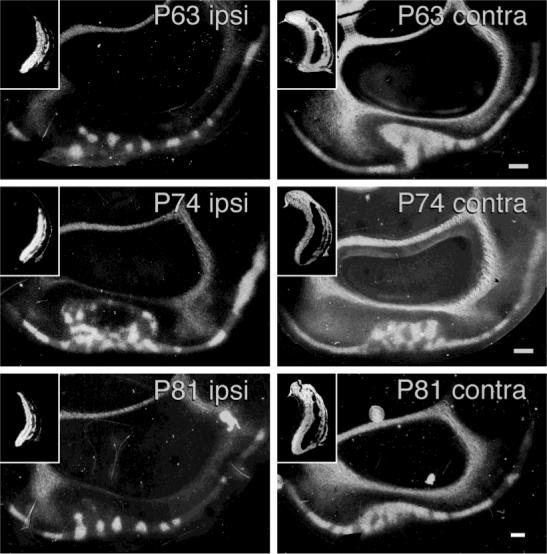
Developmental series showing ocular dominance bands in single sections. The development of ocular dominance bands is demonstrated in autoradiographic sections cut in a plane slightly off horizontal (see text) in ferret kits perfused at postnatal day (P)37, P45, P50, P56, P63, P74, and P81. For each age, hemispheres ipsilateral to the injected eye are displayed on the left and contralateral hemispheres on the right. Because of the sharp curvature of the ferret occipital cortex, this plane of section occasionally cuts nearly tangentially through part of layer IV in sections near the occipitotemporal sulcus. As early as P37, a faint modulation is detectable in both hemispheres, although it is clearer in the hemisphere ipsilateral to the injected eye. This fluctuation in labeling becomes sharper with age and appears adult-like by P63. In the medial part of most sections, there is a transition from a long contralateral eye band to a long, and slightly more radially diffuse, ipsilateral eye band near the presumed area 17/18 transition zone. Autoradiographs of parasagittal sections of the corresponding LGNs (insets) reveal normal eye-specific lamination, including occasional “bridges” in the C laminae. Lateral is left and anterior is up in cortical sections. Anterior is left and dorsal is up in thalamic sections. Scale bars = 1mm (applies to both hemispheres and to the LGNs at each age).
Fig. 4.
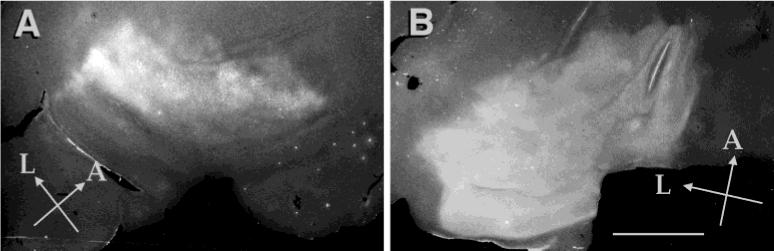
Transneuronal autoradiographic labeling in postnatal day (P)30 visual cortex. Photomontages from tangential sections of unfolded visual cortex, ipsilateral (A) and contralateral (B) to the injected eye, from a ferret injected on P23 and killed on P30. There is no obvious fluctuation resembling ocular dominance bands in the patterns in either hemisphere at this age. L, lateral; A, anterior. Scale bar = 5 mm in B (applies to A,B).
The youngest ferret in our study to exhibit a labeling pattern consistent with the emergence of ocular dominance bands was the P37 kit. In this animal, small periodic peaks in the density of silver grains along an otherwise continuous band of label in layer IV were present in the ipsilateral hemisphere (Figs. 3, 5). These peaks were unlikely to be artifactual as they aligned in serial sections dipped and developed on different days. The modulation of contralateral label was not complementary to that in the ipsilateral hemisphere at this age and was evident only in the medial portion in which large regions of contralateral input were seen in older animals (see below). The largest measured fluctuation in silver grain density along layer IV at P37 was less than 40% of the amplitude of that measured in any of the older animals. The pattern of label in the P45 ferret was qualitatively similar to that at P37, but silver grain counts were not made in this animal because it had a high background level of silver grain density.
In the P50 ferret, labeled ocular dominance bands stood out clearly against faintly labeled gaps within layer IV. Silver grain counts revealed that, much like the P37 case, there were sharp periodic peaks in the labeling density, but the peaks were now of considerably greater amplitude (Fig. 5). The segregation of ocular dominance bands was qualitatively adult-like by P63. In both hemispheres of the P63, P74, and P81 ferrets, the label from the injected eye alternated abruptly along layer IV between uniform stretches of high and low density (Fig. 3).
Spillover of radioactivity in the LGN
The uniform distribution of label in layer IV seen in the youngest cases can result either from a true absence of fluctuation in the pattern of input from each eye or from spillover of tracer between the monocular laminae of the LGN, making the transneuronal labeling pattern inaccurate as a reflection of the relative inputs from each eye to the cortex (LeVay et al., 1978). To determine the extent to which the absence of modulation in the pattern of transneuronal label at P30 could be accounted for by spillover, silver grain counts were made in 2-μm semithin sections over cell nuclei of neurons in both the labeled and unlabeled laminae of the LGNs of five animals: two P30 ferrets that showed no ocular dominance columns in cortical autoradiographs, the P37 ferret that was the youngest animal in which clear columns were detected, the P50 ferret, and the P81 ferret that had a fully mature pattern of ocular dominance columns. The results (Table 1) recapitulate the observations by LeVay et al. (1978) in cats that spillover gradually decreases with age and, particularly in the young animals, is slightly more severe in the contralateral hemisphere than in the ipsilateral hemisphere. The mean level of ipsilateral LGN spillover in the P30 ferrets (0.33) is similar to that reported in developmentally comparable P8 kittens (LeVay et al., 1978). Because spillover of radioactivity into the nonlabeled lamina of the LGN can account for less than half of the label transported transneuronally to the cortex at P30, it is likely that the absence of modulation in the cortical autoradiographs accurately reflects a lack of eye-specific afferent segregation at this age and earlier.
TABLE 1.
Spillover of Radioactivity Between Lateral Geniculate Nucleus (LGN) Laminae1
| Ratio of radioactivity in non-labeled to labeled laminae |
|||
|---|---|---|---|
| Injection age | Sacrifice age | Ipsi-LGN A/A1 | Contra-LGN A1/A |
| P23 | P30 | 0.41 (104/100) | 0.60 (78/56) |
| P22 | P30 | 0.25 (95/100) | 0.45 (100/100) |
| P30 | P37 | 0.28 (68/63) | 0.37 (103/100) |
| P43 | P50 | 0.17 (100/99) | n/a |
| P71 | P81 | 0.14 (101/100) | 0.16 (100/100) |
Ratio of the number of nuclear silver grains per nuclear area in the unlabeled lamina to that in the labeled lamina. A and A1 refer to LGN laminae, which, respectively, receive contralateral and ipsilateral eye inputs. The numbers of LGN cell nuclei over which silver grain densities were measured in the nonlabeled and labeled laminae are shown in parentheses.
Organization of ocular dominance bands in visual cortex
To explore further the shape and distribution of ocular dominance bands in the ferret, the binocular segment of primary visual cortex was fully reconstructed in seven ferrets, aged P30 to adult, in montages of the labeling in layer IV from tangential (Figs. 4, 7) or serial sections (Fig. 6). Area 17 in the flattened adult hemispheres was approximately 57.6 mm2 for the left visual cortex and 53.3 mm2 for the right visual cortex. Assuming about 20% tissue shrinkage from TMB processing (Anderson et al., 1988), this gives maximal original areas of about 72.0 and 66.3 mm2, respectively, comparable to the range (65−87.2 mm2) reported by Law and co-workers (1988). Only about one-third (17.8 and 16.8 mm2) of this is binocular cortex.
Fig. 7.

Adult pattern of ocular dominance bands. Photomontages of tetramethyl benzidine-processed flatmounts of ipsilateral (A) and contralateral (B) visual cortices, labeled transneuronally by monocular injections of wheat germ agglutinin-horseradish peroxidase. In these montages, the tendency of patchy bands in area 17 to line up into rostrocaudally running strips can be seen clearly in the medial parts of the binocular segments in both hemispheres. The arrows bracket regions where the ocular dominance bands form broad mediolateral strips. The monocular segment occupies the caudal two-thirds of area 17. Left is lateral and up is anterior. Scale bar = 1 mm in B (applies to A,B).
Fig. 6.

Pattern of ocular dominance bands during development. Photomontages of the binocular part of visual cortex from aligned serial autoradiographic sections reveal the overall pattern of ocular dominance bands in ferret visual cortex. Within caudal area 17, eye-specific labeling has a patchy, banded appearance, reminiscent of cat ocular dominance bands, but more strongly contralaterally biased. Near the presumed transition zone between areas 17 and 18, this pattern is interrupted by broad monocular strips that run approximately mediolaterally. This pattern is especially evident in the medial parts of the reconstructions and is present at all ages when ocular dominance bands are detectable. There appears to be a progressive expansion of the ipsilateral eye bands in the caudal part of area 17 from postnatal day (P)50 to P63. Left is lateral and up is anterior. Scale bar = 1 mm.
The unfolded adult cortex displayed a pattern of ocular dominance bands in the binocular part of area 17 that partially fused to form patchy stripes tending to run perpendicular to the area 17/18 border (Fig. 7). This pattern was corroborated by the montages of serial sections in ferret kits (Fig. 6). In agreement with earlier studies (Law et al., 1988; Redies et al., 1990), the representation of the contralateral eye occupied more territory than did the ipsilateral eye in the binocular segment of area 17. Previous investigators have described a difference between the shapes of the bands representing the contralateral eye and the ipsilateral eye in ferret visual cortex. Law et al. (1988) observed thick contralateral eye stripes and thin ipsilateral eye stripes. Redies et al. (1990) reported ipsilateral eye islands in a sea of contralateral eye stripes. In our reconstructions, these two configurations tended to occur in different regions: stripe-like patterns predominated in the medial region and discrete ipsilateral eye patches were most evident in the lateral portion of area 17, near the representation of area centralis. Interestingly, in reconstructions of the P50 and P56 kits, there appeared to be a stronger tendency than in older animals for ipsilateral eye inputs to form small, isolated patches or thin stripes that were intensely labeled (Figs. 6, 7). Such ipsilateral islands of high-density label were not seen in the P37 and P45 cases, in which the intensity of densest labeling only barely exceeded that of the intervening regions (Fig. 5). This finding suggests that patches of ipsilateral eye inputs in the ferret may form by the elaboration of high-density input outward from the centers of nascent columns rather than by retraction of uniformly high-density afferents from inappropriate territory. Reconstructions in mature animals, P63, P81 (data not shown), and adult, looked very similar to those of Redies et al. (1990; their Fig. 6) from a pair of adult ferrets.
In addition to the patchy, banded ocular dominance bands described above, a striking discontinuity in the pattern of ocular dominance bands was observed consistently in the rostral portion of visual cortex near the presumptive border between area 17 and area 18 (Figs. 6, 7). In this rostral region, the regularly alternating pattern of contralateral and ipsilateral bands seen in more caudal regions of the binocular segment of area 17 merged into nearly uninterrupted, broad strips of monocular input that ran nearly perpendicularly to the orientation of the caudal bands. Here, patches of input serving the contralateral eye became fused at many points along a mediolateral axis, rostral to which were large and sometimes fused patches of ipsilateral input. The intensity of labeling in these strips was particularly intense medially in sections from the hemispheres ipsilateral to the injected eye (Fig. 3).
DISCUSSION
Laminar development of the thalamocortical projection
The laminar distribution of transneuronal label in area 17 of the mature (P81) ferret is very similar to that reported in an adult cat by LeVay et al. (1978), although we saw in all ferrets P50 and older a more uniform density of label throughout the depth of layer IV than was reported in this adult cat. These authors also performed a laminar count of silver grains in a transneuronally labeled P8 kitten and found that the main band of layer IV label was both smaller in amplitude and less neatly contained within the boundaries of layer IV than in the adult. We have replicated this finding in the P28 ferret, which is approximately the equivalent developmental age, and extended it to intermediate ages, where we observed that the mature laminar distribution is achieved around P50.
This result is consistent with the time course of afferent axon ingrowth reported for cat visual cortex. Synapse number in the visual cortex of the kitten peaks during approximately the fifth postnatal week (equivalent to P49 to P56 in the ferret) (Cragg, 1975). Moreover, individual thalamocortical arbors in the cat have been demonstrated to increase their mean axonal arbor density by about 70% (accompanied by less than a 10% decrease in coverage area) between P23 and P30 (equivalent to P44 and P51 in the ferret) and then do not increase density further between P30 and P39 (Antonini and Stryker, 1993).
The sharp peak in silver grain density in the center of layer IV seen at P37, in contrast to the even plateau of labeling across layer IV observed in older animals, is also notable. The initial peaked distribution suggests that the ingrowing thalamocortical axons arborize first within a restricted sublamina of layer IV either because of a peak in the concentration of some branch-inducing factor (Yamamoto et al., 1997) or because they are actively inhibited from branching in the rest of layer IV. The filling out of this distribution to a plateau supports the notion that some resource (such as “synaptic space” or a trophic factor) that is available uniformly but exclusively in layer IV supports the continued growth of thalamocortical afferents within layer IV (von der Malsburg, 1973; Miller, 1996).
Emergence of ocular dominance bands
Segregation of ocular dominance bands in the ferret is first evident at P37, and appears fully mature by P63. This time course is in accord with the recent report by Finney and Shatz (1998) and is similar to that reported for the cat in which the geniculocortical afferents subserving the two eyes have a uniform, noncolumnar arrangement in layer IV as late as P15 (approximately the developmental equivalent of a P36 ferret), but have clearly begun to segregate before P22 (P43 ferret) and have a modulation basically similar to the adult by approximately P39 (P60 ferret) (LeVay et al., 1978). The actual emergence of ocular dominance bands, however, may be slightly earlier than observed, as a number of factors can impede the detection of ocular dominance bands labeled transneuronally in young animals.
Sources of artifact
Silver grains in autoradiographs of cortical sections originate from three sources: (1) transneuronally labeled afferents from corticopetal nuclei, primarily the LGN; (2) blood-born tritium initially taken up at the retina; and (3) emulsion background, resulting from ambient radioactivity or trace chemical contamination of the emulsion. Measurements of the contribution of emulsion background, made by counting silver grains on the microscope slide far from the tissue section, indicated that its contribution was insignificant, at least two orders of magnitude less than that of neuronally transported label. In ferrets older than P50, blood-born radioactivity, as measured by counting silver grains in non-visual cortical areas, was responsible for less than one-tenth of the total signal. However, in younger kits there was considerable contribution of blood-born radioactivity to the total number of silver grains in area 17. In the P28 and P30 animals, the blood-born radioactivity was greater than that transported neuronally.
As a consequence of both the increase in background and the greater relative contribution of false positive signal due to spillover, the transneuronal autoradiographic method is compromised in younger animals. These artifacts could potentially have obscured a modulation in the ARG pattern in the P28−P30 animals. Our measurements of spillover, however, indicate that it could account for less than half of the transneuronal signal in the ipsilateral cortical hemisphere at P30, and a smaller fraction in older animals. It is therefore unlikely to have substantially prevented detection of a mature modulation in the cortical innervation, especially in montages of layer IV from tangential sections of flattened cortex, in which ocular dominance bands are particularly conspicuous. Indeed, the degree of spillover measured by Le Vay et al. (1978) in the contralateral hemisphere of a P92 cat, in which ocular dominance bands were clearly evident, was more severe than that in the P30 ferrets in this study. Nonetheless the possibility remains that a faint modulation might be present at this age, beyond the detection threshold for the transneuronal autoradiographic method. Recent physiologic experiments suggest that in the cat, cortical responses indeed may be segregated into eye-specific patches at an age earlier than such patches have been demonstrated anatomically (Crair et al., 1998).
On the other hand, the consistent, pronounced fluctuation in the pattern of label in the P37 hemisphere ipsilateral to the injected eye is compelling evidence for segregated inputs to ocular dominance columns by this age. Assuming that development of the visual system proceeds from conception at approximately the same rate as the cat (Linden et al., 1981), the P37 ferret is equivalent to a P16 kitten, just slightly older than the P15 kitten for which LeVay et al. (1978) failed to detect ocular dominance columns. This species difference may be more apparent than real because a close examination of the published section from the P15 kitten studied by LeVay and colleagues suggests that periodically fluctuating label might have been evident had it been prepared as a flattened preparation or had a photomontage of serial sections been constructed.
Contralateral bias of nascent ocular dominance columns
We have interpreted the narrow peaks of ipsilateral label at P50 and P56 to reflect an intermediate step in the formation of ocular dominance columns in the ferret. Although these narrow peaks resemble the unbalanced pattern of ocular dominance bands in monocularly deprived kittens (Shatz and Stryker, 1978), the fact that the opposite hemispheres also appear to be dominated by contralateral eye inputs, particularly at P50, makes it unlikely that the peaks in these animals were the effect of monocular deprivation. Hypopigmentation is associated with a decrease the proportion of ipsilateral retinal input to the LGN (reflected in an altered lamination pattern) and consequently to the cortex (Guillery, 1969; Kaas and Guillery, 1973; Shatz, 1977; Creel et al., 1982; Cucchiaro and Guillery, 1984; Leventhal and Creel, 1985; Ault et al., 1995; but see Thompson et al., 1991). Differences in pigmentation are also unlikely to explain the greater contralateral bias the P50 and P56 cases because there were no obvious differences between the geniculate lamination in these ferrets compared with the others in this study (Fig. 3). In addition, all the ferret kits between the ages of P37 and P81 in this study were littermates, considerably reducing the potential influence of genetic variability on differences in the pattern of ocular dominance columns.
Physiologic recordings by numerous groups also have demonstrated a strong contralateral bias of neurons in area 17 of kittens less than three weeks of age (LeVay et al., 1978; Fregnac and Imbert, 1978; Albus and Wolf, 1984; Crair et al., 1998). It therefore should not be surprising that a greater than normal contralateral bias might still be present in early stages of columnar development.
The above observations are consistent with a model in which ocular dominance bands segregate from an initially widespread and sparse distribution of geniculocortical axons, which on average favors the contralateral eye at most sites. During the normal course of ocular dominance column formation, inputs from the ipsilateral eye gain narrow footholds that become the centers of future ipsilateral eye columns. As the thalamocortical axons compete for cortical territory by adding new branches, ipsilateral eye afferents are only able to compete effectively against the dominant contralateral eye inputs at sites adjacent to those at which the ipsilateral eye is already strongly represented.
Developmental stages of segregation
In summary, the segregation of inputs serving the two eyes appears to have four stages in normal development (Fig. 8). In the four youngest animals studied at P28−30, no segregation was detectable. In the two animals studied at P37 and P45, a definite but faint periodicity in the ipsilateral labeling suggested that segregation of nascent ocular dominance columns had begun. In the two animals studied at P50 and P56, very densely labeled ipsilateral bands were present, but they were peaked and narrower than the bands seen in older animals. Contralateral labeling was consistent with the ipsilateral labeling in the P50 case, but less so in the P56 case, suggesting a transition to the mature state. At P63, P74, and P81, labeling on both sides of the brain was indistinguishable from that in the two adult animals prepared in flattened section, and the ipsilateral patches had broad flat peaks different from the sharp ones in the earlier group.
Fig. 8.
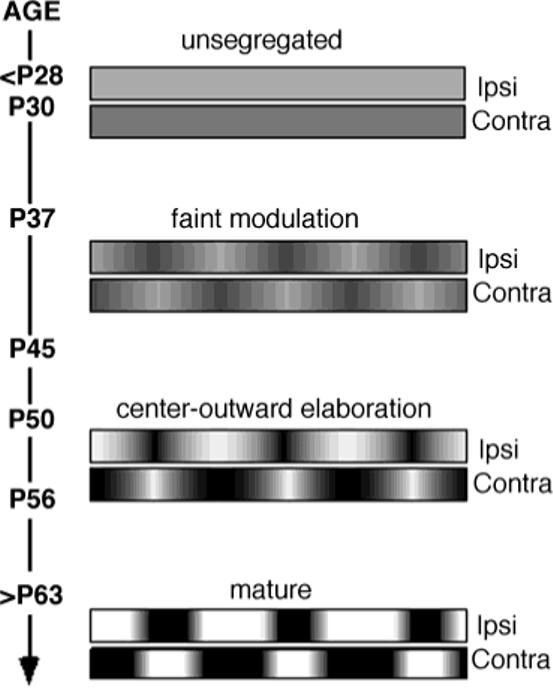
Time course of ocular dominance band development. The ages of individual ferret kits in this study and the four stages of segregation apparent from their transneuronal labeling are schematically represented. Inputs representing both eyes initially occupy the entire binocular segment of area 17 with no detectable modulation in their patterns. At postnatal day (P)37 and P45, a faint modulation is evident. By P50 and P56, the amplitude of modulation has increased greatly, but peaks only at column centers. In P63 and older kits, the pattern of ocular dominance bands is mature, with a square wave-like pattern of alternating intense ipsilateral and contralateral eye inputs.
Pattern of ocular dominance bands in visual cortex
Although the basic structure of ocular dominance bands in ferrets is patchy and banded resembling those in the cat, there is a greater tendency in the ferret, especially in the medial part of area 17 far from the representation of the area centralis, for these bands to run perpendicularly to the area 17/18 border (compare Anderson et al., 1988), as they do in the monkey. The binocular segment of the ferret visual cortex is highly anisotropic, being about 3.6 times longer along the axis of the vertical meridian than along the axis of the horizontal meridian, whereas the binocular representation in the ferret LGN has an anisotropy of only about 2:1 along these axes (Zahs and Stryker, 1985). Thus, as in the monkey, the anisotropy of the binocular segment of area 17 in the ferret is nearly twice as great as that in the LGN. Models developed for the monkey thus predict this alignment of ocular dominance bands in the ferret (LeVay et al., 1985; Jones et al., 1991).
The regular alternating pattern of ocular dominance bands is interrupted in the rostral part of visual cortex in the ferret. Although we are the first to comment on these unusual ocular dominance bands, they are in fact present in both the earlier published reconstructions of adult ferret visual cortex (Fig. 15 of Law et al., 1988; Fig. 6 of Redies et al., 1990), as well as in the reconstruction from serial parasagittal sections of the ocular dominance bands in the mink, a closely related mustelid (Fig. 12 of McConnell and LeVay, 1986). In addition, the unusual bands have recently been shown by optical imaging in a preliminary report by Fitzpatrick and co-workers, who showed a corresponding distortion of the visuotopic map in the same region (White et al., 1997). In contrast, the patchy pattern of ocular dominance bands in the cat is uninterrupted at the area 17/18 border (Anderson et al., 1988). To our knowledge, the only non-mustelid species in which a similar interruption in the organization of the thalamocortical projection has been demonstrated anatomically to be the normal projection pattern is the sheep, which has an atypically extensive ipsilateral hemifield representation (Pettigrew et al., 1984).
In hypopigmented ferrets and cats, such as Siamese and tyrosinase-negative albino strains, there is a misrouting of temporal retinal ganglion cell axons, which leads to a larger proportion crossing the chiasm and projecting contralaterally, and consequently a larger representation of the ipsilateral visual hemifield (Guillery, 1969; Guillery, 1971; Kaas and Guillery, 1973; Shatz, 1977; Creel et al., 1982; Leventhal and Creel, 1985; Morgan et al., 1987). In the “Boston” variety of Siamese cat, the expanded cortical transition zone receives LGN input primarily from the LGN laminae that are innervated by the misrouted projection from the contralateral temporal retina (Kaas and Guillery, 1973; Shatz and LeVay, 1979) Thus, an interruption similar to that in the ferret, only relatively larger, would be expected in the transneuronal labeling pattern in “Boston” Siamese cats.
This raises a possible explanation for the interruption in the ocular dominance pattern in ferrets. Ferrets also have a relatively large representation of the ipsilateral visual field near the border between area 17 and area 18 (Law et al., 1988). It is possible that the presence of a large set of ipsilateral visual field inputs, which by analogy to hypopigmented animals should receive their inputs from the contralateral retina, might take the form of a strip of contralateral eye dominated territory within the transition zone between area 17 and area 18. Thus, as ocular dominance bands segregate, they would be forced to organize around a pre-existing block of exclusively contralateral inputs to avoid further disrupting orderly visuotopy. In support of this idea, in the inferior visual hemifield, represented in the anteromedial part of area 17 where the interruption in the ocular dominance band pattern is especially prominent, nearly all ipsilateral field responses are indeed driven through the contralateral eye in ferrets (Law et al., 1988).
Determinants of ocular dominance column positions
The physical segregation of thalamocortical afferents into ocular dominance bands may constitute a relatively late stage in the functional development of ocular dominance columns. Moreover, the location of ocular dominance column centers may be constrained by even earlier developmental events. In the cat, ocular dominance columns tend strongly to be centered near orientation pinwheels (Crair et al., 1997). In ferret visual cortex, orientation columns are first detectable by optical imaging between P31 and P36 (Chapman et al., 1996), around the time of onset of ocular dominance band segregation between P30 and P37, but the anatomical and functional clustering of long-range horizontal connections in ferret visual cortex, which correlates with the pattern of orientation columns in adult animals, begins as early as P27 (Weliky et al., 1995; Dalva and Katz, 1994; Durak and Katz, 1996; Ruthazer and Stryker, 1996). Thus the anatomical segregation of thalamocortical afferents into ocular dominance bands may represent the consolidation of a developmental program, the basic outcome of which is determined by events that occur considerably earlier in development. The findings that the pattern of ocular dominance bands consistently differs between caudal and rostral regions within visual cortex and that ipsilateral eye ocular dominance bands in ferret appear to emerge from an initially contralaterally dominated pattern both suggest that mechanisms other than pure Hebbian competition contribute to determining the layout of ocular dominance bands.
ACKNOWLEDGMENTS
M.P.S. was supported by a grant from the National Institutes of Health, E.S.R. was supported by a training grant from the National Institutes of Health, and G.E.B. was supported by a Kleberg Fellow during the conduct of this research. We thank Sheri Harris for expert technical support on this project.
Grant sponsor: National Institutes of Health; Grant number: EY02874; Grant number: EY07120.
LITERATURE CITED
- Albus K, Wolf W. Early post-natal development of neuronal function in the kitten's visual cortex: a laminar analysis. J Physiol. 1984;348:153–185. doi: 10.1113/jphysiol.1984.sp015104. [DOI] [PMC free article] [PubMed] [Google Scholar]
- Anderson PA, Olavarria J, Van Sluyters RC. The overall pattern of ocular dominance bands in cat visual cortex. J Neurosci. 1988;8:2183–2200. doi: 10.1523/JNEUROSCI.08-06-02183.1988. [DOI] [PMC free article] [PubMed] [Google Scholar]
- Antonini A, Stryker MP. Development of individual geniculocortical arbors in cat striate cortex and effects of binocular impulse blockade. J Neurosci. 1993;13:3549–3573. doi: 10.1523/JNEUROSCI.13-08-03549.1993. [DOI] [PMC free article] [PubMed] [Google Scholar]
- Ault SJ, Leventhal AG, Vitek DJ, Creel DJ. Abnormal ipsilateral visual field representation in areas 17 and 18 of hypopigmented cats. J Comp Neurol. 1995;354:181–192. doi: 10.1002/cne.903540203. [DOI] [PubMed] [Google Scholar]
- Baker GE, Thompson ID, Krug K, Smyth D, Tolhurst DJ. Spatial-frequency tuning and geniculocortical projections in the visual cortex (areas 17 and 18) of the pigmented ferret. Eur J Neurosci. 1998;10:2657–2668. doi: 10.1046/j.1460-9568.1998.00276.x. [DOI] [PubMed] [Google Scholar]
- Bear MF, Kleinschmidt A, Gu QA, Singer W. Disruption of experience-dependent synaptic modifications in striate cortex by infusion of an NMDA receptor antagonist. J Neurosci. 1990;10:909–925. doi: 10.1523/JNEUROSCI.10-03-00909.1990. [DOI] [PMC free article] [PubMed] [Google Scholar]
- Chapman B, Stryker MP, Bonhoeffer T. Development of orientation preference maps in ferret primary visual cortex. J Neurosci. 1996:16. doi: 10.1523/JNEUROSCI.16-20-06443.1996. [DOI] [PMC free article] [PubMed] [Google Scholar]
- Cragg BG. The development of synapses in the visual cortex of the cat. J Comp Neurol. 1975;160:147–166. doi: 10.1002/cne.901600202. [DOI] [PubMed] [Google Scholar]
- Crair MC, Ruthazer ES, Gillespie DC, Stryker MP. Ocular dominance peaks at pinwheel center singularities of the orientation map in cat visual cortex. J Neurophysiol. 1997;77:3381–3385. doi: 10.1152/jn.1997.77.6.3381. [DOI] [PubMed] [Google Scholar]
- Crair MC, Gillespie DC, Stryker MP. The role of visual experience in the development of columns in cat visual cortex. Science. 1998;279:566–570. doi: 10.1126/science.279.5350.566. [DOI] [PMC free article] [PubMed] [Google Scholar]
- Creel D, Hendrickson AE, Leventhal AG. Retinal projections in tyrosinase-negative albino cats. J Neurosci. 1982;2:907–911. doi: 10.1523/JNEUROSCI.02-07-00907.1982. [DOI] [PMC free article] [PubMed] [Google Scholar]
- Cucchiaro J, Guillery RW. The development of the retinogeniculate pathways in normal and albino ferrets. Proc R Soc Lond B. 1984;223:141–164. doi: 10.1098/rspb.1984.0087. [DOI] [PubMed] [Google Scholar]
- Dalva MB, Katz LC. Rearrangements of synaptic connections in visual cortex revealed by laser photostimulation. Science. 1994;265:255–258. doi: 10.1126/science.7912852. [DOI] [PubMed] [Google Scholar]
- Durack JC, Katz LC. Development of horizontal projections in layer 2/3 of ferret visual cortex. Cereb Cortex. 1996;6:178–183. doi: 10.1093/cercor/6.2.178. [DOI] [PubMed] [Google Scholar]
- Finney EM, Shatz CJ. Establishment of patterned thalamocortical connections does not require nitric oxide synthase. J Neurosci. 1998;18:8826–8838. doi: 10.1523/JNEUROSCI.18-21-08826.1998. [DOI] [PMC free article] [PubMed] [Google Scholar]
- Fregnac Y, Imbert M. Early development of visual cortical cells in normal and dark-reared kittens: relationship between orientation selectivity and ocular dominance. J Physiol. 1978;278:27–44. doi: 10.1113/jphysiol.1978.sp012290. [DOI] [PMC free article] [PubMed] [Google Scholar]
- Ghosh A, Shatz CJ. Pathfinding and target selection by developing geniculocortical axons. J Neurosci. 1992;12:39–55. doi: 10.1523/JNEUROSCI.12-01-00039.1992. [DOI] [PMC free article] [PubMed] [Google Scholar]
- Guillery RW. An abnormal retinogeniculate projection in Siamese cats. Brain Res. 1969;14:739–741. doi: 10.1016/0006-8993(69)90213-3. [DOI] [PubMed] [Google Scholar]
- Hata Y, Stryker MP. Control of thalamocortical afferent rearrangement by postsynaptic activity in developing visual cortex. Science. 1994;265:1732–1735. doi: 10.1126/science.8085163. [DOI] [PubMed] [Google Scholar]
- Hubel DH, Wiesel TN. Laminar and columnar distribution of geniculocortical fibers in macaque monkey. J Comp Neurol. 1972;146:421–450. doi: 10.1002/cne.901460402. [DOI] [PubMed] [Google Scholar]
- Jackson CA, Peduzzi JD, Hickey TL. Visual cortex development in the ferret. I. Genesis and migration of visual cortical neurons. J Neurosci. 1989;9:1242–1253. doi: 10.1523/JNEUROSCI.09-04-01242.1989. [DOI] [PMC free article] [PubMed] [Google Scholar]
- Jones DG, Van Sluyters RC, Murphy KM. A computational model for the overall pattern of ocular dominance. J Neurosci. 1991;11:3794–3808. doi: 10.1523/JNEUROSCI.11-12-03794.1991. [DOI] [PMC free article] [PubMed] [Google Scholar]
- Kaas JH, Guillery RW. The transfer of abnormal visual field representations from the dorsal lateral geniculate nucleus to the visual cortex in Siamese cats. Brain Res. 1973;59:61–95. doi: 10.1016/0006-8993(73)90253-9. [DOI] [PubMed] [Google Scholar]
- Law MI, Zahs KR, Stryker MP. Organization of primary visual cortex (area 17) in the ferret. J Comp Neurol. 1988;278:157–180. doi: 10.1002/cne.902780202. [DOI] [PubMed] [Google Scholar]
- LeVay S, Stryker MP, Shatz CJ. Ocular dominance columns and their development in layer IV of the cat's visual cortex: a quantitative study. J Comp Neurol. 1978;179:223–244. doi: 10.1002/cne.901790113. [DOI] [PubMed] [Google Scholar]
- LeVay S, Connolly M, Houde J, Van Essen DC. The complete pattern of ocular dominance stripes in the striate cortex and visual field of the macaque monkey. J Neurosci. 1985;5:486–501. doi: 10.1523/JNEUROSCI.05-02-00486.1985. [DOI] [PMC free article] [PubMed] [Google Scholar]
- Leventhal AG, Creel DJ. Retinal projections and functional architecture of cortical areas 17 and 18 in the tyrosinase-negative albino cat. J Neurosci. 1985;5:795–807. doi: 10.1523/JNEUROSCI.05-03-00795.1985. [DOI] [PMC free article] [PubMed] [Google Scholar]
- Linden DC, Guillery RW, Cucchiaro J. The dorsal lateral geniculate nucleus of the normal ferret and its postnatal development. J Comp Neurol. 1981;203:189–211. doi: 10.1002/cne.902030204. [DOI] [PubMed] [Google Scholar]
- McConnell SK, LeVay S. Anatomical organization of the visual system of the mink, Mustela vison. J Comp Neurol. 1986;250:109–132. doi: 10.1002/cne.902500110. [DOI] [PubMed] [Google Scholar]
- Miller KD. Synaptic economics: competition and cooperation in synaptic plasticity. Neuron. 1996;17:371–374. doi: 10.1016/s0896-6273(00)80169-5. [DOI] [PubMed] [Google Scholar]
- Miller KD, Stryker MP. The development of ocular dominance columns: mechanisms and models. In: Hanson SJ, Olson CR, editors. Connectionist modeling and brain function: the developing interface. MIT Press; Cambridge, MA: 1990. [Google Scholar]
- Pettigrew JD, Ramachandran VS, Bravo H. Some neural connections subserving binocular vision in ungulates. Brain Behav Evol. 1984;24:65–93. doi: 10.1159/000121306. [DOI] [PubMed] [Google Scholar]
- Rao SC, Toth LJ, Sur M. Optically imaged maps of orientation preference in primary visual cortex of cats and ferrets. J Comp Neurol. 1997;387:358–370. doi: 10.1002/(sici)1096-9861(19971027)387:3<358::aid-cne3>3.3.co;2-v. [DOI] [PubMed] [Google Scholar]
- Redies C, Diksic M, Rimi H. Functional organization in the ferret visual cortex: a double-label 2-deoxyglucose study. J Neurosci. 1990;10:2791–2803. doi: 10.1523/JNEUROSCI.10-08-02791.1990. [DOI] [PMC free article] [PubMed] [Google Scholar]
- Reiter HO, Stryker MP. Neural plasticity without postsynaptic action potentials: less-active inputs become dominant when kitten visual cortical cells are pharmacologically inhibited. Proc Natl Acad Sci USA. 1988;85:3623–3627. doi: 10.1073/pnas.85.10.3623. [DOI] [PMC free article] [PubMed] [Google Scholar]
- Rockland KS. Anatomical organization of primary visual cortex (area 17) in the ferret. J Comp Neurol. 1985;241:225–236. doi: 10.1002/cne.902410209. [DOI] [PubMed] [Google Scholar]
- Ruthazer ES, Stryker MP. The role of activity in the development of long-range horizontal connections in area 17 of the ferret. J Neurosci. 1996;16:7253–7269. doi: 10.1523/JNEUROSCI.16-22-07253.1996. [DOI] [PMC free article] [PubMed] [Google Scholar]
- Ruthazer ES, Baker GE, Stryker MP. Development and pattern of ocular dominance columns in ferret visual cortex. Soc Neurosci Abstr. 1995:21. [Google Scholar]
- Shatz C. A comparison of visual pathways in Boston and Midwestern Siamese cats. J Comp Neurol. 1977;171:205–228. doi: 10.1002/cne.901710206. [DOI] [PubMed] [Google Scholar]
- Shatz CJ, LeVay S. Siamese cat: altered connections of visual cortex. Science. 1979;204:328–330. doi: 10.1126/science.432647. [DOI] [PubMed] [Google Scholar]
- Shatz CJ, Luskin MB. The relationship between the geniculocortical afferents and their cortical target cells during development of the cat's primary visual cortex. J Neurosci. 1986;6:3655–3668. doi: 10.1523/JNEUROSCI.06-12-03655.1986. [DOI] [PMC free article] [PubMed] [Google Scholar]
- Shatz CJ, Stryker MP. Ocular dominance in layer IV of the cat's visual cortex and the effects of monocular deprivation. J Physiol. 1978;281:267–283. doi: 10.1113/jphysiol.1978.sp012421. [DOI] [PMC free article] [PubMed] [Google Scholar]
- Shatz CJ, Lindstrom S, Wiesel TN. The distribution of afferents representing the right and left eyes in the cat's visual cortex. Brain Res. 1977;131:103–116. doi: 10.1016/0006-8993(77)90031-2. [DOI] [PubMed] [Google Scholar]
- Stent GS. A physiological mechanism for Hebb's postulate of learning. Proc Natl Acad Sci USA. 1973;70:997–1001. doi: 10.1073/pnas.70.4.997. [DOI] [PMC free article] [PubMed] [Google Scholar]
- Stryker MP, Harris WA. Binocular impulse blockade prevents the formation of ocular dominance columns in cat visual cortex. J Neurosci. 1986;6:2117–2133. doi: 10.1523/JNEUROSCI.06-08-02117.1986. [DOI] [PMC free article] [PubMed] [Google Scholar]
- Stryker MP, Strickland SL. Physiological segregation of ocular dominance columns depends on the pattern of afferent electrical activity. Invest Opthalmol Suppl. 1984;25:278. [Google Scholar]
- Thompson ID, Jeffery G, Morgan JE, Baker G. Albino gene dosage and retinal decussation patterns in the pigmented ferret. Vis Neurosci. 1991;6:393–398. doi: 10.1017/s0952523800006623. [DOI] [PubMed] [Google Scholar]
- Vitek DJ, Schall JD, Leventhal AG. Morphology, central projections, and dendritic field orientation of retinal ganglion cells in the ferret. J Comp Neurol. 1985;241:1–11. doi: 10.1002/cne.902410102. [DOI] [PubMed] [Google Scholar]
- von der Malsburg C. A mechanism for producing continuous neural mappings: ocularity dominance stripes and ordered retino-tectal projections. Exp Brain Res Suppl. 1973;1:463–469. [Google Scholar]
- Weliky M, Kandler K, Fitzpatrick D, Katz LC. Patterns of excitation and inhibition evoked by horizontal connections in visual cortex share a common relationship to orientation columns. Neuron. 1995;15:541–552. doi: 10.1016/0896-6273(95)90143-4. [DOI] [PubMed] [Google Scholar]
- Weliky M, Bosking WH, Fitzpatrick D. A systematic map of direction preference in primary visual cortex. Nature. 1996;379:725–728. doi: 10.1038/379725a0. [DOI] [PubMed] [Google Scholar]
- White LE, Williams SM, Bosking WH, Richards A, Purves D, Fitzpatrick D. Organization of ocular dominance and orientation preference in areas V1 and V2 of the ferret. Soc Neurosci Abstr. 1997;23:1668. [Google Scholar]
- Wiesel TN, Hubel DH, Lam DM. Autoradiographic demonstration of ocular-dominance columns in the monkey striate cortex by means of transneuronal transport. Brain Res. 1974;79:273–279. doi: 10.1016/0006-8993(74)90416-8. [DOI] [PubMed] [Google Scholar]
- Yamamoto N, Higashi S, Toyama K. Stop and branch behaviors of geniculocortical axons: a time-lapse study in organotypic cocultures. J Neurosci. 1997;17:3653–3663. doi: 10.1523/JNEUROSCI.17-10-03653.1997. [DOI] [PMC free article] [PubMed] [Google Scholar]
- Zahs KR, Stryker MP. The projection of the visual field onto the lateral geniculate nucleus of the ferret. J Comp Neurol. 1985;241:210–224. doi: 10.1002/cne.902410208. [DOI] [PubMed] [Google Scholar]
- Zahs KR, Stryker MP. Segregation of ON and OFF afferents to ferret visual cortex. J Neurophysiol. 1988;59:1410–1429. doi: 10.1152/jn.1988.59.5.1410. [DOI] [PubMed] [Google Scholar]