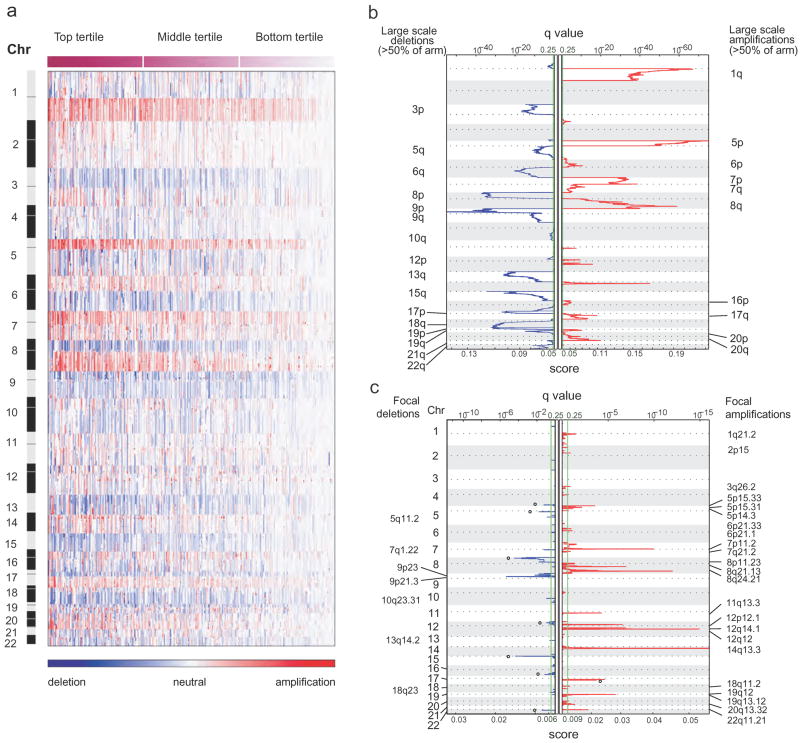
Figure 1. Large-scale genomic events in lung adenocarcinoma.
a, Smoothed copy number data for 371 lung adenocarcinoma samples (columns; ordered by degree of interchromosomal variation and divided into top, middle and bottom tertiles) is shown by genomic location (rows). The colour scale ranges from blue (deletion) through white (neutral; two copies in diploid specimens) to red (amplification). b, c, False discovery rates (q values; green line is 0.25 cut-off for significance) and scores for each alteration (x axis) are plotted at each genome position (y axis); dotted lines indicate the centromeres. Amplifications (red lines) and deletions (blue lines) are shown for large-scale events (b; ≥50% of a chromosome arm; copy number threshold = 2.14 and 1.87) and focal events (c; copy number threshold = 3.6 and 1.2). Open circles label known or presumed germline copy-number polymorphisms.

