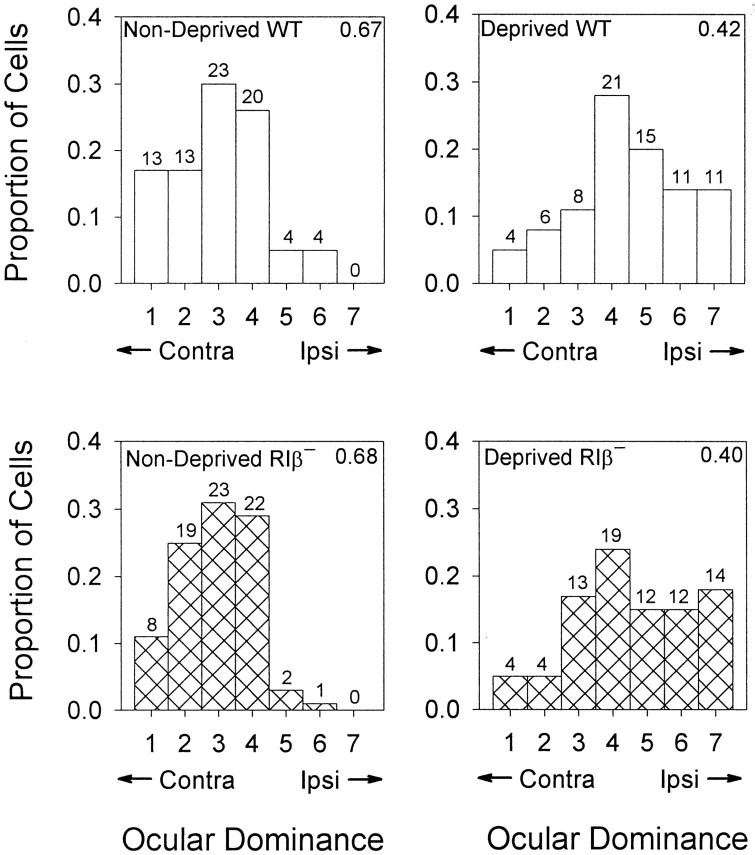
Fig. 7.
Loss of deprived-eye responses after monocular deprivation in PKA RIβ− mice. Ocular dominance distributions were recorded blind to genotype from the binocular zone of two nondeprived adults each (left panels) of wild-type (hollow bars; n = 77 cells) and RIβ− mice (hatched bars;n = 75 cells). Both distributions shifted significantly and similarly (right panels) in response to monocular deprivation of the contralateral eye for 4 d beginning at P25–27 (n = 76 and 78 cells from 3 mice each, WT and RIβ−, respectively). Numbers of cells are indicated above each bar, and contralateral bias indices are shown in the top right-hand corner of each graph.

