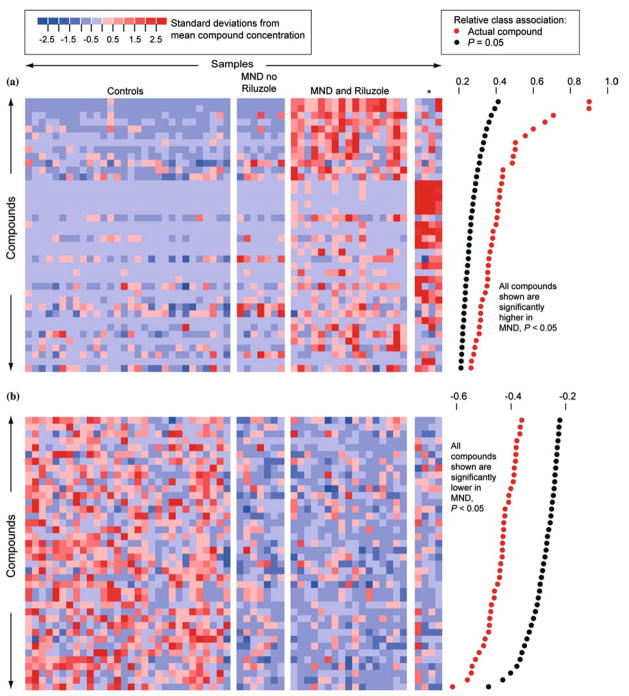
Figure 2.
Metabolites with significantly different concentrations in normal and MND plasmas in study 1. (a) Metabolites higher in MND patients than in controls. Each row represents a metabolite, each column represents a healthy control or a patient, and each colored square represents the relative concentration of a single metabolite in a single person. Compounds are sorted by decreasing association with MND. Significant association measures at p = 0.05 are indicated by black dots at the right. The association measures for the actual data are indicated by red dots. A metabolite is significantly associated with MND if its relative class association (indicated by the red dot) is > than the relative class association in 95% of the randomly permuted replicates (indicated by the black dot). The metabolites that are high in MND define three subgroups. These consist of patients not taking Riluzole, patients taking Riluzole, and four patients with a distinctive signature (indicated by an asterisk). Three of these patients had LMN disease. Supporting figure 1 provides identifiers for metabolite peaks and study participants. (b) Metabolites lower in MND patients. Supporting figure 2 provides identifiers for metabolite peaks and study participants.

