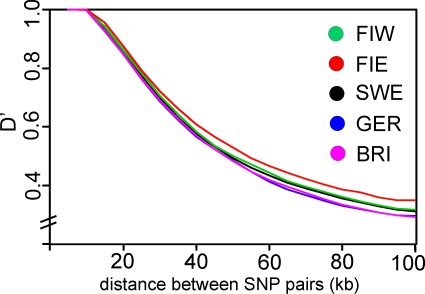
Figure 7. Linkage disequilibrium as a function of distance between marker pairs.
Median D' in overlapping 10 kb windows at 5 kb intervals is plotted for each population. All differences were significant (p<6.2×10⁻¹⁰), except between Germany and Great Britain. Abbreviations as in Figure 1.

