

Abstract
The aim of this study was to elucidate physiological processes that are involved in the homeostatic regulation of REM sleep. Adult rats were chronically instrumented with sleep–wake recording electrodes. Following post-surgical recovery, rats were habituated extensively for freely moving polygraphic recording conditions. On the first experimental recording day (baseline day, BLD), polygraphic signs of undisturbed sleep–wake activities were recorded for 4 h (between 11:00 AM and 3:00 PM). During the second experimental recording day (REM sleep deprivation day, RDD), rats were selectively deprived of REM sleep for the first 2 h and then allowed to have normal sleep–wake for the following 2 h. The results demonstrated that during the first 2 h, compared to BLD, RDD recordings exhibited 87.80% less time in REM sleep and 16% more time in non-REM (NREM) sleep. The total percentages of wakefulness remained comparable between the BLD and RDD. During the RDD, the mean number of REM sleep episodes was much higher than in the BLD, indicating increased REM sleep drive. Electroencephalographic (EEG) power spectral analysis revealed that selective REM sleep deprivation increased delta power but decreased theta power during the residual REM sleep. During the last 2 h, after REM sleep deprivation, rats spent 51% more time in REM sleep compared to the BLD. Also during this period, the number of REM sleep episodes with the shortest (5–30 s) and longest (>120 s) duration increased during the RDD. These findings suggest that the REM sleep homeostatic process involves increased delta- and decreased theta-frequency wave activities in the cortical EEG.
Keywords: Homeostasis, REM sleep, Power spectrum, REM sleep deprivation, Slow-wave activity
1. Introduction
A wide range of behavioral studies have provided considerable evidence supporting the idea that the regulation of the total amount of sleep is a homeostatic process (reviewed in Datta and MacLean, 2007). Homeostatic control mechanisms are activated to compensate for insufficient or excess sleep. In mammals, sleep consists of two major stages: 1) REM sleep and 2) non-REM (NREM) sleep. REM sleep is a distinctive sleep stage that alternates with episodes of NREM sleep. During the sleep-predominant light-on phase, the spontaneous NREM– REM sleep cycle in the rat takes about 12 to 20 min (Trachsel et al., 1991; Vivaldi et al., 1994a,b; Gottesmann, 1996; Datta and Hobson, 2000). Over the last four decades most of the sleep research has focused on identifying relevant brain structures, neuronal networks, and their transmitters that are involved in the generation and regulation of NREM and REM sleep (Alam et al., 1995; Thakkar et al., 1998; Pace-Schott and Hobson, 2002; Blanco-Centurion et al., 2006; Datta and MacLean, 2007). On the contrary, few studies have focused on understanding the possible mechanisms for the ultradian periodic occurrence of NREM–REM sleep.
Some investigators have suggested that there may be a sleep-dependent oscillator that regulates the NREM–REM sleep cycle (Whitehead et al., 1969; Gaillard and Tuglular, 1976; Miyasita et al., 1989; Benington and Heller, 1994a; Vivaldi et al., 1994a,b; Barbato and Wehr, 1998). The results of those studies have also suggested that the appearance of REM sleep in the NREM–REM sleep cycle is a functional need for reversing some consequences of the synchronized bursting activity that occurs during NREM sleep (Benington and Heller, 1994a,b; Bennington et al., 1994). Therefore, the daily amount and frequency of REM sleep is proposed to be regulated by the homeostatic regulation of NREM sleep (Benington and Heller, 1994a,b). Contrary to the idea that the ultradian periodic occurrence of REM sleep is an epiphenomenon and its appearances depend on the homeostatic regulation of NREM sleep (Benington and Heller, 1994a,b), there is experimental evidence which suggests that the homeostatic regulatory process of REM sleep is independent of the NREM sleep homeostatic regulatory process (Vivaldi et al., 1994a,b; Ocampo-Garces et al., 2000; Franken, 2002). Indeed, the occurrence of REM sleep rebound following total sleep deprivation or selective REM sleep deprivation is one of the most common phenomena (Dement, 1960; Vimont-Vicary et al., 1966; Morden et al., 1967; Beersma et al., 1990; Brunner et al., 1990; Endo et al., 1997, 1998; Datta et al., 2004). More specifically, some studies have shown that the increase in REM sleep during recovery was proportional to the amount of REM sleep lost in deprivation (Dement et al., 1966; Kitahama and Valatx, 1980; Parmeggiani et al., 1980; Perez et al., 1992; Amici et al., 1994). Finally, some selective REM sleep deprivation studies have shown that during deprivation there are progressively more frequent attempts at transitions into REM sleep, an indication of a strong homeostatic drive for REM sleep (Endo et al., 1997, 1998; Ocampo-Garces et al., 2000; Werth et al., 2002; Datta et al., 2004). Again, these findings are consistent with the suggestion that some homeostatic regulatory processes accurately regulate the daily amount of REM sleep.
A number of studies have suggested that the intensity of slow-wave activity (SWA; spectral power in the 0.75 to 4.5 Hz range, also called delta frequency range) in the cortical EEG is the single most important process for the homeostatic regulation of NREM sleep (Borbely et al., 1981, 1984; Borbely, 1982; Tobler and Borbely, 1986; Dijk et al., 1987, 1990; Achermann et al., 1993; Dijk and Czeisler, 1995; Franken et al., 2001). In support of this suggestion, studies have shown that the SWA in NREM sleep typically declines in the course of the daily sleep period and increases in recovery sleep after a period of prolonged waking (Tobler and Borbely, 1986; Dijk et al., 1987, 1990; Franken et al., 2001). Furthermore, it has also been reported that the SWA is reduced in the subsequent NREM sleep after a nap and/or excess sleep (Feinberg et al., 1992; Werth et al., 1996). However, the EEG marker(s) of REM sleep homeostasis remains poorly understood.
In the present study, in order to further expand our under-standing of the homeostatic regulatory mechanisms of REM sleep, spontaneously sleeping rats were partially deprived of REM sleep, using a selective REM sleep deprivation method (Datta et al., 2004). This was done for a short period of time without disturbing spontaneous NREM sleep and wakefulness. Polygraphic and behavioral states of baseline and experimental recording sessions were analyzed both during and after selective REM sleep deprivation to determine any specific changes in sleep–wake states and behavioral state-dependent delta, theta, alpha, beta, and gamma activity caused by the selective REM sleep deprivation.
2. Results
Following post-surgical recovery, eight rats were habituated extensively (about 15 days) for the freely moving polygraphic recording conditions. During this habituation recording sessions (between 9:00 AM and 3:00 PM), baseline sleep–wake percentages were carefully monitored to determine the day-to-day variations in the total percentages of sleep–wake and REM sleep latency. In these rats, recording sessions for the habituation continued until the total percentages of sleep–wake stages and REM sleep latencies were almost identical for three consecutive recording sessions. During this habituation recording sessions, polygraphic signs were also carefully monitored to select rats that exhibited minimal to no electrical artifacts in their cortical EEG. Based on this qualitative criterion, we have selected six of those eight rats for this study. The final results presented below are obtained from these six selected rats.
2.1. Effects of selective REM sleep deprivation on wake–sleep states
Fig. 1 illustrates the experimental design (1A) and changes in the amount of time spent in W, NREM sleep, and REM sleep during (1B; 11:00 A.M to 1:00 PM; T-1 period) and after (1C; 1:00 PM to 3:00 PM; T-2 period) selective REM sleep deprivation. During the T-1 period of the baseline recording session (BLD), these rats spent 78.93% (mean) of time in sleep and remained awake for about 21.1% of total time. Of the 78.93% sleep time, 15.2% of that time was spent in REM sleep (1B). On the next day, during the identical circadian periods of recording session (T-1 period), those rats were selectively deprived for REM sleep. During this REM sleep deprivation period (RDD), the total amount of time spent in REM sleep was 1.85% (Fig. 1B). This total amount of REM sleep was 87.83% less than their total amount of REM sleep during the identical time period of the previous day (T-1 period of the BLD). During this selective REM sleep deprivation period (T-1 period of the RDD), the total percentage of wakefulness (23.1±3.3%; mean±SE) was not significantly different (F=0.25; p=0.63; one-way ANOVA) compared to the total percentage of time spent in wakefulness during the BLD (Fig. 1B). During this selective REM sleep deprivation period, the total percentage of time spent in NREM sleep was 15.99% higher than the total percentage of time spent in NREM sleep during the identical time period of the BLD (F=6.3; p<0.05; Fig. 1B). These results demonstrate that the short-term (2 h) selective REM sleep deprivation method used for this study effectively reduced the total amount of REM sleep. These results also demonstrated that this selective REM sleep deprivation method did not increase wakefulness and/or decrease non-REM sleep, which are common disadvantages of many other existing REM sleep deprivation methods (Datta et al., 2004). During the T-2 period of the RDD, when rats were allowed to have undisturbed REM sleep, there was a rebound increase in REM sleep (Fig. 1C). The total amount of this rebound REM sleep was 149.68% of their total amount of REM sleep during the T-2 period of BLD.
Fig. 1.

Effects of selective REM sleep deprivation on the total percentages of time spent in wakefulness (W), non-REM sleep (NR), and REM sleep (R). (A) Experimental design for selective REM sleep deprivation. During baseline recording day (BLD) rats were allowed to have a 4 h period (between 11:00 AM and 3:00 PM) of undisturbed sleep–wake cycle with REM sleep. During REM sleep deprivation day (RDD) REM sleep episodes were selectively terminated between 11:00 AM and 1:00 PM, after which rats were allowed to have undisturbed sleep–wake cycle with REM sleep between 1:00 PM and 3:00 PM. (B) Histograms showing the total percentages of time spent (mean±SEM) in W, NR, and R during the first 2 h (between 11:00 AM and 1:00 PM) of BLD (gray bars) and RDD (white bars) recording sessions. (C) Histograms showing the total percentages of time spent (mean±SEM) in W, NR, and R during the last 2 h (between 1:00 PM and 3:00 PM) of BLD (gray bars) and RDD (black bars) recording sessions. Note that compared with the BLD recording session, in the RDD recording session, during the first 2 h the total percentage of non-REM sleep increased and REM sleep decreased, but during the last 2 h, REM sleep increased. *p<0.05; ***p<0.001.
2.2. Effects of selective REM sleep deprivation on number of REM sleep episodes
Fig. 2 illustrates the number of REM sleep episodes during (2A; T-1 period) and after (2B; T-2 period) selective REM sleep deprivation. During the first 2 h of BLD (T-1 period), the mean number of REM sleep episodes was 12. On the next day, during the identical circadian periods of recording session (T-1 period of the RDD), REM sleep episodes were selectively terminated as soon as they appeared (within 10 s of their appearance). Since these REM sleep episodes were terminated prematurely, subsequent REM sleep episodes appeared more frequently. During this two-hour period of RDD, mean total number of REM sleep episodes (25.67±1.2; mean±SE) was significantly higher than the mean total number of REM sleep episodes during the BLD (12.0±0.73; F=97.73; p<0.001). During the third and fourth hours of second recording session (T-2 period of RDD) starting immediately after the end of selective REM sleep deprivation, when rats were allowed to have undisturbed REM sleep, the mean total number of REM sleep episodes (20.83±1.4) were less than their total number of REM sleep episodes during the REM sleep deprivation period (25.67±1.2). However, during this post REM sleep deprivation period (T-2 period), the mean number of REM sleep episodes (20.83±1.4) remained significantly higher (F=12.10; p<0.01) than the mean number of REM sleep episodes during the T-2 periods of BLD (15.66±0.56).
Fig. 2.

Effects of selective REM sleep deprivation on the number of REM episode counts and duration. (A) Number of total REM sleep episodes (mean±SEM) during the first 2 h of baseline day (gray bar) and REM sleep deprivation day (black bar). (B) Number of total REM sleep episodes (mean±SEM) during the last 2 h of baseline day (gray bar) and REM sleep deprivation day (black bar). (C) To further evaluate the REM sleep deprivation-specific differences in REM sleep during the recovery period, each episode was separated by duration (D-1, 0–30 s; D-2, 35–60 s; D-3, 65–120 s; D-4, >120 s). Note that compared to the last 2 h of the baseline recording day, during the selective REM sleep recording day the number of D-1 and D-4 types REM sleep episodes increased. On the contrary, the numbers of D-2 and D-3 types of REM sleep episodes were significantly decreased during the REM sleep deprivation day. *p<0.05; **p<0.01; ***p<0.001.
Having documented the changes in the total number of REM sleep episodes, next, based on the duration, undisturbed REM sleep episodes during the T-2 periods of both baseline and selective REM sleep recording sessions were divided into following four types: very short (D-1, 5–30 s), short (D-2, 35–60 s), medium (D-3, 65–120 s), and long (D-4, >120 s). Fig. 2C illustrates the distributions of four different types of REM sleep episodes in the T-2 time periods of the BLD and RDD recording days. One-way ANOVAs revealed that during this T-2 time period, in the REM sleep deprivation recording day, the mean number of D-1 (170.63% higher; F=57.60; p<0.001) and D-4 (215.32% higher; F=47.81; p<0.001) types of REM sleep episodes were significantly higher than in the baseline recording day (Fig. 2C). On the contrary, during this T-2 period, in the REM sleep deprivation recording day, the mean number of D-2 (46.88% less; F=10.32; p<0.01) and D-3 (34.37% less; F=7.86; p<0.05) types of REM sleep episodes were significantly less than in the baseline recording day. These results indicated that during the T-2 period, compared to that in the baseline recording day, in the REM sleep deprivation recording day the number of very short and long duration REM sleep episodes increased whereas the number of short and medium duration REM sleep episodes decreased.
2.3. Effects of selective REM sleep deprivation on EEG power spectra in NREM sleep and REM sleep
Fig. 3 illustrates the delta, theta, and gamma powers of cortical EEG in NREM sleep. Two-way ANOVA’s revealed no significant treatment (baseline REM sleep and selective REM sleep deprivation) variations in the delta (F=0.03; p=0.87), theta (F=3.58; p=0.08), alpha (F=0.56; p=0.47), beta (F=0.05; p=0.83), and gamma (F=0.04; p=0.84) frequency powers in NREM sleep. Similarly, individual post-hoc tests (Scheffe F-test) also confirmed that these powers in NREM sleep were not significantly different between baseline and selective REM sleep deprivation recording days (Fig. 3). These results indicated that this selective REM sleep deprivation did not change delta, theta, alpha, beta, and gamma frequency powers in NREM sleep.
Fig. 3.

Non-REM sleep delta (0.2–4.5 Hz), theta (5–10 Hz), and gamma (21–40 Hz) frequency range cortical EEG power during the baseline recording day (BLD) and selective REM sleep deprivation recording day (RDD). Bars represent percentages (mean±SEM) of total power (within the frequency range between 0.2 and 40 Hz) during each hour of the four-hour (one-hour to four-hour) recording period.
Fig. 4 illustrates delta, theta, and gamma powers of cortical EEG in REM sleep. Two-way ANOVAs revealed significant main effect of treatment on the delta (F=11.75; p=0.007) but not on the theta (F=0.39; p=0.55), alpha (F=1.50; p=0.25), beta (F=0.17; p=0.69), and gamma (F=0.62; p=0.45) powers in REM sleep. Individual post-hoc analysis showed that compared to the baseline recording day, in the REM sleep deprivation recording day, delta powers were significantly higher in the first (F=5.13; p<0.05) and second (F=53.06; p<0.001) hours but not in the third (F=0.32; p=0.58) and fourth (F=0.01; p=0.98) hours. On the contrary, similar comparisons showed that the theta power was significantly less only in the second hour (F=4.93; p<0.05). Individual post-hoc analysis also confirmed that alpha, beta, and gamma powers at all four time points were not significantly different between baseline and REM sleep deprivation recording days. These results indicated that this selective REM sleep deprivation increased REM sleep delta power and decreased theta power during the period of REM sleep deprivation.
Fig. 4.
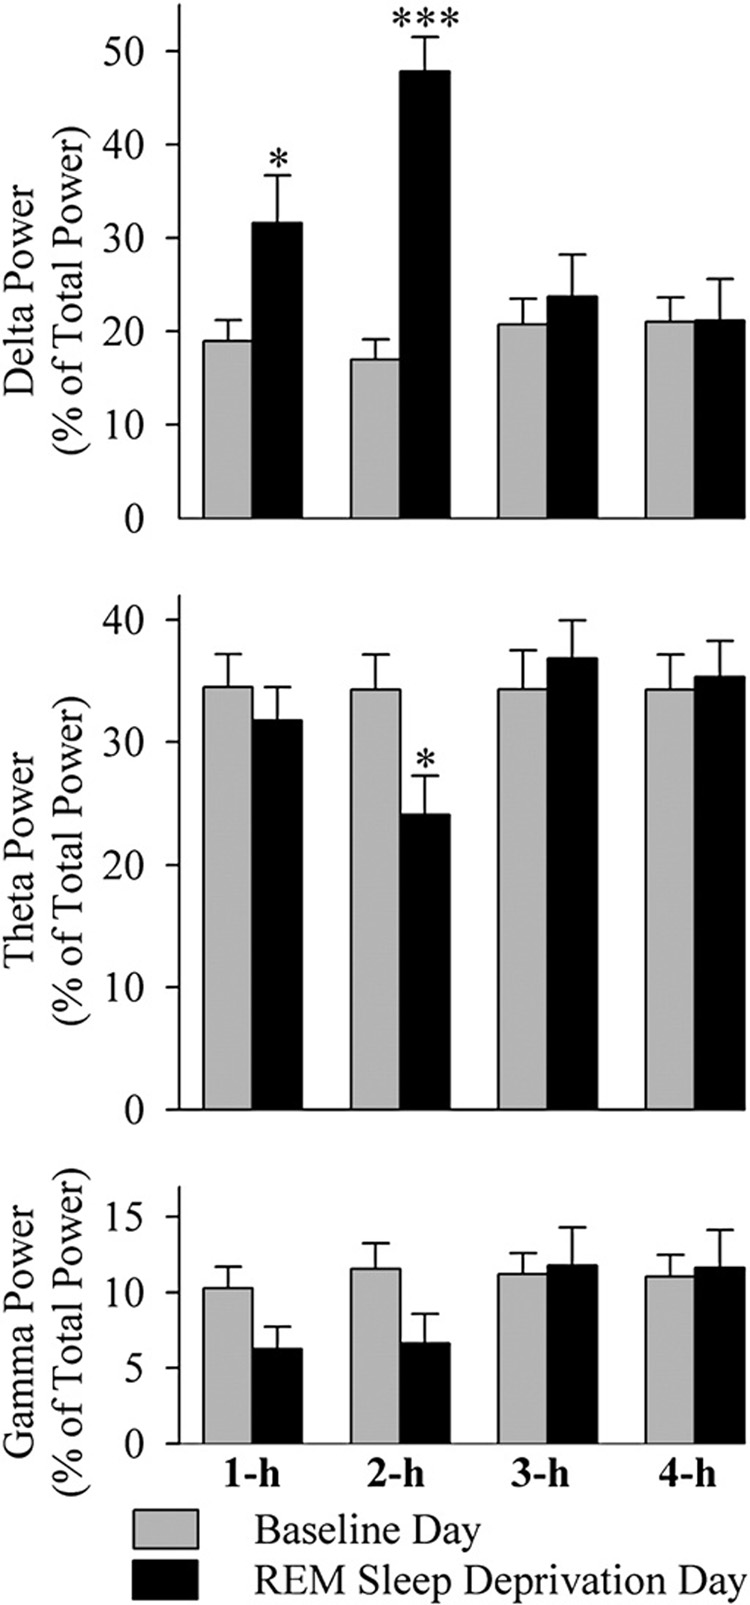
REM sleep delta (0.2–4.5 Hz), theta (5–10 Hz), and gamma (21–40 Hz) frequency range cortical EEG power during the baseline recording day (BLD) and selective REM sleep deprivation recording day (RDD). Bars represent percentages (mean±SEM) of total power (within the frequency range between 0.2 and 40 Hz) during each hour of the four-hour (one-hour to four-hour) recording period. Note that the delta power was significantly increased during the first 2 h of the RDD. Also note that the theta power significantly decreased during the second hour (two-hour) of the RDD. *p<0.05; ***p<0.001.
3. Discussion
The goal of this study was to elucidate physiological processes that are involved in the homeostatic regulation of REM sleep. The results of this study demonstrated that, during the period of selective REM sleep deprivation, our selective REM sleep deprivation protocol successfully reduced 87.80% of the total duration of normal REM sleep. During this selective REM sleep restriction period, the number of REM sleep episodes doubled. The result of this increased number of REM sleep episodes is consistent with the results of other studies that have shown that during the REM sleep deprivation period the number of interventions required to prevent REM sleep increases dramatically (Dement, 1960; Kales et al., 1964; Sampson, 1965; Vimont-Vicary et al., 1966; Agnew et al., 1967; Morden et al., 1967; Benington and Heller, 1994a,b; Vivaldi et al., 1994a,b; Endo et al., 1997, 1998; Ocampo-Garces et al., 2000; Franken et al., 2001; Werth et al., 2002). These studies have also suggested that this increased REM sleep propensity is an indication that the homeostatic processes of REM sleep have been activated. The results of the present study also demonstrated that during the last 2 h of the undisturbed sleep–wake period, the total percentage of REM sleep was 49.68% greater during the REM sleep deprivation day than their baseline recording day. This result indicated a rebound REM sleep after a two-hour period of REM sleep deprivation. This increased REM sleep rebound is also consistent with a number of studies that have shown increased total amount of REM sleep after a variable period of REM sleep deprivation (Dement, 1960; Kales et al., 1964; Sampson, 1965; Agnew et al., 1967; Benington and Heller, 1994a,b; Vivaldi et al., 1994a,b; Endo et al., 1997, 1998; Ocampo-Garces et al., 2000; Franken et al., 2001; Werth et al., 2002). It is also worth mentioning that during the 2 h of the recovery period, 49.68% more REM sleep accounts for only 64.95% of REM sleep recovery from their REM sleep loss during the preceding two-hour REM sleep deprivation period. Compared to our 64.95% recovery after 2 h of partial REM sleep deprivation, longer periods of REM sleep deprivation studies have shown that this recovery could be more than 70% of lost REM sleep (Dement et al., 1966; Parmeggiani et al., 1980; Stickgold et al., 1993; Rechtschaffen et al., 1999; Franken, 2002). In summary, the results of this study demonstrated that during selective REM sleep deprivation the number of attempts to enter REM sleep increased, and during the recovery period the total amount of REM sleep increased to compensate for REM sleep deficits from the preceding selective deprivation period. Collectively these results are in agreement with the idea that REM sleep is homeostatically regulated. More importantly, these results demonstrated that 2 h of REM sleep deprivation, using our newly developed selective REM sleep deprivation protocol, have successfully activated the homeostatic regulatory processes of REM sleep.
Over many years of research on the homeostatic regulation of NREM sleep, it has been demonstrated that the homeostatic demand for its total amount and frequency depends on the specific activity patterns of the cortical EEG waves (Borbely et al., 1981; Borbely, 1982; Daan et al., 1984; Dijk et al., 1987, 1990; Werth et al., 1996; Franken et al., 2001). These results have demonstrated that the intensity of EEG slow-wave activity (SWA; EEG spectral power between 0.5 and 4.5 Hz; delta frequency range) is a major factor for the homeostatic regulation of NREM sleep. This opinion is mainly based on the observations that the SWA in NREM sleep declines in the course of the daily sleep period and increases proportionately to the duration of prior wakefulness (Borbely, 1982; Daan et al., 1984; Tobler and Borbely, 1986; Dijk et al., 1987, 1990; Feinberg et al., 1992; Werth et al., 1996; Franken et al., 2001). Unlike NREM sleep, the EEG correlates for the REM sleep homeostatic process remained poorly understood, until now. One preliminary study in humans suggested that the EEG activity of the alpha rhythm (frequency range of 8–12 Hz) might be a marker of REM sleep homeostasis (Roth et al., 1999). Yet, another preliminary study, in the rat, has suggested that the alpha rhythm may not be involved in REM sleep homeostasis (Bjorvatn et al., 1998). The results of the present study demonstrated that during selective REM sleep deprivation, delta power (SWA) was increased and theta power was decreased during those residual REM sleep periods. The results of our study also demonstrated that during REM sleep deprivation and during the recovery period, the power of alpha, beta, and gamma frequency waves did not change. These results indicated that these waves may not be involved in the homeostatic regulation of REM sleep. Thus, the results of our study clearly demonstrated that the SWA is involved in the homeostatic regulation of REM sleep.
A controversy in the literature of REM sleep homeostatic regulation is that a group of researchers believe that the homeostatic regulation of REM sleep is NREM sleep independent (Vivaldi et al., 1994a,b; Endo et al., 1997, 1998; Ocampo-Garces et al., 2000; Franken, 2002; Ocambo-Garces and Vivaldi, 2002), and another group of researchers believe that the regulation of REM sleep is dependent on the homeostatic regulation of NREM sleep (Benington and Heller, 1994a,b; Benington, 2002). After a careful review of this literature, we came to a conclusion that these controversies could easily be resolved by a study that considers the following conditions: 1) use of a selective REM sleep deprivation protocol to partially deprive REM sleep for a short period of time, 2) while depriving REM sleep selectively, the protocol should not increase wakefulness and/or decrease non-REM sleep, and 3) should analyze the spectral power of the EEG during non-REM and REM sleep separately while the subject is under deprivation protocol and under recovery from the deprivation. Considering the above conditions, the results of our study demonstrated that during selective REM sleep deprivation, the total percentage of NREM sleep and the power of SWA during those residual REM sleep episodes increased. Interestingly, during this selective REM sleep deprivation period, theta power decreased during the residual REM sleep episodes.
It is a well-known fact that circadian factors could influence regulation of sleep. Thus, this study was designed to minimize the influence of circadian factors that could affect the homeostatic regulatory processes of REM sleep. To activate homeostatic processes of REM sleep, spontaneous REM sleep episodes occurring between 11:00 AM and 1:00 PM were prematurely terminated. Earlier studies have suggested that a REM sleep deprivation protocol lasting for a maximum duration of 3 h can rule out the possible circadian influence on the homeostatic regulatory processes (Borbely et al., 1984; Brunner et al., 1990; Benington and Heller, 1994a,b; Vivaldi et al., 1994a,b). Thus, it is reasonable to suggest that the homeostatic responses observed in this study have not been affected by circadian control. In addition, carrying out each study at the same circadian time also minimized the influences of circadian factors on the activated homeostatic processes of this study. Some studies have shown that, in the rat, the expression of REM sleep episodes is highest and NREM sleep homeostatic pressure is minimal at a time between 10:00 AM and 4:00 PM (Trachsel et al., 1988; Franken et al., 1991; Vivaldi et al., 1994a; Datta and Hobson, 2000). Thus, the selected time window (between 11:00 AM and 3:00 PM) for this selective REM sleep deprivation experiment was ideal for the activation of REM sleep homeostatic processes. The results of this study have shown that during the deprivation protocol, the total percentage of time spent in wakefulness did not change, and the total percentage of time spent in NREM sleep did not decrease. These results indicate that the REM sleep deprivation method used in this study is very selective. Thus, the observed changes in the physiological processes are selective homeostatic responses for the regulation of REM sleep.
In summary, the results of the current study demonstrated that homeostatic regulation of REM sleep is positively coupled with the homeostatic regulation of NREM sleep. These findings suggest that with some careful consideration in the timing, total duration, and method of selective REM sleep deprivation, the homeostatic regulation of REM sleep could be studied independently.
4. Experimental procedures
4.1. Subjects and housing
Experiments were performed on 8 adult male Wistar rats (Charles River, Wilmington, MA) weighing between 250 and 350 g. The rats were housed individually at 24 °C with food and water provided ad libitum with lights on from 7:00 AM to 7:00 PM(light cycle) and off from 7:00 PM to 7:00 AM (dark cycle). The principles for the care and use of laboratory animals in research, as outlined by the National Institutes of Health Publication No. 85-23 (1985) were strictly followed.
4.2. Surgical procedures and implantation of electrodes
Treatment of the animals and surgical procedures were in accordance with an approved institutional animal welfare protocol (AN-14084). Efforts were made to minimize the number of animals used and their suffering. Rats were anesthetized with pentobarbital (40 mg/kg, i.p.), placed in the stereotaxic apparatus, and secured using blunt rodent ear bars (Paxinos and Watson, 1997). With the use of sterile procedures, cortical electroencephalogram (EEG), dorsal neck muscle electromyogram (EMG), and hippocampal EEG (to record theta waves) recording electrodes were chronically implanted, as described elsewhere (Datta and Hobson, 2000)
4.3. Adaptation recording session
After the post-surgical recovery period of 3–7 days, rats were habituated to the experimenter, the sound-attenuated recording cage (electrically shielded: 2.5×1.5×1.5 ft), and free-moving polygraphic (Grass Polygraph, model #79, Grass Instrument, Quincy, MA) recording conditions for 10–15 days. The last day of these adaptation recording sessions was determined when, for 3 consecutive days, the day-to-day variation on the percentage of REM sleep was less than 5% of their total amount of REM sleep. All adaptation recording sessions were performed between 9:00 AM and 3:00 PM, when rats are normally sleeping. During recovery, habituation, and free-moving recording conditions (adaptation recording sessions), all rats were housed under the same 12/12 h light/dark cycle with free access to food and water.
4.4. Polygraphic recordings and selective REM sleep deprivation setup
To record cortical EEG, EMG, and hippocampal EEG in a freely moving condition, each rat’s head plug was mated to a male connector that was in turn connected to a commutator. Signals from this commutator were sent to a polygraph (Grass Model 79, located in the next room) via its electrode board (located inside the recording chamber). To allow rats to move freely inside the recording cage while maintaining the head plug connection, a counterbalanced connecting cable and a mechanical pulley system (attached to the roof of the recording chamber) were used. In a separate room, polygraphic signs of the rat were continuously observed on a computer monitor to identify ongoing behavioral stages (Datta and Siwek, 2002; Datta et al., 2004).
For the purpose of REM sleep deprivation, the beginning of each REM sleep episode was identified by observation of on-going polygraphic records. From the room adjacent to the rat, the experimenter pressed a mechanical lever within 5–10 s of REM sleep onset, the animal’s head was gently lifted and REM sleep was terminated. The detailed description and validation of this selective REM sleep deprivation method is described in our earlier publications (Datta et al., 2004; Bandyopadhya et al., 2006). One of the most important advantages of this REM sleep deprivation method is that this method successfully eliminates >80% of REM sleep without significantly reducing NREM sleep and or increasing wakefulness.
4.5. Experimental design
On the day after the last adaptation recording session, when day-to-day variation on the total amount of REM sleep stabilized, experimental recording sessions began. During the experimental recording session, each animal was connected to the polygraphic recording system at 9:00 AM. In the next room, polygraphic signs of the sleep–wake cycle were continuously observed on a computer monitor (between 11:00 AM and 3:00 PM). During the first experimental baseline sleep–wakefulness recording session (between 11:00 AM and 3:00 PM), rats were allowed to have undisturbed sleep–wakefulness (hereafter this recording session is labeled as “baseline/control REM sleep recording day”; “BLD”). The following day, rats were recorded for the second experimental recording session. The experimental protocol for the second experimental recording session was almost identical to the protocol described for “BLD” recording session, except that for this recording session, from 11:00 AM to 1:00 PM REM sleep episodes were selectively terminated at the beginning (within 5–10 s) of each episode while the animals were connected to the polygraphic recording system (hereafter second experimental recording session is labeled as “REM sleep deprivation recording day”; “RDD”). After this two-hour selective REM sleep deprivation, animals were allowed to have undisturbed sleep–wake for another two-hour period (between 1:00 PM and 3:00 PM). In summary, the main difference between these two “BLD” and “RDD” experimental recording sessions is that in the RDD REM sleep episodes were selectively terminated during the first 2 h (between 11:00 AM and 1:00 PM). For our convenience, hereafter the first two-hour (between 11:00 AM and 1:00 PM) time period is labeled as “T-1” and the last two-hour (between 1:00 PM and 3:00 PM) time period is labeled as “T-2 ”.
4.6. Determination of behavioral states
For the purpose of determining possible effects on sleep and wakefulness, polygraphic data were captured on-line using “Gamma” software (Grass product group, Astro-Med, Inc., West Warwick, RI, USA). From this captured data, three behavioral states were distinguished and scored visually using “Rodent Sleep Stager” software (Grass product group, Astro-Med, Inc., West Warwick, RI, USA). These three states were: Wakefulness (W), NREM sleep, and REM sleep. The physiological criteria for the identification of these wake–sleep states were described in details in our earlier publications (Datta et al., 2002, 2004). In this study, the behavioral states of W, NREM sleep, and REM sleep were scored in successive five-second epochs. This epoch length allowed us to quantify the short periods of REM sleep (3–5 s) in the rats where REM sleep was selectively terminated (Datta et al., 2004).
4.7. Analysis of cortical EEG Activity
The EEG signals were amplified and bandpass filtered (0.1– 100 Hz) using polygraph (Grass Inc., Quincy, MA). The amplified and filtered data was digitized at a sampling frequency of 200 Hz and stored in the computer using Gamma software (Grass-Tele-factor product group, Astro-Med, Inc., West Warwick, RI, USA). Digitized EEG signals were then subjected to Fast Fourier Transformation (0.2–40 Hz with an interval of 0.2 Hz) using “Sleep Sign for Animal” software (Kissei America, Inc., Irvine, CA, USA) to calculate the total power/hour during total period of time spent in W, NREM sleep, and REM sleep in a four-hour recording session (bin width of 5 s) for the following five wave frequency bands: a) delta:0.2 to 4.5 Hz, b) theta, 5 to 10 Hz, c) alpha, 11 to 14 Hz, d)beta, 15 to 20 Hz, and d) gamma, 21 to 40 Hz. Finally, the power of each frequency band for each state was averaged and expressed as a percentage of the total power within the frequency range between 0.2 and 40 Hz. The average percentage power of each frequency band was treated as an individual variable.
4.8. Data analysis
The polygraphic measures for the behavioral states provided the following dependent variables, which were quantified for each recording session: (1) percentage of recording time spent in W, NREM sleep, and REM sleep during T-1 and T-2 periods; (2) number of REM sleep episodes per hour; and (3) duration of individual REM sleep episodes. The EEG power density data provided the following dependent variables, which were quantified for each recording session: (1) total percentage of EEG power in delta, theta, alpha, beta, and gamma bands in NREM sleep during four one-hour epoch of four-hour recording session and (2) total percentage of EEG power in delta, theta, alpha, beta, and gamma bands in REM sleep during four one-hour epoch of four-hour recording session. The data of each dependent variable were compared between BLD and RDD recording sessions to determine the effects of selective REM sleep deprivation. For the statistical analyses, two-way repeated measures ANOVAs (for factors “time of the day” and “day of experiment”) and/or one-way ANOVAs (to assess differences between BLD and RDD) were performed with the use of StatView statistical software (Abacus Concepts, Berkeley, CA). P values of less than 0.05 were considered statistically significant.
Acknowledgments
This study was supported by NIH Research Grants: MH-59839 and NS-34004. V. Sagvaag and T. Aspevik were supported by the Government of Norway educational training grant.
Abbreviations
- BLD
baseline/control REM sleep recording day
- RDD
REM sleep deprivation recording day
- SWA
slow-wave activity
- T-1
first two-hour time period (11:00 AM to 1:00 PM)
- T-2
last two-hour time period (1:00 PM to 3:00 PM)
REFERENCES
- Achermann P, Dijk DJ, Brunner DP, Borbély AA. A model of human sleep homeostasis based on EEG slow-wave activity: quantitative comparison of data and simulations. Brain Res. Bull. 1993;31:97–113. doi: 10.1016/0361-9230(93)90016-5. [DOI] [PubMed] [Google Scholar]
- Agnew HW, Webb WB, Williams RL. Comparison of stage four and 1-REM sleep deprivation. Percept. Mot. Skills. 1967;24:851–858. doi: 10.2466/pms.1967.24.3.851. [DOI] [PubMed] [Google Scholar]
- Alam MN, McGinty D, Szymusiak R. Neuronal discharge of preoptic/anterior hypothalamic thermosensitive neurons: relation to NREM sleep. Am. J. Physiol. 1995;269:R1240–R1249. doi: 10.1152/ajpregu.1995.269.5.R1240. [DOI] [PubMed] [Google Scholar]
- Amici R, Zamboni G, Perez E, Jones CA, Toni I, Culin F, Parmeggiani PL. Pattern of desynchronized sleep during deprivation and recovery induced in the rat by changes in ambient temperature. J. Sleep Res. 1994;3:250–256. doi: 10.1111/j.1365-2869.1994.tb00139.x. [DOI] [PubMed] [Google Scholar]
- Bandyopadhya RS, Datta S, Saha S. Activation of pedunculopontine tegmental protein kinase A: a mechanism for rapid eye movement sleep generation in the freely moving rat. J. Neurosci. 2006;26:8931–8942. doi: 10.1523/JNEUROSCI.2173-06.2006. [DOI] [PMC free article] [PubMed] [Google Scholar]
- Barbato G, Wehr TA. Homeostatic regulation of REMS in humans during extended sleep. Sleep. 1998;21:267–276. doi: 10.1093/sleep/21.3.267. [DOI] [PubMed] [Google Scholar]
- Beersma DGM, Dijk DJ, Blok CGH, Everhardus I. REM sleep deprivation during 5 hours leads to an immediate REM sleep rebound and to suppression of non-REM sleep intensity. Electroenceph. Clin. Neurophysiol. 1990;76:114–122. doi: 10.1016/0013-4694(90)90209-3. [DOI] [PubMed] [Google Scholar]
- Benington JH. Debating how REM sleep is regulated (and by what) J. Sleep Res. 2002;11:29–33. doi: 10.1046/j.1365-2869.2002.0282a.x. [DOI] [PubMed] [Google Scholar]
- Benington JH, Heller HC. REM-sleep timing is controlled homeostatically by accumulation of REM-sleep propensity in non-REM sleep. Am. J. Physiol. 1994a;266:R1992–R2000. doi: 10.1152/ajpregu.1994.266.6.R1992. [DOI] [PubMed] [Google Scholar]
- Benington JH, Heller HC. Does the function of REM sleep concern non-REM sleep or waking? Prog. Neurobiol. 1994b;44:433–449. doi: 10.1016/0301-0082(94)90005-1. [DOI] [PubMed] [Google Scholar]
- Benington JH, Woudenberg MC, Heller HC. REMS propensity accumulates during 2-h REMS deprivation in the rest period in rats. Neurosci. Lett. 1994;180:76–80. doi: 10.1016/0304-3940(94)90917-2. [DOI] [PubMed] [Google Scholar]
- Bjorvatn B, Fagerland S, Ursin R. EEG power densities (0.5–20 Hz) in different sleep–wake stages in rats. Physiol. Behav. 1998;63:413–417. doi: 10.1016/s0031-9384(97)00460-5. [DOI] [PubMed] [Google Scholar]
- Blanco-Centurion C, Xu M, Murillo-Rodriguez E, Gerashchenko D, Shiromani AM, Salin-Pascual RJ, Hof PR, Shiromani PJ. Adenosine and sleep homeostasis in the basal forebrain. J. Neurosci. 2006;26:8092–8100. doi: 10.1523/JNEUROSCI.2181-06.2006. [DOI] [PMC free article] [PubMed] [Google Scholar]
- Borbély AA. A two process model of sleep regulation. Hum. Neurobiol. 1982;1:195–204. [PubMed] [Google Scholar]
- Borbély AA, Baumann F, Brandeis D, Strauch I, Lehmann D. Sleep deprivation: effect on sleep stages and EEG power density in man. Electroencephalogr. Clin. Neurophysiol. 1981;51:483–495. doi: 10.1016/0013-4694(81)90225-x. [DOI] [PubMed] [Google Scholar]
- Borbély AA, Tobler I, Hanagasioglu M. Effect of sleep deprivation on sleep and EEG power spectra in the rat. Behav. Brain Res. 1984;14:171–182. doi: 10.1016/0166-4328(84)90186-4. [DOI] [PubMed] [Google Scholar]
- Brunner DP, Dijk DJ, Tobler I, Borbély AA. Effect of partial sleep deprivation on sleep stages and EEG power spectra: evidence for non-REM and REM sleep homeostasis. Electroencephalogr. Clin. Neurophysiol. 1990;75:492–499. doi: 10.1016/0013-4694(90)90136-8. [DOI] [PubMed] [Google Scholar]
- Daan S, Beersma DGM, Borbély AA. Timing of human sleep: recovery process gated by a circadian pacemaker. Am. J. Physiol. 1984;246:R161–R178. doi: 10.1152/ajpregu.1984.246.2.R161. [DOI] [PubMed] [Google Scholar]
- Datta S, Hobson JA. The rat as an experimental model for sleep neurophysiology. Behav. Neurosci. 2000;114:1239–1244. doi: 10.1037//0735-7044.114.6.1239. [DOI] [PubMed] [Google Scholar]
- Datta S, Siwek DF. Single cell activity patterns of pedunculopontine tegmentum neurons across the sleep–wake cycle in the freely moving rats. J. Neurosci. Res. 2002;70:611–621. doi: 10.1002/jnr.10405. [DOI] [PubMed] [Google Scholar]
- Datta S, MacLean RR. Neurobiological mechanisms for the regulation of mammalian sleep–wake behavior: reinterpretation of historical evidence and inclusion of contemporary cellular and molecular evidence. Neurosci. Biobehav. Rev. 2007;31:775–824. doi: 10.1016/j.neubiorev.2007.02.004. [DOI] [PMC free article] [PubMed] [Google Scholar]
- Datta S, Spoley EE, Mavanji VK, Patterson EH. A novel role of pedunculopontine tegmental kainate receptors: a mechanism of rapid eye movement sleep generation in the rat. Neuroscience. 2002;114:157–164. doi: 10.1016/s0306-4522(02)00250-6. [DOI] [PubMed] [Google Scholar]
- Datta S, Mavanji V, Ulloor J, Patterson EH. Activation of phasic pontine-wave generator prevents rapid eye movement sleep deprivation-induced learning impairment in the rat: a mechanism for sleep-dependent plasticity. J. Neurosci. 2004;24:1416–1427. doi: 10.1523/JNEUROSCI.4111-03.2004. [DOI] [PMC free article] [PubMed] [Google Scholar]
- Dement W. The effects of dream deprivation. Science. 1960;131:1705–1707. doi: 10.1126/science.131.3415.1705. [DOI] [PubMed] [Google Scholar]
- Dement W, Greenberg S, Klein R. Effect of partial REM sleep deprivation and delayed recovery. J. Psychiatr. Res. 1966;4:141–152. doi: 10.1016/0022-3956(66)90003-3. [DOI] [PubMed] [Google Scholar]
- Dijk DJ, Beersma DGM, Daan S. EEG power density during nap sleep: reflection of an hourglass measuring the duration of prior wakefulness. J. Biol. Rhyth. 1987;2:207–219. doi: 10.1177/074873048700200304. [DOI] [PubMed] [Google Scholar]
- Dijk DJ, Brunner DP, Borbély AA. Time course of EEG power density during long sleep in humans. Am. J. Physiol. 1990;258:R650–R661. doi: 10.1152/ajpregu.1990.258.3.R650. [DOI] [PubMed] [Google Scholar]
- Dijk DJ, Czeisler CA. Contribution of the circadian pacemaker and the sleep homeostat to sleep propensity, sleep structure, electroencephalographic slow waves, and sleep spindle activity in humans. J. Neurosci. 1995;15:3526–3538. doi: 10.1523/JNEUROSCI.15-05-03526.1995. [DOI] [PMC free article] [PubMed] [Google Scholar]
- Endo T, Schwierin B, Borbély AA, Tobler I. Selective and total sleep deprivation: effect on the sleep EEG in the rat. Psychiatr. Resid. 1997;66:97–110. doi: 10.1016/s0165-1781(96)03029-6. [DOI] [PubMed] [Google Scholar]
- Endo T, Roth C, Landolot HP, Werth E, Aeschbach D, Achermann P, Borbély AA. Selective REM sleep deprivation in humans: effects on sleep and sleep EEG. Am. J. Physiol. 1998;274:R1186–R1194. doi: 10.1152/ajpregu.1998.274.4.R1186. [DOI] [PubMed] [Google Scholar]
- Feinberg I, Maloney T, March JD. Precise conservation of NREM period 1 (NREMP1) delta across naps and nocturnal sleep: implications for REM latency and NREM/REM alternation. Sleep. 1992;15:400–403. doi: 10.1093/sleep/15.5.400. [DOI] [PubMed] [Google Scholar]
- Franken P. Long-term vs short-term processes regulating REM sleep. J. Sleep Res. 2002;11:17–28. doi: 10.1046/j.1365-2869.2002.00275.x. [DOI] [PubMed] [Google Scholar]
- Franken P, Dijk DJ, Tobler I, Borbély AA. Sleep deprivation in rats: effects on EEG power spectra, vigilance states, and cortical temperature. Am. J. Physiol. (Regulatory Integrative Comp. Physiol.) 1991;261:R198–R208. doi: 10.1152/ajpregu.1991.261.1.R198. [DOI] [PubMed] [Google Scholar]
- Franken P, Chollet D, Tafti M. The homeostatic regulation of sleep need is under genetic control. J. Neurosci. 2001;21:2610–2621. doi: 10.1523/JNEUROSCI.21-08-02610.2001. [DOI] [PMC free article] [PubMed] [Google Scholar]
- Gaillard JM, Tuglular I. The orthodox-paradoxical sleep cycle in the rat. Experientia. 1976;32:718–719. doi: 10.1007/BF01919851. [DOI] [PubMed] [Google Scholar]
- Gottesmann C. The transition from slow-wave sleep to paradoxical sleep evolving facts and concepts of the neurophysiological processes underlying the intermediate stage of sleep. Neurosci. Bibobehav. Rev. 1996;20:367–387. doi: 10.1016/0149-7634(95)00055-0. [DOI] [PubMed] [Google Scholar]
- Kales A, Hoedemaker FS, Jacobson A, Lichtenstein EL. Dream deprivation: an experimental reappraisal. Nature. 1964;204:1337–1338. doi: 10.1038/2041337a0. [DOI] [PubMed] [Google Scholar]
- Kitahama K, Valatx JL. Instrumental and pharmacological paradoxical sleep deprivation in mice: strain differences. Neuropharmacology. 1980;19:529–535. doi: 10.1016/0028-3908(80)90022-2. [DOI] [PubMed] [Google Scholar]
- Miyasita A, Fukuda K, Inugami M. Effects of sleep interruption on REM-NREMS cycle in nocturnal human sleep. Electroencephalogr. Clin. Neurophysiol. 1989;73:107–116. doi: 10.1016/0013-4694(89)90189-2. [DOI] [PubMed] [Google Scholar]
- Morden J, Mitchell GA, Dement WC. Selective REM sleep deprivation and compensation phenomena in the rat. Brain Res. 1967;5:339–349. doi: 10.1016/0006-8993(67)90042-x. [DOI] [PubMed] [Google Scholar]
- Ocampo-Garcés A, Vivaldi EA. Short-term homeostasis of REM sleep assessed in an intermittent REM sleep deprivation protocol in the rat. J. Sleep Res. 2002;11:81–89. doi: 10.1046/j.1365-2869.2002.00281.x. [DOI] [PubMed] [Google Scholar]
- Ocampo-Garcés A, Molina E, Rodríguez A, Vivialdi EA. Homeostasis of REM sleep after total and selective sleep deprivation in the rat. J. Neurophysiol. 2000;84:2699–2702. doi: 10.1152/jn.2000.84.5.2699. [DOI] [PubMed] [Google Scholar]
- Pace-Schott EE, Hobson JA. The neurobiology of sleep: genetics, cellular physiology and subcortical networks. Nat. Rev., Neurosci. 2002;3:591–605. doi: 10.1038/nrn895. [DOI] [PubMed] [Google Scholar]
- Parmeggiani PL, Ciani T, Calasso M, Zamboni G, Perez E. Quantitative analysis of short term deprivation and recovery of desynchronized sleep in cats. Electroencephalogr. Clin. Neurophysiol. 1980;50:293–302. doi: 10.1016/0013-4694(80)90157-1. [DOI] [PubMed] [Google Scholar]
- Paxinos G, Watson C. The Rat Brain in Stereotaxic Coordinates. San Diego: Academic Press; 1997. [Google Scholar]
- Perez E, Zamboni G, Amici R, Toni I, Parmeggiani PL. Low ambient temperatures decrease the amount of desynchronized sleep in the rat and elicits a rebound which is related to the degree of deprivation. J. Sleep Res. 1992;1 (Suppl. 1):177. [Google Scholar]
- Rechtschaffen A, Bergmann BM, Gilliland MA, Bauer K. Effects of method, duration, and sleep stage on rebounds from sleep deprivation in the rat. Sleep. 1999;22:11–31. doi: 10.1093/sleep/22.1.11. [DOI] [PubMed] [Google Scholar]
- Roth C, Achermann P, Borbély AA. Alpha activity in the human REM sleep EEG: topography and effect of REM sleep deprivation. Clin. Neurophysiol. 1999;110:632–635. doi: 10.1016/s1388-2457(98)00060-1. [DOI] [PubMed] [Google Scholar]
- Sampson H. Deprivation of dreaming sleep by two methods. Arch. Gen. Psychiatry. 1965;13:79–86. doi: 10.1001/archpsyc.1965.01730010081011. [DOI] [PubMed] [Google Scholar]
- Stickgold R, Williams J, Datta S, Quattrochi J, Hobson JA. Suppression of eltoprazine-induced REM sleep rebound by scopolamine. Neuropharmacology. 1993;32:447–453. doi: 10.1016/0028-3908(93)90168-3. [DOI] [PubMed] [Google Scholar]
- Thakkar MM, Strecker RE, McCarley RW. Behavioral state control through differential serotonergic inhibition in the mesopontine cholinergic nuclei: a simultaneous unit recording and microdialysis study. J. Neurosci. 1998;18:5490–5497. doi: 10.1523/JNEUROSCI.18-14-05490.1998. [DOI] [PMC free article] [PubMed] [Google Scholar]
- Tobler I, Borbély AA. Sleep EEG in the rat as a function of prior waking. Electroencephalogr. Clin. Neurophysiol. 1986;64:74–76. doi: 10.1016/0013-4694(86)90044-1. [DOI] [PubMed] [Google Scholar]
- Trachsel L, Tobler I, Achermann P, Borbély AA. Sleep continuity and the REM-non REM cycle in the rat under baseline conditions and after sleep deprivation. Physiol. Behav. 1991;49:575–580. doi: 10.1016/0031-9384(91)90283-t. [DOI] [PubMed] [Google Scholar]
- Trachsel L, Tobler I, Borbély AA. Electroencephalogram analysis of non-rapid eye movement sleep in rats. Am. J. Physiol. 1988;255:R27–R37. doi: 10.1152/ajpregu.1988.255.1.R27. [DOI] [PubMed] [Google Scholar]
- Vimont-Vicary P, Jouvet-Mounier D, Delorme F. EEG and behavioral effects of deprivation of paradoxical sleep in cats. Electroencephalogr. Clin. Neurophysiol. 1966;20:439–449. doi: 10.1016/0013-4694(66)90101-5. [DOI] [PubMed] [Google Scholar]
- Vivaldi EA, Ocampo A, Wyneken U, Roncagliolo M, Zapata AM. Short-term homeostasis of active sleep and the architecture of sleep in the rat. J. Neurophysiol. 1994a;72:1745–1755. doi: 10.1152/jn.1994.72.4.1745. [DOI] [PubMed] [Google Scholar]
- Vivaldi EA, Wyneken U, Roncagliolo M, Ocampo A, Zapata AM. Measures of location and dispersion of sleep state distributions within the circular frame of a 12:12 light:dark schedule in the rat. Sleep. 1994b;17:208–219. doi: 10.1093/sleep/17.3.208. [DOI] [PubMed] [Google Scholar]
- Werth E, Achermann P, Borbély AA. Brain topography of the human sleep EEG: antero-posterior shifts of spectral power. NeuroReport. 1996;8:123–127. doi: 10.1097/00001756-199612200-00025. [DOI] [PubMed] [Google Scholar]
- Werth E, Cote KA, Gallmann E, Borbély AA, Achermann P. Selective REM sleep deprivation during daytime I. Time course of interventions and recovery sleep. Am. J. Physiol. (Regul. Integ. Comp. Physiol.) 2002;283:R521–R526. doi: 10.1152/ajpregu.00462.2001. [DOI] [PubMed] [Google Scholar]
- Whitehead W, Robinson TM, Wincor MZ, Reschtschaffen A. The accumulation of REMS need during sleep and wakefulness. Commun. Behav. Biol. 1969;4:195–201. [Google Scholar]