

Abstract
Rats are a common animal model for metabolism and toxicity studies. Previously, the enzymatic properties of rat FMO1 purified from hepatic and renal microsomes and that of FMO3 purified from hepatic microsomes were characterized. This study investigated the physical, immunological, and enzymatic properties of FMO3 purified from male rat kidney microsomes and compared the results to those obtained with isolated rat liver FMO3. Renal FMO3 was purified via affinity columns based on the elution of L-methionine (Met) S-oxidase activity and reactivity of the eluted proteins with human FMO3 antibody. Typically, Met S-oxidase specific activity was increased 100-fold through the purification steps. The resulting protein had similar mobility (∼56 kDa) as isolated rat liver FMO3 and cDNA-expressed human FMO3 by SDS-polyacrylamide gel electrophoresis. When the isolated kidney protein band was subjected to trypsin digestion and MALDI-TOF mass spectral analysis, 34% of the sequence of rat FMO3 was detected. The apparent Km and Vmax values for rat kidney FMO3 were determined using the known FMO substrates Met, seleno-L-methionine (SeMet), S-allyl-L-cysteine (SAC) and methimazole. The stereoselectivity of the reactions with Met and SAC were also examined using HPLC. The obtained kinetic and stereoselectivity results were similar to those we obtained in the present study, or those previously reported, for rat liver FMO3. Collectively, the results demonstrate many similar properties between rat hepatic and renal FMO3 forms and suggest that renal FMO3 may play an important role in kidney metabolism of xenobiotics containing sulfur and selenium atoms.
Introduction
Flavin-containing monooxygenases (FMOs) are microsomal enzymes that catalyze NADPH- and O2-dependent oxidation of compounds with a nucleophilic sulfur, nitrogen, phosphorus, or selenium atom. FMOs have a broad substrate range that includes pharmaceutical drugs, pesticides, industrial chemicals, and endogenous compounds. Generally, FMO mediated metabolites are more readily excreted and are less harmful than the parent compounds; however, with some chemicals, toxic metabolites are formed. Five expressed FMO isoforms (FMO1-FMO5) and six non-expressed pseudogenes (FMO6P-FMO11P) have been characterized in humans (Lawton et al., 1994; Hernandez et al., 2004). Each FMO isoform has a unique expression pattern that is age-, sex-, species-, and tissue-dependent.
Multiple tissue-specific mechanisms of FMO regulation have been recognized. For example, FMO1 is the principal isoform present in human fetal liver and birth is necessary for FMO1 expression to drop to low levels (Koukouritaki et. al, 2002). The down regulation of FMO1 in the human liver is species-dependent and tissue-specific; it does not occur in human kidney or in the liver or kidney of other mammalian species, including the rat, due to differences in upstream promoters (Shepard et al., 2007). Differences in rabbit FMO2 expression, between high levels in pulmonary tissues and low levels in hepatic tissues, occur due to tissue-specific transcription factors that associate with DNase I-hypersensitive domains (Shehin-Johnson et al., 1996). Hormonal regulation occurs in mouse liver as FMO3 expression levels are lower in males than females due to testosterone repression (Falls et al., 1997). Interestingly, the hepatic tissues of humans, rats, and rabbits do not exhibit sex related differences in FMO3 expression (Krause et al., 2003; Ripp et al., 1999a). FMO4 is expressed as a long form in rat kidneys and intestine and as a short form, in the brain due to alternative splicing. The short form has a deletion that may be indicative of a tissue-specific structural or functional change that alters FMO4 activity or stability (Lattard et al., 2003). Tissue-specific changes in FMO structure and function can also arise due to post-translational modifications. Hepatic pig FMO1 is N-glycosylated, which may alter protein folding, stability, and activity (Korsmeyer et al., 1998). Enzymatic glycosylation cannot occur in expression systems such as E. coli but purification of the native protein allows for the characterization of substrate specificity. Finally, FMO expression in various tissues and species can be affected by xenobiotic exposure, diet, or disease (Tijet et al., 2005; Rae et al., 2001; Katchamart et al., 2000; Borbás et al., 2006).
Previously, this laboratory has purified and characterized FMO1 from rat liver and kidney using S-benzyl-L-cysteine (SBC) as the substrate (Sausen et al., 1993). FMO1 was linked to S-oxidase activity with multiple cysteine S-conjugates, compounds in the glutathione conjugation and mercapturic acid formation pathway (Sausen et al., 1993; Ripp et al., 1997). FMO3 was purified from rat liver using Met as the substrate (Krause et al., 1996). Venkatesh et al. (1991) detected differences between purified hepatic and renal FMO1 from mouse tissues. Although there were many similar properties, the Km and Vmax for fenthion differed about 2-fold and the Km for fonofos, nicotine, and thiobenzamide differed about 2-fold. There were also differences in n-octylamine activation and amino acid composition. Thus, a precedent of the same FMO isoform having distinct properties in different tissues exists and warrants investigation into possible differences between rat hepatic and renal FMO3 forms. FMO3 metabolizes many compounds of pharmacological and toxicological importance such as methimazole, SeMet, and cysteine S-conjugates, such as SBC. Renal FMO3 protein was detected by immunoblots in dog, rat, rabbit, and human kidneys but has never been fully characterized (Ripp et al., 1999b; Krause et al., 2003). Interestingly, in dog kidney FMO3 expression was not detected by mRNA analysis (Lattard et al. 2002) but FMO3 protein was detected using western blotting (Ripp et al. 1999b). Additionally, two FMO3 transcripts of 3 kB and 4.2 kB were detected in dog liver and lung (Lattard et al. 2002). The two transcripts may be due to alternative 3′ processing which effects transcript and protein stability and localization and may have a profound effect on the expression of an enzyme. Thus, it is important to use protein techniques, such as purification, to characterize renal FMO3.
In human kidney, FMO1 has high expression levels and FMO3 has low levels (Cashman and Zhang, 2006; Krause et al., 2003; Yeung et al., 2000). In rats, FMO3 expression is greater in the kidney than the liver (Burnett et al., 1994; Lattard et al., 2001); thus rat renal metabolism may be different from human renal metabolism. Due to the metabolic significance of FMO3, the species-, sex-, and tissue-related differences in FMO3 activity and expression are important determinants of xenobiotic metabolism. Because rats are a common animal model for metabolism and toxicity studies and rat renal FMO3 has not been previously characterized, this study characterizes isolated rat renal FMO3 using gel electrophoresis and mass spectrometry and compares physical and metabolic activities of this enzyme with those of isolated rat liver FMO3.
Materials and Methods
Materials
NADPH, Met, Met sulfoxide, SeMet, SBC, methimazole (N-methyl-2-mercaptoimidazole), Cibracon Blue 3GA-agarose (type 3000-CL), and 1-fluoro-2,4-dinitrobenzene were obtained from Sigma-Aldrich Chemicals (St. Louis, MO). 2, 5′-ADP-Sepharose was obtained from Amersham Pharmacia Biotech (Uppsala, Sweden). Trypsin was sequence grade from Promega (Madison, WI). SAC was a gift from Wakunaga Pharmaceuticals of America (Mission Viejo, CA). Emulgen 911 was a gift from the Kao Atlas Corporation (Tokyo, Japan). FMO3 polyclonal rabbit anti-human antibody and cDNA-expressed human FMO3 are from BD Biosciences Gentest (Woburn, MA). Met selenoxide and SAC sulfoxide were synthesized as described previously (Krause et al., 2006; Ripp et al.,1997).
Preparation of microsomes
Kidneys and livers from male Sprague-Dawley rats (7-8 weeks) were received frozen on dry ice via overnight shipping (Pel-Freez, Rogers,AR). The organs were thawed in cold buffer A (10 mM KH2PO4, 1 mM EDTA, pH 7.6) and made into “washed” microsomes by the method previously described (Sausen and Elfarra, 1990). Microsomes were stored in 20% glycerol in FMO buffer (0.1 M KH2PO4, 0.1 M KCl, 5 mM EDTA, pH 7.4) at -80°C. Protein concentrations were determined using the bicinchoninic acid assay (Thermo Scientific, Rockford, IL) on a VERSAmax Tunable Microplate Reader (Molecular Devices Corporation, Sunnyvale, CA) using bovine serum albumin as the standard.
Purification of FMO3
Purification of FMO3 from the rat kidney and liver were carried out with slight modifications of that previously described for the hepatic FMO3 purification (Krause et al., 1996). Kidney microsomes were thawed at 37°C and subjected to dialysis three times for 15 min each against 1 L of buffer A at 4°C to the remove glycerol and KCl from the storage buffer. After dialysis, the microsomes were solubilized with 0.5% Emulgen 911 and centrifuged at 105,000 × g for 45 min at 4°C as previously described (Ripp et al., 1997). The supernatant was filtered through glass wool and applied to a Cibacron Blue column (8 × 1.5 cm) that was equilibrated with buffer B (10 mM KH2PO4, 1 mM EDTA, 0.05% Emulgen 911, pH 7.6). The column was washed with 75 mL of buffer B followed by elution with a KCl gradient from 0-1.25 M KCl in buffer B (35 mL each) and 1.5 mL fractions were collected. Every other fraction was assayed with 10 mM Met and 6 mM SBC for S-oxidase activity. SBC S-oxidase activity was used to determine the location of FMO1. Fractions that exhibited high Met S-oxidase activity with stereoselectivity for the formation of the d-isomer and reacted with anti-human FMO3 antibody were combined (Blue Pool I). Blue Pool I was dialyzed four times against 1 L of buffer A for 20 min. Blue Pool I was applied to a smaller (7 × 1 cm) Cibacron Blue column and washed with 30 mL of buffer B. The protein was eluted with a gradient of 0.05-1.25 M KCl in buffer B (20 mL each) and collected in 1 mL fractions. The fractions from the second Cibacron Blue column were assayed with 10 mM Met for S-oxidase activity. Fractions were pooled and dialyzed as described above (Blue Pool II). Blue Pool II was applied to a 2′, 5′-ADP-Sepharose column (3 × 0.5 cm) and washed with 10 mL of buffer B. The fractions were eluted by 0.4 mM NADPH in buffer B and collected in 1 mL fractions. Fractions were combined and dialyzed as described above (ADP Pool).
Enzymatic Assays
Enzymatic assays were performed in a similar manner to Ripp et al. 1997 and Krause et al. 2006. Assays were performed in a Dubnoff metabolic incubator at 37°C with constant shaking in glass tubes. The protein, 2 mM NADPH, and buffer A were pre-incubated for 5 min. Control incubations were run without NADPH. The reaction was started with the addition of substrate. The final reaction volume (0.25 mL) was incubated for 20 min at 37°C. The enzymatic reaction was stopped with the addition of cold ethanol (0.25 mL). Met and SAC reaction aliquots (350 μL) were derivatized by the addition of 9 μL of 1-fluoro-2, 4-dinitrobenzene (10% v/v in ethanol) and 6 μL of 1 M NaHCO3. SeMet reaction aliquots (350 μL) were derivatized by the addition of 9 μL of 1-fluoro-2, 4-dinitrobenzene (10% v/v in ethanol) and 30 μL KOH/KHCO3. After derivatization, the Met samples were incubated for 30 min at 37°C and then in the dark at room temperature for 6 h or overnight, the SAC samples were incubated at 60°C for 1 h and the SeMet samples were incubated in the dark at room temperature overnight. The methimazole assay was performed as previously described (Dixit and Roche, 1984), based upon the reaction of the oxidized product with nitro-5-thiobenzoate to yield 5,5′-dithiobis(2-nitrobenzoate) and the change in absorbance at 412 nm from 0 to 3 min. Kinetics of purified rat renal FMO3 were determined with Met, SAC, SeMet, and methimazole concentration ranging from 0.5 to 10 mM, 1 to 16 mM, 0.05 to 5 mM, and 0.005 to 1.0 mM respectively. Apparent kinetic constants (Km and Vmax) were determined using non-linear regression in SigmaPlot software (Systat Software Inc., San Jose, CA).
HPLC Analysis
HPLC analysis of the oxidation reactions were carried out using a Beckman System Gold 125 Solvent Module equipped with a Beckman Ultrasphere column (4.6 mm × 25 cm) and a Beckman System Gold Detector 166 or Diode Array Detector 168. The system was run at 1 mL/min with the detector set at 360 nm for the derivatized oxidation products of Met, SAC, SeMet and 220 nm for direct measurement of SBC sulfoxide. Injections of 20 μL were made with a Gilson 234 autoinjector and Beckman system gold software was used for HPLC control and data analysis. The HPLC methods were carried out with slight modifications to the procedures outlined previously for the analysis of the oxidation products of Met (Ripp et al., 1999a), SAC (Ripp et al., 1997), and SeMet (Krause et al., 2006). The mobile phase used for the detection of Met, SAC, and SeMet oxidation products was 1% acetonitrile (ACN), 0.1% triflouroacetic acid (TFA) pH 4.5 for pump A and 75% ACN, 0.1% TFA, pH 4.5 for pump B. The mobile phase for detection of the SBC sulfoxide was 1% ACN pH 2.5 for pump A and 50% ACN pH 2.5 for pump B. The gradients were as follows: for SAC, initial 15% B, at 6 min increased to 60% B over 5 min, at 14 min returned to 15% B, for Met, initial 30% B, at 5 min increased to 60% B over 5 min, at 12 min increased to 80% B over 2 min, at 18 min returned to 30% B, for SeMet, initial 5% B, at 0.1 min increased to 10% B over 2.9 min, at 3 min increased to 50% B over 3 min, at 8 min increased to 70% B over 2 min, at 13.5 min returned to 5% B, for SBC initial 7% B, at 3 min increased to 35% B over 4 min, at 13 min returned to 7% over 3 min. Quantitation of the Met, SAC, and SeMet oxidation products was carried out by comparing peak areas, corrected for the nonenzymatic activity, to standard curves with excellent correlation coefficients (r > 0.99) of chemically synthesized standards.
Electrophoresis
The purified protein was analyzed by SDS-polyacrylamide gel electrophoresis (12.5% Tris Criterion precast gel, Bio Rad Hercules, CA) that were run for 80 min with 200 V. Coomaisse blue staining was carried out by washing the gels in H2O, incubating in Imperial Stain (Thermo Scientific) for 2 h or overnight, and washing in H2O until the bands became visible. Silver staining was carried out by the procedure in the SilverSNAP Stain kit II (Thermo Scientific). Western blotting was carried out by a semi-dry transfer of proteins from the gel to Hybond-ECL nitrocellulose membrane (Amersham Bioscience, UK) in transfer buffer (0.02 M Tris, 0.001 M SDS, 0.2 M glycine, 10% methanol) at 70 mAmps for 70 min. The nitrocellulose was incubated in blotting reagent (5% powdered milk, 0.06 M NaCl in 25 mM Tris pH 7.5) for 1 h and washed in Tris-buffered saline with 0.1% Tween 20 multiple times. The nitrocellulose was exposed to anti-human FMO3 antibody overnight, washed and incubated in secondary goat anti-rabbit antibody conjugated to horse radish peroxidase (Jackson ImmunoResearch, West Grove, PA). West Pico Super Signal (Thermo Scientific) was used for detection. Film (CL-X Posure Film, Thermo Scientific) was exposed to the nitrocellulose in a dark room for 1-2 min and developed.
Trypsin Digestion
The purified kidney protein band with the same mobility as cDNA-expressed human FMO3 standard was excised from the coomassie blue stained gel. The excised piece was cut into small (<1 mm) pieces, washed in H2O, and destained in 200 μL of 100 mM (NH4)HCO3/50% methanol. The gel pieces were dehydrated by exposure to 200 μL of 25 mM (NH4)HCO3/50% ACN, 200 μL of 100% ACN, and vacuum centrifugation. The gel pieces were rehydrated in 25 mM dithiothreitol in 25 mM (NH4)HCO3 for 20 min at 56°C to reduce the disulfide bonds and 55 mM iodoacetamide in 25 mM (NH4)HCO3 for 20 min in the dark to alkylate the cysteine residues. The gel pieces were washed in H2O, dehydrated again, and rehydrated with 30 μL of 20 ng/μL trypsin in 25 mM (NH4)HCO3 at room temperature for 5 min and at 37°C overnight. Digested peptides were extracted from the gel pieces by exposure to 0.1% TFA and 70% ACN/25% H2O/5% TFA. Extracted peptides were pooled and dried down in a vacuum centrifuge. The peptides were reconstituted in 30 μL of 0.1% TFA and run through a ZipTip C18 column (Millipore, Billerica, MA) before MALDI-TOF analysis.
MALDI-TOF MS Analysis
Samples were spotted on plates using α-cyano-4-hydroxycinnamic acid as the matrix and were run on MADI-TOF TOF MS (Applied Biosystems/MDS SCIEX 4800 MALDI TOF/TOF) in positive mode (MALDI source with OptiBeam on-axis laser). The trypsin autolysis products (842.5094 and 2211.1046 m/z) were used for internal calibration of the spectra. The database search parameters allowed for oxidation of Met, one missed cleavage of trypsin, and up to 20 ppm mass error. The data was analyzed by Protein Prospector MS-Fit (http://prospector.ucsf.edu/).
Results
A protein with high Met S-oxidase activity and reactivity with anti-human FMO3 antibody was purified from male rat kidney microsomes. Chromatography from the first Cibacron Blue column showed that FMO3 activity elutes at approximately 0.25 M KCl, prior to the elution of the SBC S-oxidase which was previously characterized as FMO1. Further purification of kidney FMO3 activity through a second Cibacron Blue column followed by a 2′, 5′-ADP-Sepharose column typically resulted in a 100-fold increase of Met S-oxidase specific activity (Table 1). When the purified protein was run by SDS-PAGE, and was visualized by silver staining, a strong band (Fig. 1, lane F) with the same mobility as cDNA-expressed human FMO3 (Fig. 1, lane A) was observed. Although there were a few extraneous bands of protein, the increase in purity between chromatographic steps is considerable (Fig. 1). The purified protein in the final pool had similar mobility (∼56 kDa) as isolated rat liver FMO3 and cross-reacted with anti-human FMO3 antibody (Fig. 2). To provide further evidence for the isolated kidney protein as FMO3, the kidney protein band was excised from the coomassie blue stained gel, trypsin digested, and analyzed by MALDI-TOF MS. Fourteen peptides that matched to the theoretical masses of trypsin digested rat FMO3 were detected using a mass error tolerance of m/z +/- 20 ppm (Table 2). This represented 34.7% of the sequence of rat FMO3. Rat FMO3 was the most probable rat protein reported using the Protein Prospector MS-Fit software. The Gly-Xxx-Gly-Xxx-Xxx-Gly consensus sequence for the FAD binding site at amino acid residues 9-14 was detected at 1353.8232 m/z as part of a longer peptide. The Gly-Leu-Gly-Asn-Ser-Gly consensus sequence for NADPH binding at residues 191-196 was detected at 3006.6041 m/z as part of a longer peptide. Additionally, a pentapeptide from residues 24-28, which is a highly conserved region of FMOs, was detected as part of a longer peptide at 1726.7610 m/z. Interestingly, there were only 2 peptide matches to rat FMO1 with 3.8% coverage of the protein and 8 peptide matches to rat FMO4 (1 peptide also matched FMO3) with 15% coverage of the protein. The MOWSE score, which is determined using an algorithm where each peptide matched is given a statistical weight, for FMO1 and FMO4 are 4.3 and 387 respectively, which are much lower than the MOWSE score for FMO3 (1.06 × 10⁹) (Protein Prospector MS-Fit). MALDI-TOF MS analysis of the isolated rat liver FMO3 (after trypsin digestion) was not carried out since we previously reported the purification and characterization of this protein (Krause et al. 1996).
Table 1.
Representative purification of Met S-oxidase activity from rat kidney microsomes. Met S-oxidase activities, protein concentrations, and purification steps were carried out as described under Materials and Methods; incubation times were 20 min; Met concentration was 10 mM.
| Fraction | Volume (mL) | Total Protein (mg) | Total Activity (nmol/min) | Specific Activity (nmol/mg protein/min) | Fold Purification |
|---|---|---|---|---|---|
| Microsomes | 17 | 122 | 117 | 0.96 | 1 |
| Solubilized Microsomes | 35 | 56 | 100 | 1.8 | 1.9 |
| Blue Pool I | 12.5 | 7.4 | 45 | 6.1 | 6.4 |
| Blue Pool II | 6 | 4 | 43 | 10.8 | 11.3 |
| ADP Pool | 1 | 0.04 | 5 | 125 | 130 |
Figure 1. Purification of FMO3 from rat kidney microsomes.

Lane A, 1.5 μg of cDNA-expressed human FMO3 standard; Lane B, 20 μg total rat kidney microsomes; Lane C, 10 μg solubilized rat kidney microsomes; Lane D, 2 μg Blue Pool I; Lane E, 1 μg Blue Pool II; Lane F, 0.7 μg ADP pool.
Figure 2. Representative immunoblots of ADP pools with anti-human FMO3 antibody.

Lane A, 0.75 μg of cDNA-expressed human FMO3 standard; Lane B, 0.5 μg of rat liver ADP pool; Lane C, 0.5 μg of rat kidney ADP pool. Positions of molecular weight markers are shown.
Table 2.
Identification of rat FMO3 by MALDI-TOF. Molecular weight is given as monoisotopic values. Peptide matching is by Protein Prospector MS-Fit.
| Experimental m/z | Theoretical m/z | Error (ppm) | Modifications | Missed Cleavage | Start | End | Peptide Sequence |
|---|---|---|---|---|---|---|---|
| 1116.5851 | 1116.5796 | 4.88 | 0 | 484 | 492 | (R) NAILTQWDR(S) | |
| 1269.6942 | 1269.6838 | 8.23 | 0 | 103 | 112 | (K) YIQFETLVTR(I) | |
| 1286.6604 | 1286.6375 | 17.8 | 0 | 281 | 291 | (K) EPVFNDELPAR(I) | |
| 1353.8232 | 1353.8213 | 1.46 | 0 | 5 | 19 | (K) VAVIGAGVSGLAAIR(S) | |
| 1492.6987 | 1429.7209 | −15.5 | 0 | 87 | 98 | (K) LQEYITSFATEK(N) | |
| 1431.7029 | 1431.7114 | −5.98 | 0 | 52 | 64 | (R) ASIYQSVFTNSSK(E) | |
| 1726.7610 | 1726.7411 | 11.5 | 0 | 20 | 33 | (R) SCLEEGLEPTCFER(S) | |
| 1850.8932 | 1850.8894 | 2.04 | 0 | 224 | 238 | (R) VWNDGYPWDMVVITR(F) | |
| 1866.9131 | 1866.8843 | 15.4 | Met-ox | 0 | 224 | 238 | (R) VWNDGYPWDMVVITR(F) |
| 1873.9755 | 1874.0105 | −18.7 | 0 | 501 | 516 | (R) VVGGIQKPCLYSHFLR(L) | |
| 1930.9658 | 1930.9520 | 7.15 | 0 | 457 | 472 | (R) LAIEVFFGPCSPYQFR(L) | |
| 2299.1704 | 2299.1328 | 16.3 | 1 | 454 | 472 | (K) DPRLAIEVFFGPCSPYQFR(L) | |
| 2385.0662 | 2385.0441 | 9.26 | Met-ox | 1 | 395 | 415 | (R) GTCILPSVNDMMDDIDEKMGK(K) |
| 3006.6042 | 3006.6041 | 0.0564 | 0 | 187 | 215 | (R) VLVIGLGNSGCDIAAELSHVAQQVIISSR(S) |
Incubation of purified rat renal FMO3 with 10 mM Met and 2 mM NADPH led to detection of Met sulfoxide that was typically 80% in the d-isomer form with a specific activity of approximately 150 nmol/mg protein/min. Purified renal FMO3 with 15 mM SAC typically resulted in sulfoxide formation that was 60% of the latter eluting diastereomer with a specific activity of approximately 200 nmol/mg protein/min. The activities and stereoselectivities were corrected by subtraction of non-enzymatic activity detected in samples without NADPH, which had little sulfoxide formation that was 55% of the Met sulfoxide d-isomer and 45% of the SAC sulfoxide later eluting isomer.
The kinetic parameters for known FMO3 substrates determined with rat renal FMO3 are summarized in Table 3 and corresponding parameters for the purified hepatic FMO3 are included for comparison. Non-linear regression of the kinetic data is shown in Figure 3. Km values determined with purified rat renal FMO3 with methimazole, SeMet, Met, and SAC were 0.04, 0.35, 2.8 and 4.3 mM respectively. Vmax values determined with purified rat renal FMO3 for methimazole, SeMet, Met, and SAC were 101, 1148, 253 and 219 nmol/mg protein/min, respectively. The kinetic values obtained may be slightly affected by the extraneous proteins visible by SDS-PAGE and silver staining in the purified renal FMO3 pool. The rat kidney FMO3 kinetic parameters for SeMet and SAC were similar to the corresponding values obtained with the isolated rat liver FMO3.
Table 3.
Comparison of kinetic parameters of sulfur and selenium compounds with purified rat renal and hepatic FMO3. Vmax and Km for the hepatic FMO3 with L-methionine and methimazole were taken from Krause et al. 1996.
| Km (mM) | Vmax (nmol/mg/min) | |||
|---|---|---|---|---|
| Substrate | Kidney FMO3 | Liver FMO3 | Kidney FMO3 | Liver FMO3 |
| Methimazole | 0.04 | 0.01 | 101 | 168 |
| Seleno-L-methionine | 0.35 | 0.31 | 1148 | 1347 |
| L-Methioinine | 2.8 | 3.4 | 253 | 261 |
| S-Allyl-L-cysteine | 4.3 | 5.9 | 219 | 130 |
Figure 3. Kinetics for rat renal FMO3.
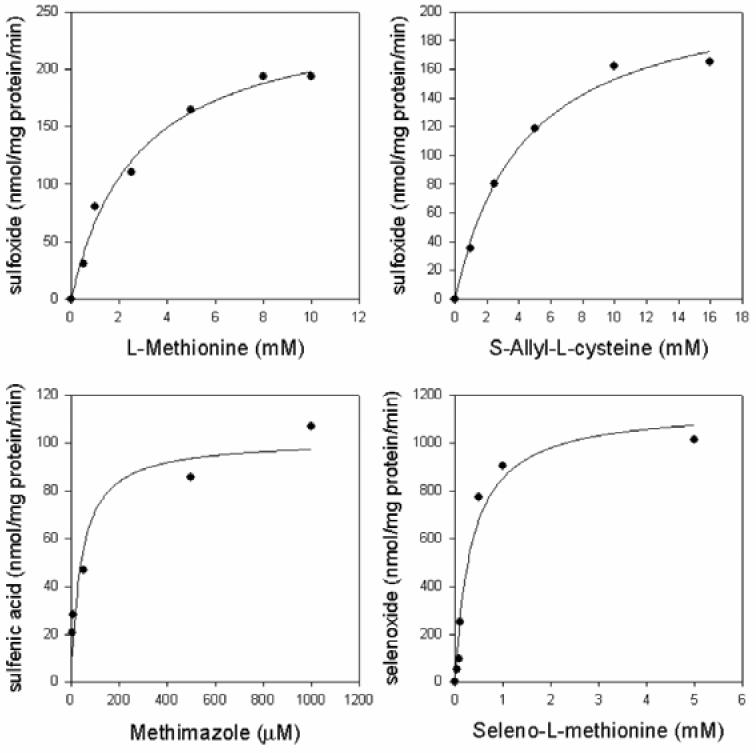
Km and Vmax were determined by non-linear regression in SigmaPlot. Oxidation products were measured and quantified as described in Materials and Methods.
Discussion
This study investigated the physical and immunological properties of rat renal FMO3 and characterized the kinetics with Met, SAC, SeMet and methimazole. The KCl concentration that eluted FMO3 from the Cibacron Blue column was similar to the KCl concentration used to elute rat liver FMO3. The purification included 2 Cibacron Blue columns with different KCl gradients to ensure separation of FMO3 from FMO1. Using our purification scheme, the kidney protein was purified about 100-fold as indicated by Met S-oxidase specific activity. This is similar to the results we obtained with the rat liver where FMO3 was purified 109-fold using similar methods (data not shown). Previously, Krause et al. (1996) reported a 72-fold enrichment of rat liver FMO3 using similar columns and Met as the substrate, whereas Sedeque et al. (1993) reported a 77-fold enrichment of macaque liver FMO3 using 2 ion exchange columns and an 2′,5′-ADP Sepharose column and methyl p-tolyl sulfide as the substrate.
The purified protein was run by SDS-PAGE to determine its approximate molecular weight and assess purity (Fig. 1). The number of bands in the final pool is drastically reduced; although, there are still a few extraneous proteins, between 31-45 kDa. The major band exhibited a molecular weight (∼56 kDa) similar to the molecular weight obtained in the present study for hepatic FMO3 (Fig. 2) and the molecular weight previously reported for rat liver FMO3 (Krause et al. 1996).
The purified kidney protein exhibited a band with the same mobility as cDNA-expressed human FMO3 by SDS-PAGE that also reacted with anti-human FMO3 antibody. The antibody used is intended for a human FMO3, which has 81% similar sequence identity to rat FMO3 (Lattard et al., 2001); thus, it is not surprising that rat FMO3 reacts with the anti-human antibody. This band was stained with coomassie blue and was subjected to in-gel trypsin digestion and MALDI-TOF MS analysis. Trypsin cleaves peptides at the carboxyl side of the amino acids lysine and arginine, except when either is followed by a proline, allowing a search for peptides of known mass. We selected search parameters that allowed for one missed cleavage by trypsin, ± 20 ppm mass error, and the variable oxidation of Met. The peptides detected covered 34.7% of the rat FMO3 sequence. The coverage included the FAD (amino acids 9-14) and NADPH (amino acids 191-196) binding regions. It also included a highly conserved pentapeptide that is present in rabbit, human, and mouse FMO3 as well as rat FMO1 (Lattard et al., 2001). FMO3 was the highest scored rat protein (Protein Prospector MS-Fit). To our knowledge this is the first confirmation of the rat FMO3 amino acid sequence from native protein. Notably, it is difficult to identify membrane proteins via MALDI-TOF analysis because of the low abundance, the low solubility that necessitates detergents, and the tendency for the proteins to aggregate. The method described above, which combines enrichment prior to electrophoresis and in-gel digestion, may be a useful way to obtain a peptide mass fingerprint of membrane-associated proteins.
There are 3 predicted putative consensus sequences (Asn-Xxx-Ser/Thr, Xxx ≠ Pro) for N-glycosylation in rat FMO3 (Asn 61, 275, and 422). Two of these sequences (Asn 61 and 275) were detected as unmodified peptides by MALDI-TOF (Table 2), suggesting N-glycosylation in the native protein at these sites is incomplete or does not occur. It should be noted, however, that identification of glycosylated peptides solely by MALDI-TOF MS is not certain due to the variety of glycans that could be linked to the peptides. Previously, hepatic pig FMO1 was shown to be N-glycosylated at Asn 120 using endoglycosidase-H digestion, plant lectin binding studies, and high-performance liquid chromatography/electrospray ionization/mass spectrometry in conjunction with computer algorithms to search for multiple hypothetical high-mannose glycopeptides (Korsmeyer et al., 1998). Despite being N-glycosylated, Asn 120 was also detected as an unmodified peptide suggesting that N-glycosylation of Asn 120 in hepatic pig FMO1 was incomplete.
The kinetics parameters for rat renal FMO3 are similar to the hepatic form. Methimazole is the highest affinity substrate tested, followed by SeMet, Met and SAC. This is the same substrate affinity order as hepatic FMO3 (Table 3). The small differences in kinetic values are within the normal range of variability in kinetic assays on purified proteins and provide evidence that the enzymes have the same catalytic properties.
Met, an essential amino acid that is toxic in high doses, is metabolized by rat renal FMO3 to Met sulfoxide with a Km value of 2.8 mM and a Vmax value of 253 nmol/mg protein/min. This is similar to what was observed with purified rat liver FMO3 (Km = 3.4 mM and Vmax = 261 nmol/mg protein/min) (Krause et al., 1996). Normal plasma Met concentrations (40-60 μM) are too low for FMO3 to significantly contribute to Met metabolism; but higher plamsa Met levels (0.05-1.9 mM), near the Km of FMO3, were observed in patients with homocystinuria, methionine adenosyltransferase defiency, and impaired chronic liver disease (Tangerman et al., 2000; Gahl et al., 1988; Bosy-Westphal et al., 2003).
Rat renal FMO3 metabolized SeMet to methionine selenoxide with a Km value of 0.35 mM and Vmax value of 1148 nmol/mg protein/min. The kinetic values correspond closely with purified rat liver FMO3 (Km = 0.31 mM and Vmax = 1347 nmol/mg protein/ min). Previously, Krause et al. (2006) reported values (Km = 0.11 mM and Vmax = 280 nmol/mg protein/ min) for SeMet metabolism by isolated rat liver FMO3 that differ from the values obtained in the present study. The difference in Vmax values among the studies may be due to experimental errors in quantifying low protein levels or differences in the duration of storage of the purified proteins. The low Km and high Vmax values obtained in the present study for both hepatic and renal FMO3 indicate that renal FMO3 may have a role in the metabolism of SeMet in vivo. SeMet is a common dietary source of selenium, an essential micronutrient that is acutely and chronically toxic when given at high levels. Tissue selenium levels have also been related to a reduced incidence of certain cancer; thus, SeMet is taken as a nutritional supplement. Importantly, SeMet has been shown to bioaccumulate in the kidney and liver in a dose dependent manner (Tashjian et al., 2006). Collectively, this indicates SeMet levels in the kidney could be affected by FMO3 metabolism.
Methimazole is a prescribed treatment for hyperthyroidism and an antioxidant that protected the rat kidney against the nephrotoxicity of S-(1,2-dichlorovinyl)-L-cysteine, 2-bromohydroquinone, cephaloridine, cis-diaminedichloroplatinum, and gentamicin (Sausen et al., 1991; Elfarra et al., 1993). Renal FMO3 metabolizes methimazole with a Km value of 0.04 mM and a Vmax value of 101 nmol/mg protein/min. The Km values are similar to the kinetics obtained with heterologously expressed rat FMO3 (Km = 0.04 mM and Vmax = 200 nmol/mg protein/min) and purified rat liver FMO3 (Km = 0.01 mM and Vmax = 168 nmol/mg protein/min) (Lattard et al., 2001; Krause et al., 1996).
SAC, a component of garlic and model cysteine S-conjugate, has anti-oxidant activities that protects against aging, cancer and reactive oxygen species damage by CCl4 (Kodai et al. 2007), acetaminophen (Hsu et al., 2006), and alcohol in the liver (Yan and Yin, 2007). SAC sulfoxide can also act as an antioxidant to prevent damage in nicotine treated rats (Helen et al., 2003), and in isoproterenol-induced myocardial ischemia (Sangeetha et al., 2006). Rat renal FMO3 had a Km value of 4.3 mM and a Vmax value of 219 nmol/mg protein/min. The Km value is similar to the value we obtained with purified hepatic rat FMO3 (Km = 5.9 mM and Vmax = 130 nmol/mg/min) and cDNA-expressed rabbit FMO3 (Km = 5.5 mM and Vmax = 18.2 nmol/nmol flavin/min) (Ripp et al., 1997). To our knowledge no kinetic determination with SAC has been performed on purified rat FMO3 previously. The detection of the sulfoxide in rat urine after dosing with SAC provides evidence that this reaction takes place in vivo (Krause et al., 2002), although the high Km of FMO3 suggests that other FMO isoforms or enzymes may also be involved.
Collectively, the results presented in this manuscript demonstrate many similar properties between rat hepatic and renal FMO3 forms. Furthermore, the results suggest renal FMO3 may play a role in xenobiotic biotransformation in the kidney and may aid in future metabolism studies.
Acknowledgments
This research is supported by National Institute of Health Grants RO1 DK044295 and T32-ES-007015. A preliminary report of this data was presented at the Society of Toxicology Meeting in Seattle, WA March 17, 2008.
Abbreviations:
- FMO
flavin-containing monooxygenase
- SeMet
seleno-L-methionine
- SAC
S-allyl-L-cysteine
- SBC
S-benzyl-L-cysteine
- Met
L-methionine
- TFA
triflouroacetic acid
- ACN
acetonitrile
- MALDI-TOF MS
matrix-assisted laser desorption/ionization time of flight mass spectrometry
- SDS-PAGE
sodium dodecyl sulfate-polyacrylamide gel electrophoresis
- FAD
flavin adenine dinucleotide
- HPLC
high-performance liquid chromatography
References
- Borbás T, Benkő B, Dalmadi B, Szabó I, Tihanyi K. Insulin in flavin-containing monooxygenase regulation. Flavin-containing monooxygenase and cytochrome P450 activities in experimental diabetes. Eur J Pharm Sci. 2006;28:51–58. doi: 10.1016/j.ejps.2005.12.011. [DOI] [PubMed] [Google Scholar]
- Bosy-Westphal A, Ruschmeyer M, Czech N, Oehler G, Hinrichsen H, Plauth M, Lotterer E, Fleig W, Müller MJ. Determinants of hyperhomocysteinemia in patients with chronic liver disease and after orthotopic liver transplantation. Am J Clin Nutr. 2003;77:1269–1277. doi: 10.1093/ajcn/77.5.1269. [DOI] [PubMed] [Google Scholar]
- Burnett VL, Lawton MP, Philpot RM. Cloning and sequencing of flavin-containing monooxygenases FMO3 and FMO4 from rabbit and characterization of FMO3*. J Biol Chem. 1994;269:14314–14322. [PubMed] [Google Scholar]
- Cashman JR, Zhang J. Human flavin-containing monooxygenases. Annu Rev Pharmacol Toxicol. 2006;46:65–100. doi: 10.1146/annurev.pharmtox.46.120604.141043. [DOI] [PubMed] [Google Scholar]
- Dixit A, Roche TE. Spectrophotometric assay of the flavin-containing monooxygenase and changes in its activity in female mouse liver with nutritional and dinurnal conditions. Arch Biochem Biophys. 1984;233:50–63. doi: 10.1016/0003-9861(84)90600-3. [DOI] [PubMed] [Google Scholar]
- Elfarra AA, Duescher RJ, Sausen PJ, O'Hara TM, Cooley AJ. Methimazole protection of rats against gentamicin-induced nephrotoxicity. Can J Physiol Pharmacol. 1993;72:1238–1244. doi: 10.1139/y94-176. [DOI] [PubMed] [Google Scholar]
- Falls JG, Ryu DY, Cao Y, Levi PE, Hodgson E. Regulation of mouse liver flavin-containing monooxygenases 1 and 3 by sex steroids. Arch Biochem Biophys. 1997;342:212–223. doi: 10.1006/abbi.1997.9965. [DOI] [PubMed] [Google Scholar]
- Gahl WA, Bernardini I, Finkelstein JD, Tangerman A, Marin JJ, Blom HJ, Mullen KD, Mudd SH. Transsulfuration in an adult with hepatic methionine adenosyltransferase deficiency. J Clin Invest. 1988;81:390–397. doi: 10.1172/JCI113331. [DOI] [PMC free article] [PubMed] [Google Scholar]
- Helen A, Krishnakumar K, Vijayammal PL, Augusti KT. A comparative study of antioxidants S-allyl cysteine sulfoxide and vitamin E on the damages induced by nicotine in rats. Pharmacology. 2003;67:113–117. doi: 10.1159/000067796. [DOI] [PubMed] [Google Scholar]
- Hernandez D, Janmohamed A, Chandan P, Phillips IR, Shepard EA. Organization and evolution of the flavin-containing monooxygenase genes of human and mouse: Identification of novel gene and pseudogene clusters. Pharmacogenetics. 2004;14:117–130. doi: 10.1097/00008571-200402000-00006. [DOI] [PubMed] [Google Scholar]
- Hsu C, Lin C, Liao T, Yin M. Protective effect of S-allyl cysteine and S-propyl cysteine on acetaminophen-induced hepatotoxicity in mice. Food Chem Toxicol. 2006;44:393–397. doi: 10.1016/j.fct.2005.08.012. [DOI] [PubMed] [Google Scholar]
- Katchamart S, Stressor DM, Dehal SS, Kupfer D, Williams DE. Concurrent flavin-containing monooxygenase down-regulation and cytochrome P-450 induction by dietary indoles in rat: Implications for drug-drug interaction. Drug Metab Dipos. 2000;28:930–936. [PubMed] [Google Scholar]
- Kodai S, Takemura S, Minamiyama Y, Hai S, Yamamoto S, Kubo S, Yoshida Y, Niki E, Okada S, Hirohashi K, Suehiro S. S-Allyl cysteine prevents CCl4-induced acute liver injury in rats. Free Radic Res. 2007;41:489–497. doi: 10.1080/10715760601118361. [DOI] [PubMed] [Google Scholar]
- Korsmeyer KK, Guan S, Yang Z, Falick AM, Ziegler DM, Cashman JR. N-glycosylation of pig flavin-containing monooxygenase form 1: determination of the site of protein modification by mass spectrometry. Chem Res Toxicol. 1998;11:1145–1153. doi: 10.1021/tx980117p. [DOI] [PubMed] [Google Scholar]
- Koukouritaki SB, Simpson P, Yeung CK, Rettie AE, Hines RN. Human hepatic flavin-containing monooxygenases 1 (FMO1) and 3 (FMO3) developmental expression. Pediatr Res. 2002;51:236–253. doi: 10.1203/00006450-200202000-00018. [DOI] [PubMed] [Google Scholar]
- Krause RJ, Glocke SC, Elfarra AA. Sulfoxides as urinary metabolites of S-allyl-L-cysteine in rats: Evidence for the involvement of flavin-containing monooxygenases. Drug Metab Dispos. 2002;30:1137–1142. doi: 10.1124/dmd.30.10.1137. [DOI] [PubMed] [Google Scholar]
- Krause RJ, Glocke SC, Sicuri AR, Ripp SL, Elfarra AA. Oxidative metabolism of seleno-L-methionine to L-methionine selenoxide by flavin-containing monooxygenase. Chem Res Toxicol. 2006;19:1643–1649. doi: 10.1021/tx0601915. [DOI] [PMC free article] [PubMed] [Google Scholar]
- Krause RJ, Lash LH, Elfarra AA. Human kidney flavin-containing monooxygenases and their potential roles in cysteine S-conjugate metabolism and nephrotoxicity. J Pharmacol Exp Ther. 2003;304:185–191. doi: 10.1124/jpet.102.042911. [DOI] [PubMed] [Google Scholar]
- Krause RJ, Ripp SL, Sausen PJ, Overby LH, Philpot RM, Elfarra AA. Characterization of the methionine S-oxidase activity of rat liver and kidney microsomes: Immunochemical and kinetic evidence for FMO3 being the major catalyst. Arch Biochem Biophys. 1996;333:109–116. doi: 10.1006/abbi.1996.0370. [DOI] [PubMed] [Google Scholar]
- Lattard V, Buronfosse T, Lachuer J, Longin-Sauvageon C, Moulin C, Benoit E. Cloning, sequencing, tissue distribution, and heterologous expression of rat flavin-containing monooxygenase 3. Arch Biochem Biophys. 2001;391:30–40. doi: 10.1006/abbi.2001.2317. [DOI] [PubMed] [Google Scholar]
- Lattard V, Longin-Sauvageon C, Benoit E. Cloning, sequencing and tissue distribution of rat flavin-containing monooxygenase 4: two different forms are produced by tissue-specific alternative splicing. Mol Pharmacol. 2003;63:253–261. doi: 10.1124/mol.63.1.253. [DOI] [PubMed] [Google Scholar]
- Lattard V, Longin-Sauvageon C, Lachuer J, Benoit E. Cloning, sequencing and tissue-dependent expression of flavin-containing monooxygenase (FMO) 1 and FMO3 in the dog. Drug Metab Dispos. 2002;30:119–128. doi: 10.1124/dmd.30.2.119. [DOI] [PubMed] [Google Scholar]
- Lawton MP, Cashman JR, Cresteil T, Dolphin CT, Elfarra AA, Hines RN, Hodgson E, Kimura T, Ozols J, Phillips IR, Philpot RM, Poulsen LL, Rettie AE, Shepard EA, Williams DE, Ziegler DM. A nomenclature for the mammalian flavin-containing monooxygenase gene family based on amino acid sequence identity. Arch Biochem Biophys. 1994;308:254–257. doi: 10.1006/abbi.1994.1035. [DOI] [PubMed] [Google Scholar]
- Rae JM, Johnson MD, Lippman ME, Flockhart DA. Rifampin is a selective, pleitropic inducer of drug metabolism genes in human hepatocytes: studies with cDNA and oligonucleotide expression arrays. J Pharmacol Exp Ther. 2001;299:849–857. [PubMed] [Google Scholar]
- Ripp SL, Itagaki K, Philpot RM, Elfarra AA. Methionine S-oxidation in human and rabbit liver microsomes:Evidence for a high affinity methionine S-oxidase activity that is distinct from flavin containing monooxygenase 3. Arch Biochem Biophys. 1999a;367:322–332. doi: 10.1006/abbi.1999.1247. [DOI] [PubMed] [Google Scholar]
- Ripp SL, Itagaki K, Philpot RM, Elfarra AA. Species and sex differences in expression of flavin-containing monooxygenase form 3 in liver and kidney microsomes. Drug Metab Dispos. 1999b;27:46–52. [PubMed] [Google Scholar]
- Ripp SL, Overby LH, Philpot RM, Elfarra AA. Oxidation of cysteine S-conjugates by rabbit liver microsomes and cDNA-expressed flavin-containing monooxygenases: Studies with S-(1,2-dichlorovinyl)-L-cysteine, S-(1,2,2-trichlorovinyl)-L-cysteine, S-allyl-L-cysteine, and S-benzyl-L-cysteine. Mol Pharm. 1997;52:507–515. [PubMed] [Google Scholar]
- Sadeque AJ, Thummel KE, Rettie AE. Purification of macaque liver flavin-containing monooxygenase: A form of the enzymes related immunochemically to an isozyme expressed selectively in adult human liver. Biochim Biophys Acta. 1993;1162:127–134. doi: 10.1016/0167-4838(93)90138-h. [DOI] [PubMed] [Google Scholar]
- Sangeetha T, Quine SD. Preventive effect of S-allyl cysteine sulfoxide (allin) on cardiac marker enzymes and lipids in isoproterenol-induced myocardial injury. J Pharm Pharmacol. 2006;58:617–623. doi: 10.1211/jpp.58.5.0006. [DOI] [PubMed] [Google Scholar]
- Sausen PJ, Duescher RJ, Elfarra AA. Further characterization and purification of the flavin-dependent S-benzyl-L-cysteine S-oxidase activities of rat liver and kidney microsomes. Mol Pharm. 1993;43:388–396. [PubMed] [Google Scholar]
- Sausen PJ, Elfarra AA. Cysteine conjugate S-oxidase. Characterization of a novel enzymatic activity in rat hepatic and renal microsomes. J Biol Chem. 1990;265:6139–6145. [PubMed] [Google Scholar]
- Sausen PJ, Elfarra AA, Cooley AJ. Methimazole protection of rats against chemically induced kidney damage in vivo. J Pharmacol Exp Ther. 1991;260:393–401. [PubMed] [Google Scholar]
- Shehin-Johnson SE, Palmer KC, Hines RN. Identification of a tissue-specific DNase I hypersensitive sites in the rabbit flavin-containing monooxygenase form 2 gene. Drug Metab Dispos. 1996;24:891–898. [PubMed] [Google Scholar]
- Shepard EA, Chandan P, Stevanovic-Walker M, Edwards M, Phillips IR. Alternative promoters and repetitive DNA elements define the species-dependent tissue-specific expression of the FMO1 genes of humans and mouse. Biochem J. 2007;406:491–499. doi: 10.1042/BJ20070523. [DOI] [PMC free article] [PubMed] [Google Scholar]
- Tangerman A, Wilcken B, Levy HL, Boers GHJ, Mudd HS. Methionine transamination in patients with homocystinuria due to cystathionine β-synthase deficiency. Metabolism. 2000;49:1071–1077. doi: 10.1053/meta.2000.7709. [DOI] [PubMed] [Google Scholar]
- Tashjian DH, Teh SJ, Sogomonyan A, Hung SS. Bioaccumulation and chronic toxicity of dietary L-selenomethionine in juvenile white sturgeon. Aquat Toxicol. 2006;79:401–409. doi: 10.1016/j.aquatox.2006.07.008. [DOI] [PubMed] [Google Scholar]
- Tijet N, Boutros PC, Moffat ID, Okey AB, Tuomisto J. Aryl hydrocarbon receptor regulates distinct dioxin-dependent and dioxin-independent gene batteries. Mol Pharm. 2006;69:140–153. doi: 10.1124/mol.105.018705. [DOI] [PubMed] [Google Scholar]
- Venkatesh K, Levi PE, Hodgson E. The flavin-containing monooxygenase of mouse kidney. Biochem Pharmacol. 1991;42:1411–1420. doi: 10.1016/0006-2952(91)90453-c. [DOI] [PubMed] [Google Scholar]
- Yan S, Yin M. Protective and alleviative effects from 4 cysteine-containing compounds on ethanol-induced acute liver injury through suppression of oxidation and inflammation. J Food Sci. 2007;72:S511–S515. doi: 10.1111/j.1750-3841.2007.00449.x. [DOI] [PubMed] [Google Scholar]
- Yeung CK, Lang DH, Thummel KE, Rettie AE. Immunoquantitation of FMO1 in human, liver, kidney, and intestine. Drug Metab Dispos. 2000;28:1107–1111. [PubMed] [Google Scholar]