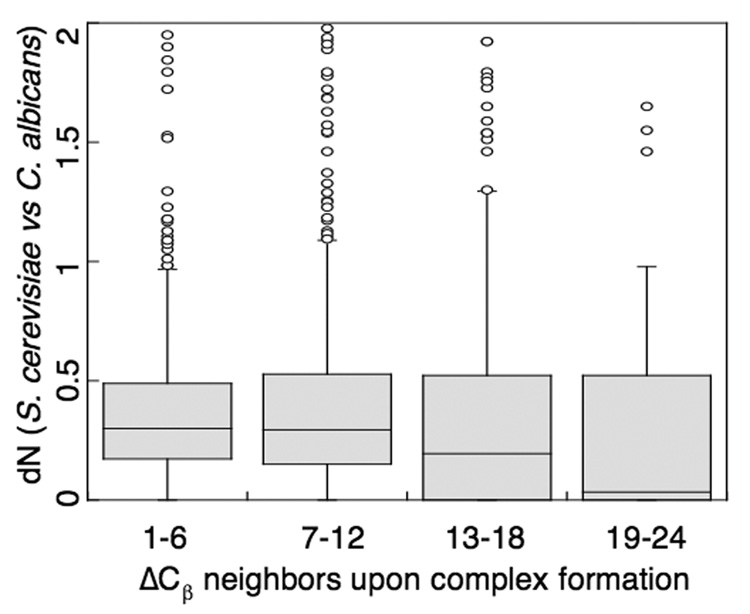
Figure 7.
The evolutionary rates of interface residues depend on the degree of burial upon complex formation. As defined by a Wilcoxon-signed rank test, the dN distributions for all degree of burial bins are significantly different from each other (P < 3e-7) with the exception of the first two bins 1–6, 7–12 (P = 0.58) and the last two 13–18, 19–24 (P = 0.06). Bin 1–6 represents 22,210 residues; bin 7–12, 14,479 residues; bin 13–18, 3,229 residues; bin 19–24, 418 residues. 9 outliers fall outside the upper boundary.

